spectral interpretation using gaussian mixtures and autoencoder
Project description
Description
Spectral Interpretation using Gaussian Mixtures and Autoencoder (SIGMA) is an open-source Python library for phase identification and spectrum analysis for energy dispersive x-ray spectroscopy (EDS) datasets. The library mainly builds on the Hyperspy, Pytorch, and Scikit-learn. The current version only supports .bcf and .emi files. The publication is available here.
(UPDATE) Now SIGMA (version=0.1.31) can load individual images (elemental intensity maps, e.g., *.tif).
Try your dataset on SIGMA with Colab in the cloud:
| Type of data | Colab link |
|---|---|
| SEM |  |
| TEM |  |
| Images |  |
This project has received funding from the European Union's Horizon 2020 research and innovation programme under grant agreement No 101005611: The EXCITE Network. If analysis using SIGMA forms a part of published work please cite the manuscript.
Installation
- Create a Python>=3.7.0 environment with conda:
conda create -n sigma python=3.7 anaconda
conda activate sigma
- Install SIGMA with pip:
pip install emsigma
- Use the notebook in the tutorial folder to run SIGMA.
Workflow of SIGMA
- A neural network autoencoder is trained to learn good representations of elemental pixels in the 2D latent space.

- The trained encoder is then used to transform high-dimensional elemental pixels into low-dimensional representations, followed by clustering using Gaussian mixture modeling (GMM) in the informative latent space.

- Non-negative matrix factorization (NMF) is applied to unmix the single-phase spectra for all clusters.

In such a way, the algorithm not only identifies the locations of all unknown phases but also isolates the background-subtracted EDS spectra of individual phases.
User-friendly GUI
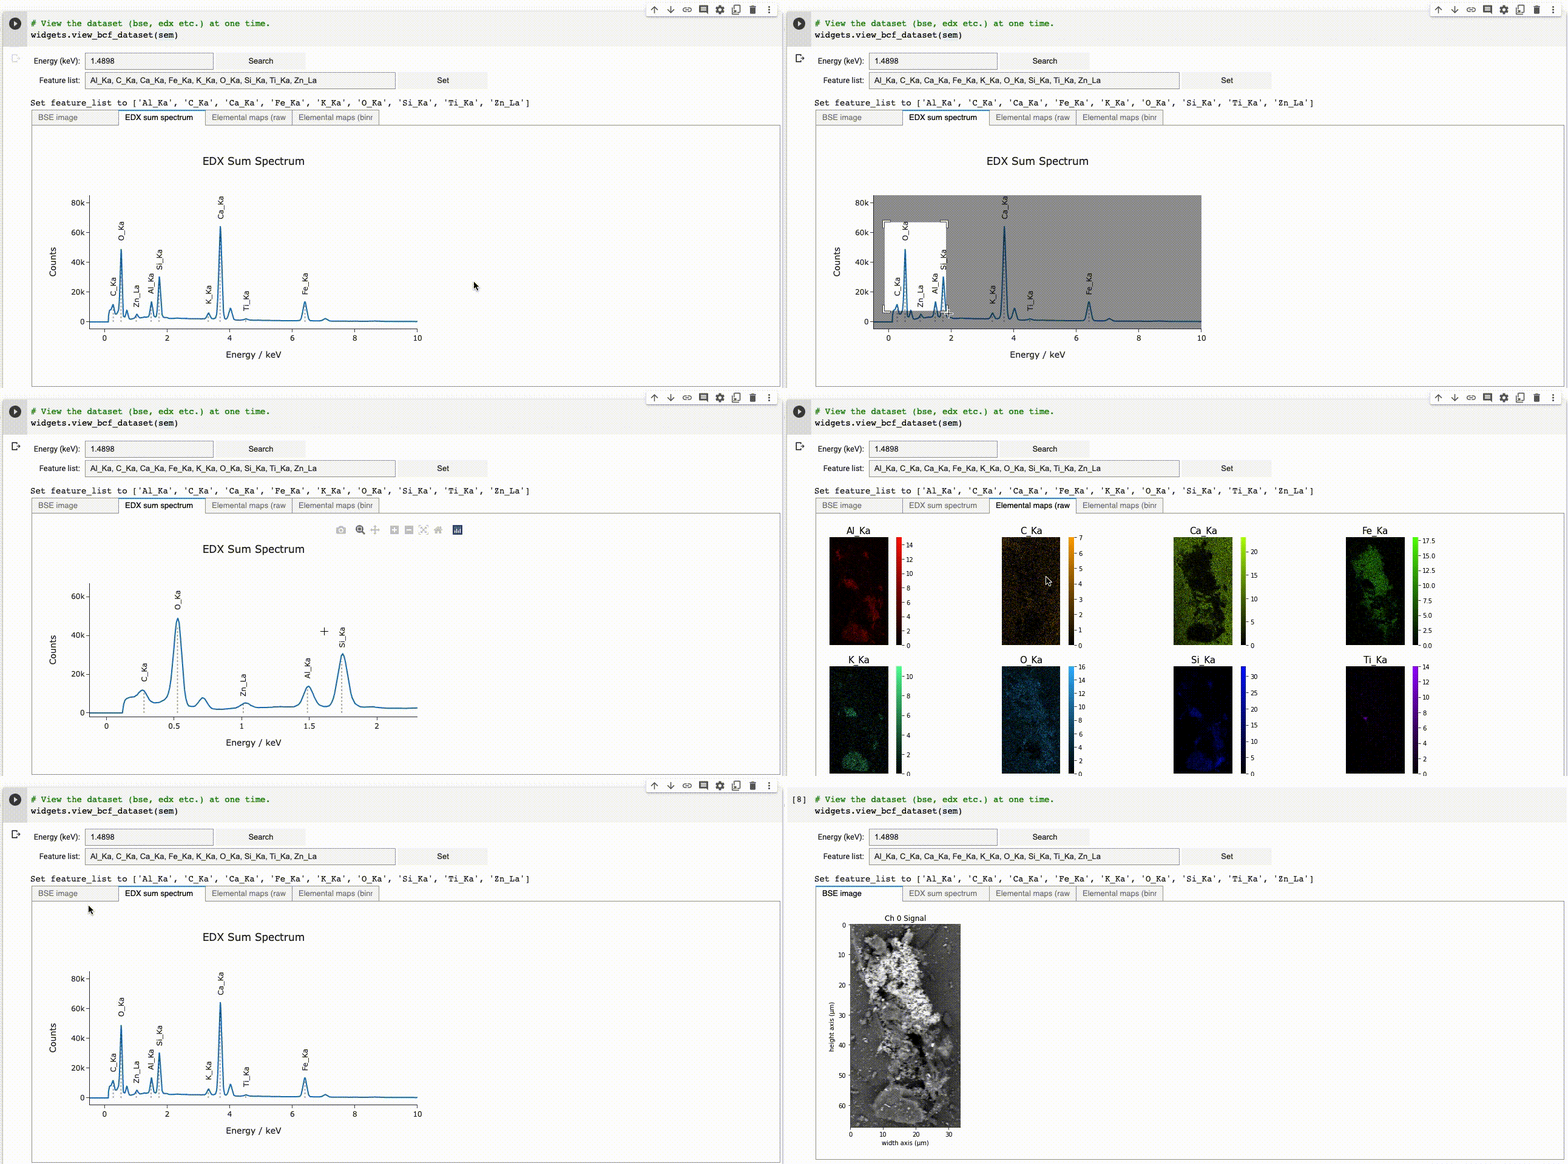
Check .bcf file
An example of checking the EDS dataset and the sum spectrum.
Demo with Colab
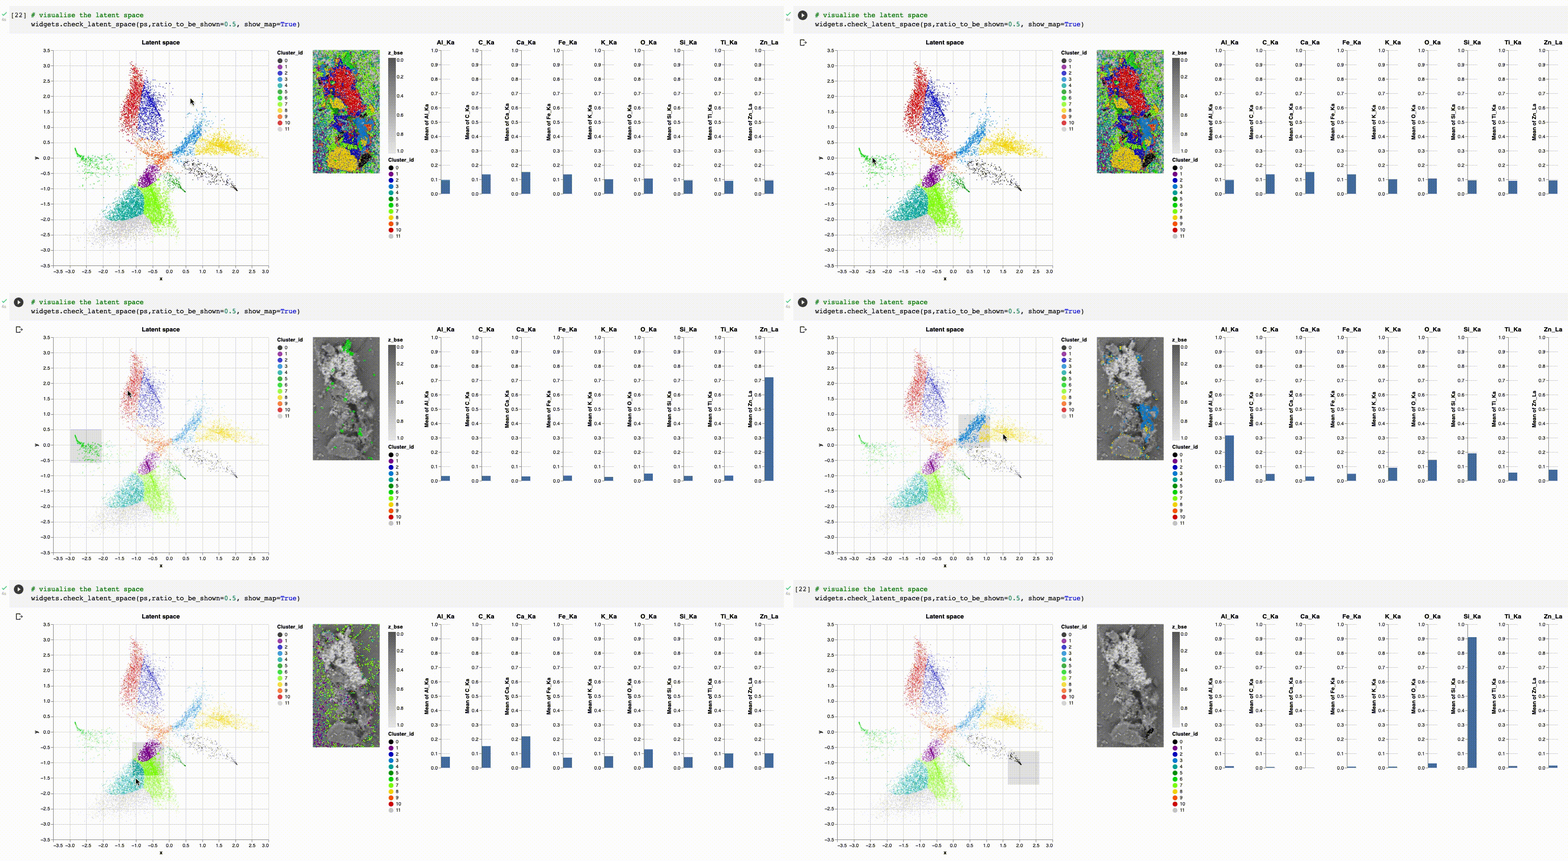
Dimensionality reduction and clustering
An example of analysing the latent space using the graphical widget.
Demo with Colab
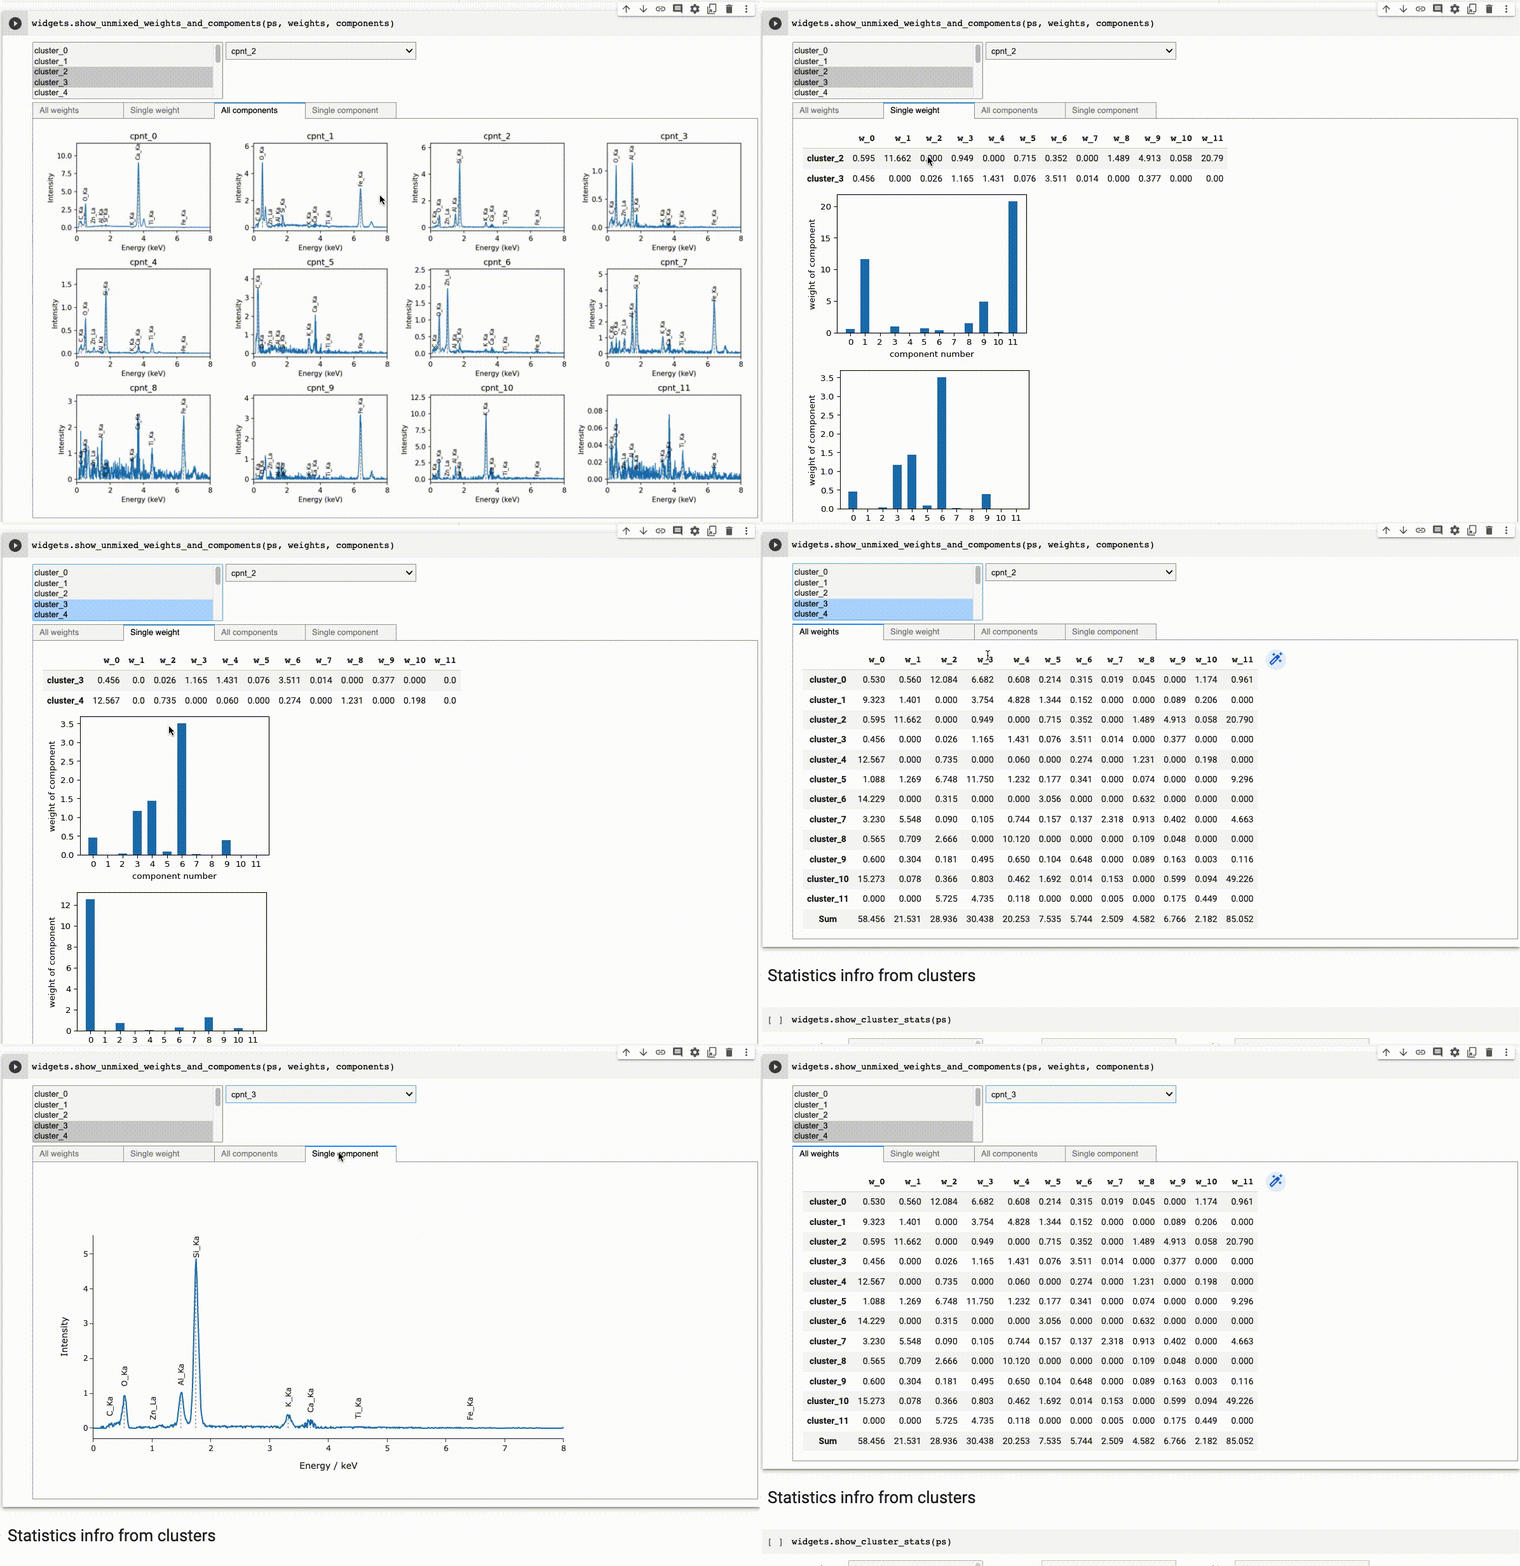
Factor analysis on cluster-wise spectra
A demo of acquiring Background-substracted spectrum using Factor Analysis (FA).
Demo with Colab
Project details
Release history Release notifications | RSS feed
Download files
Download the file for your platform. If you're not sure which to choose, learn more about installing packages.
Source Distribution
File details
Details for the file emsigma-0.1.33.tar.gz.
File metadata
- Download URL: emsigma-0.1.33.tar.gz
- Upload date:
- Size: 42.9 kB
- Tags: Source
- Uploaded using Trusted Publishing? No
- Uploaded via: twine/4.0.2 CPython/3.8.16
File hashes
| Algorithm | Hash digest | |
|---|---|---|
| SHA256 | 3ad40e633778c14b9c31fe91108fe6b1f65a22af5278c1869f8b9f60d265deb2 |
|
| MD5 | 6339208c468214bc8d65a2f3cb16bdf5 |
|
| BLAKE2b-256 | 3fb4dece91804775dfc0025528b5f72cce5668cd8fc67be0e764d2e7286eebb1 |


