
Extended BoxPlots
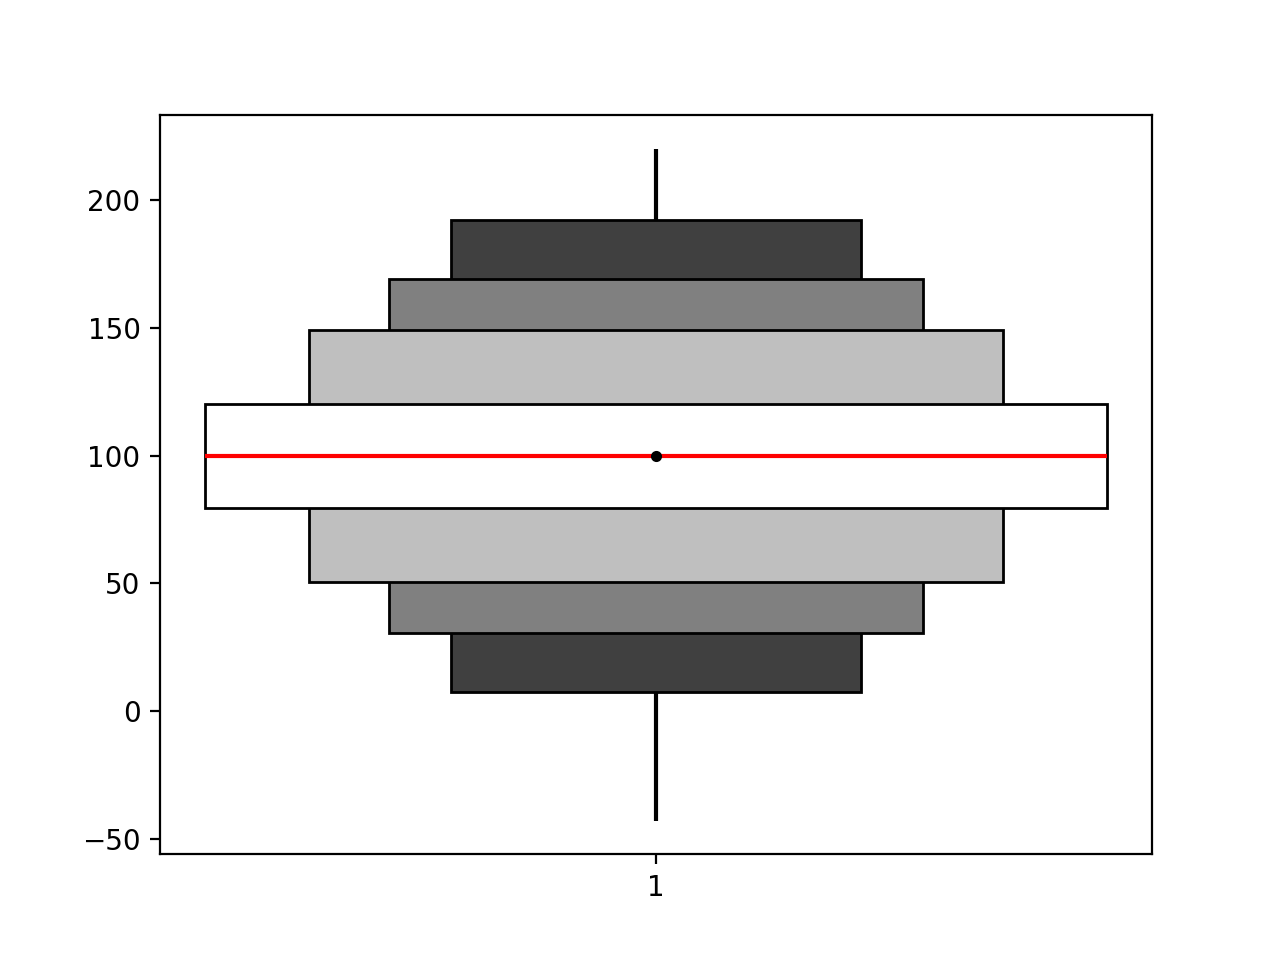
Extended box plot are customizable box plots drawn for a set of percentile pairs (c.f. p. 31 in Harrell Jr (2014)).
Usage
import numpy as np
import matplotlib.pyplot as plt

from extended_boxplots import compute_extended_boxplot_stats, plot_extended_boxplot

# Create sample normal distribution
dist_norm = np.random.normal(100, 30, 100000)

# Compute extended box plot statistics
boxplot_stats = compute_extended_boxplot_stats(dist_norm)

# Plot the extended box plot
fig, ax = plt.subplots()
plot_extended_boxplot(ax, [boxplot_stats])
fig.savefig('extended_boxplot.svg', dpi=200)
Versioning
This project uses semantic versioning.
Copyright and licence
Copyright 2018 D. Meyer. Licensed under MIT.
1 maintainer

Download files
Download the file for your platform. If you're not sure which to choose, learn more about installing packages.
Source Distribution
Extended-BoxPlots-0.3.0.zip
(8.1 kB
view details)
File details
Details for the file Extended-BoxPlots-0.3.0.zip.
File metadata
- Download URL: Extended-BoxPlots-0.3.0.zip
- Upload date:
- Size: 8.1 kB
- Tags: Source
- Uploaded using Trusted Publishing? No
- Uploaded via:
twine/1.14.0 pkginfo/1.5.0.1 requests/2.22.0 setuptools/41.0.1 requests-toolbelt/0.9.1 tqdm/4.32.2 CPython/3.7.3
File hashes
| Algorithm | Hash digest | |
|---|---|---|
| SHA256 |
acfd2a55a8d35089334cb17bf3aa98344115b45602a5cbcb831647a3ee041118
|
|
| MD5 |
f6a387dfbd1af398d2a5d1f4e8135d10
|
|
| BLAKE2b-256 |
8c5c8361ca407eb7212f4238d7c5449ffe423c7af8cb46eb585511302fc4816d
|














