

Quickstart
pip install flowplot
from flowplot import cycle
cycle(r".\user-inputs\cycles\Overall.csv", delimiter=';')
Overview
flowplot is a visualisation and analysis tool for hydrological and general flow-stock, input-output-storage data for Python 🐳
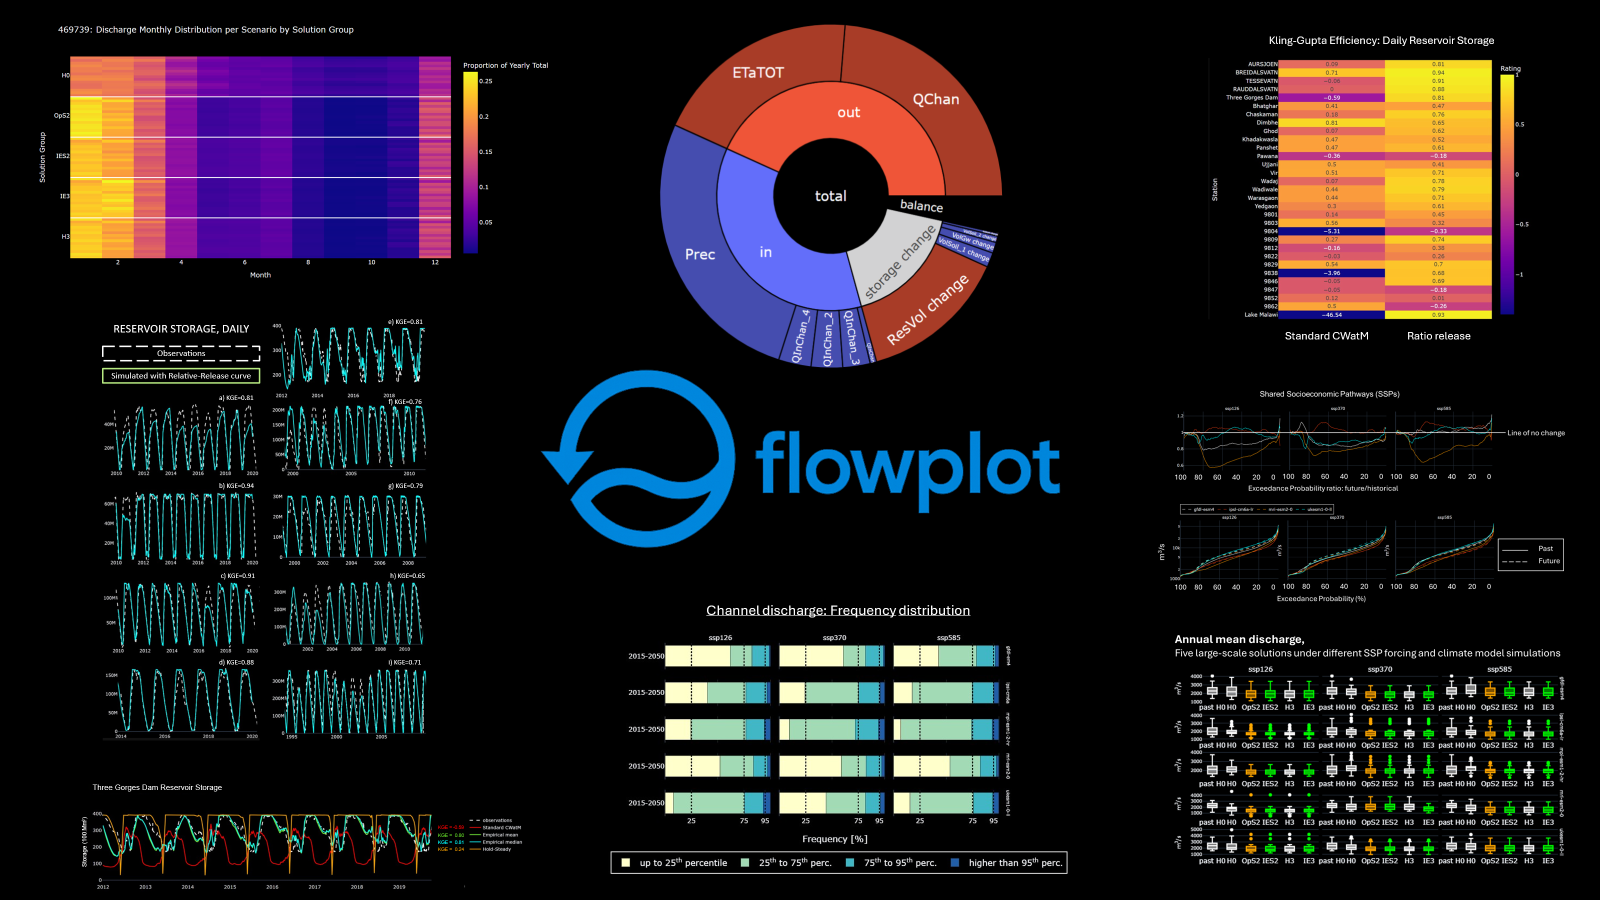
Diagrams include
- Cycle, including Circles, Bar graphs, and Line graphs
- TSCompare Time series of multiple simulations and observations, with statistics
- ExceedanceProb Exceedance probability and comparison, multiple simulations
- BoxWhisker Box-whisker plots, multiple simulations
- HeatSeason Seasonality, multiple simulations
User inputs
user-inputs folder includes:
cycles:
- associates the cycle flows as in, out, storage, and sub-flows
flow time series:
- Contains three columns for the date: YYYY, MM, DD
- Column names match those indicated in the cycles csv above
- There can be several csv files holding flow time series
- Columns hold daily values of flows, with name and unit indicated in cycle csv
Units
- standard
- m3 (meaning m3/day)
- m3s
(meaning m3/second)
- with option num_cells_domain:
-
mmcell (meaning mm/day/averaged across all cells)
-
m3cell (meaning m3/day averaged across all cells)
-
m3scell (meaning m3/second averaged across all cells)
-
- with option cellsize_m2, assuming all cells are the same size in square metres
- mm (meaning mm/day)
cycle(r".\user-inputs\cycles\Overall.csv", delimiter=';', cellsize_m2=1000*1000, num_cells_domain=153451)
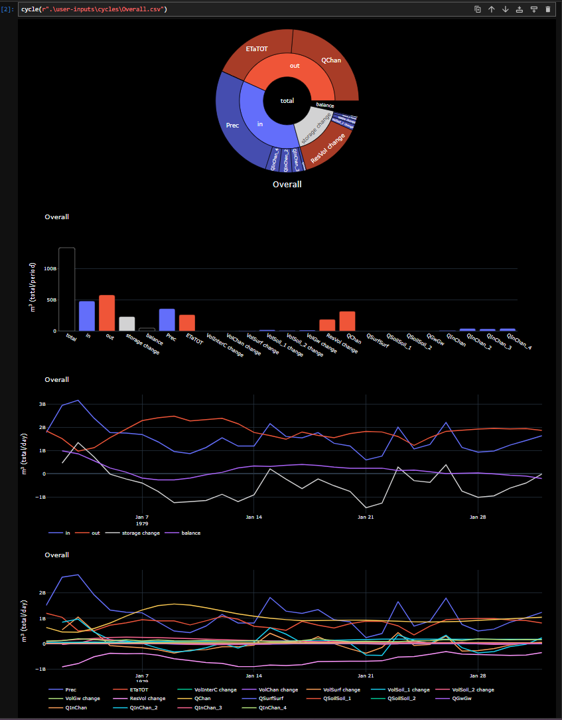
Creates the following diagrams for a user-determined cycle:
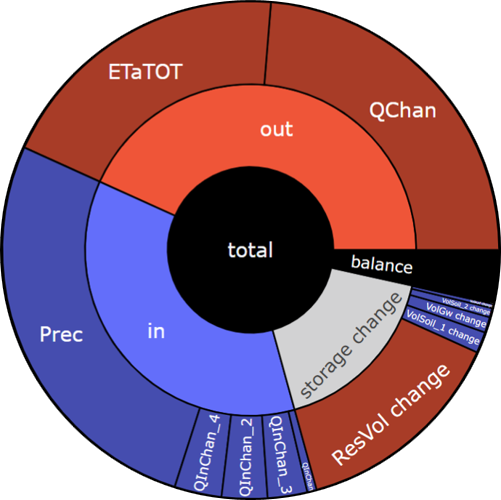
- Circles, showing the partitioned inputs, outputs, net storage changes, and balance, aggregated spatiotemporally;
- Bar graphs, showing the partitioned inputs, outputs, net storage changes, and balance, aggregated spatiotemporal;
- Line graphs, overall, showing the inputs, outputs, net storage changes, and balance through time, aggregated spatially;
- Line graphs, partitioned, showing the partitioned flows through time, aggregated spatially.
1 maintainer

Release files for flowplot 0.0.15
For a detailed explanation of source distributions (sdists) and built distributions (wheels), please see the package formats documentation.
Source distribution (sdist)
| File | Size | Uploaded | |
|---|---|---|---|
| flowplot-0.0.15.tar.gz | 17.8 kB | Details |
Built distribution (wheel)
| File | Interpreter | ABI | Platform | Reset |
|---|---|---|---|---|
| flowplot-0.0.15-py3-none-any.whl | Python 3 | none | any | Details |
Total release size: 35.7 kB
Release files / flowplot-0.0.15.tar.gz
| Download URL | flowplot-0.0.15.tar.gz |
|---|---|
| Size | 17.8 kB |
| Tags | Source |
|
SHA-256 checksum How to use checksums |
aa31e554461cb5baaf5631994d5ce0a33d5676cbd38473342a35dc84d765eebd
|
|
BLAKE2b-256 checksum How to use checksums |
62e91acba99e9a75942c018c6197e564893f953446c67a71ddeab3abc9ec13af
|
| Upload date | |
|
Uploaded using Trusted Publishing? What is trusted publishing? |
No |
| Uploaded via |
twine/6.1.0 CPython/3.12.10
|
Release files / flowplot-0.0.15-py3-none-any.whl
| Download URL | flowplot-0.0.15-py3-none-any.whl |
|---|---|
| Size | 17.9 kB |
| Tags | Python 3 |
|
SHA-256 checksum How to use checksums |
4a2b373dd8684faaba254fb24a5ebb5e11bba991e18849431e553ce2c35f6d7e
|
|
BLAKE2b-256 checksum How to use checksums |
600eb833cda8f8cd38ebed8721eebcb0c0bba779239183ad6edf7c2d1c07b86a
|
| Upload date | |
|
Uploaded using Trusted Publishing? What is trusted publishing? |
No |
| Uploaded via |
twine/6.1.0 CPython/3.12.10
|














