
Gkit


Gkit is a suite of utilities for processing geo-dataset allowing you to manipulate raster datasets like np.MaskedArray.
Gkit supports Python3 and all OS which could install numpy, matplotlib, gdal.
In Python2, may have unpredictable bugs.
Documents: https://titorx.github.io/gkit/html/
Simple Example
Here is examples of some basic features that Gkit provides.
import numpy as np
import gkit as gk

# Read the first band from .tif
r = gk.read("lst.tif")

# You could also specific point out which band you want to load
r = gk.read("lst.tif", 2)

# gk.read returns a Raster class
type(r)
# Output:
# gkit.core.Raster

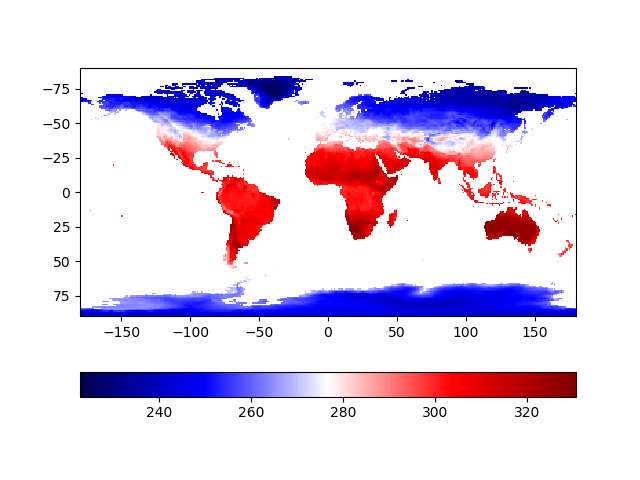
# Open an interactive window display raster using matplotlib(call plt.show)
r.show()
The screenshot:
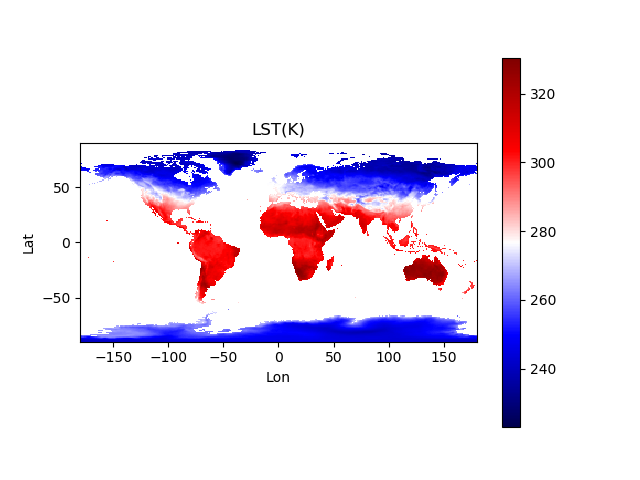
# Only draw raster without calling plt.show.
import matplotlib.pylab as plt
r.plot()
plt.xlabel("Lon")
plt.ylabel("Lat")
plt.title("LST(K)")
plt.colorbar()
plt.savefig("raster_plot.png")
The screenshot:
# Raster class inherits from np.ma.MaskedArray.
# It has all features which MaskedArray has.
r
# Output:
# masked_array(data =
#  [[-- -- -- ..., -- -- --]
#  [-- -- -- ..., -- -- --]
#  [-- -- -- ..., -- -- --]
#  ...,
#  [242.5966339111328 242.6825408935547 242.79612731933594 ...,
#   243.512451171875 243.46498107910156 243.45751953125]
#  [241.1952667236328 241.18592834472656 241.19235229492188 ...,
#   241.02757263183594 241.04196166992188 241.0919189453125]
#  [241.97023010253906 242.03948974609375 242.05393981933594 ...,
#   241.8543243408203 241.85800170898438 241.80813598632812]],
#              mask =
#  [[ True  True  True ...,  True  True  True]
#  [ True  True  True ...,  True  True  True]
#  [ True  True  True ...,  True  True  True]
#  ...,
#  [False False False ..., False False False]
#  [False False False ..., False False False]
#  [False False False ..., False False False]],
#        fill_value = 1e+20)

# Doing operation like common numpy masked array.
tmp = (r - 273.15)**3 / 4
tmp = np.cos(r)
tmp = np.abs(r)
tmp = np.sqrt(r)

print(r.shape)
print(r.mean())
print(r.max())
print(r.min())

# convert data type
tmp = r.astype(np.float64)

# Save to file
r.save("out_file.tif")

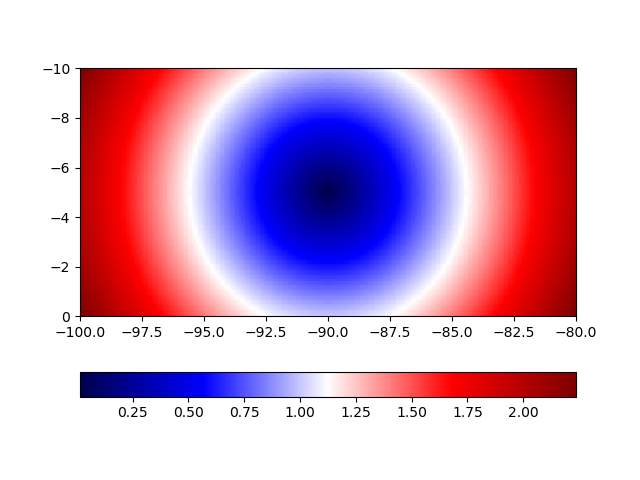
# Create a raster from numpy array
import numpy as np
x, y = np.mgrid[-1:1:100j, -2:2:200j]
array = np.sqrt(x**2 + y**2)

print(array.shape)
# Output:
# (100, 200)

transform = [-100, 0.1, 0, 0, 0, -0.1]

raster = gk.Raster(array, transform)
raster.show()
The screenshot:
1 maintainer

Metadata
1 maintainer
Release files for gkit 0.6.4
For a detailed explanation of source distributions (sdists) and built distributions (wheels), please see the package formats documentation.
Built distribution (wheel)
| File | Interpreter | ABI | Platform | Reset |
|---|---|---|---|---|
| gkit-0.6.4-py3-none-any.whl | Python 3 | none | any | Details |
Release files / gkit-0.6.4-py3-none-any.whl
| Download URL | gkit-0.6.4-py3-none-any.whl |
|---|---|
| Size | 12.7 kB |
| Tags | Python 3 |
|
SHA-256 checksum How to use checksums |
2698fee87976e354d2483eaaedcaeb3d7e301aee45f6f6d08148b25e61b57e71
|
|
BLAKE2b-256 checksum How to use checksums |
42de7f17d08a85362513bf4f6e42e5fee2db0139732440afe9392a24f6051db4
|
| Upload date | |
|
Uploaded using Trusted Publishing? What is trusted publishing? |
No |
| Uploaded via |
twine/1.13.0 pkginfo/1.5.0.1 requests/2.20.1 setuptools/40.6.3 requests-toolbelt/0.9.1 tqdm/4.31.1 CPython/3.7.0
|














