A package for displaying global temperature and co2
Project description
gtemptsi
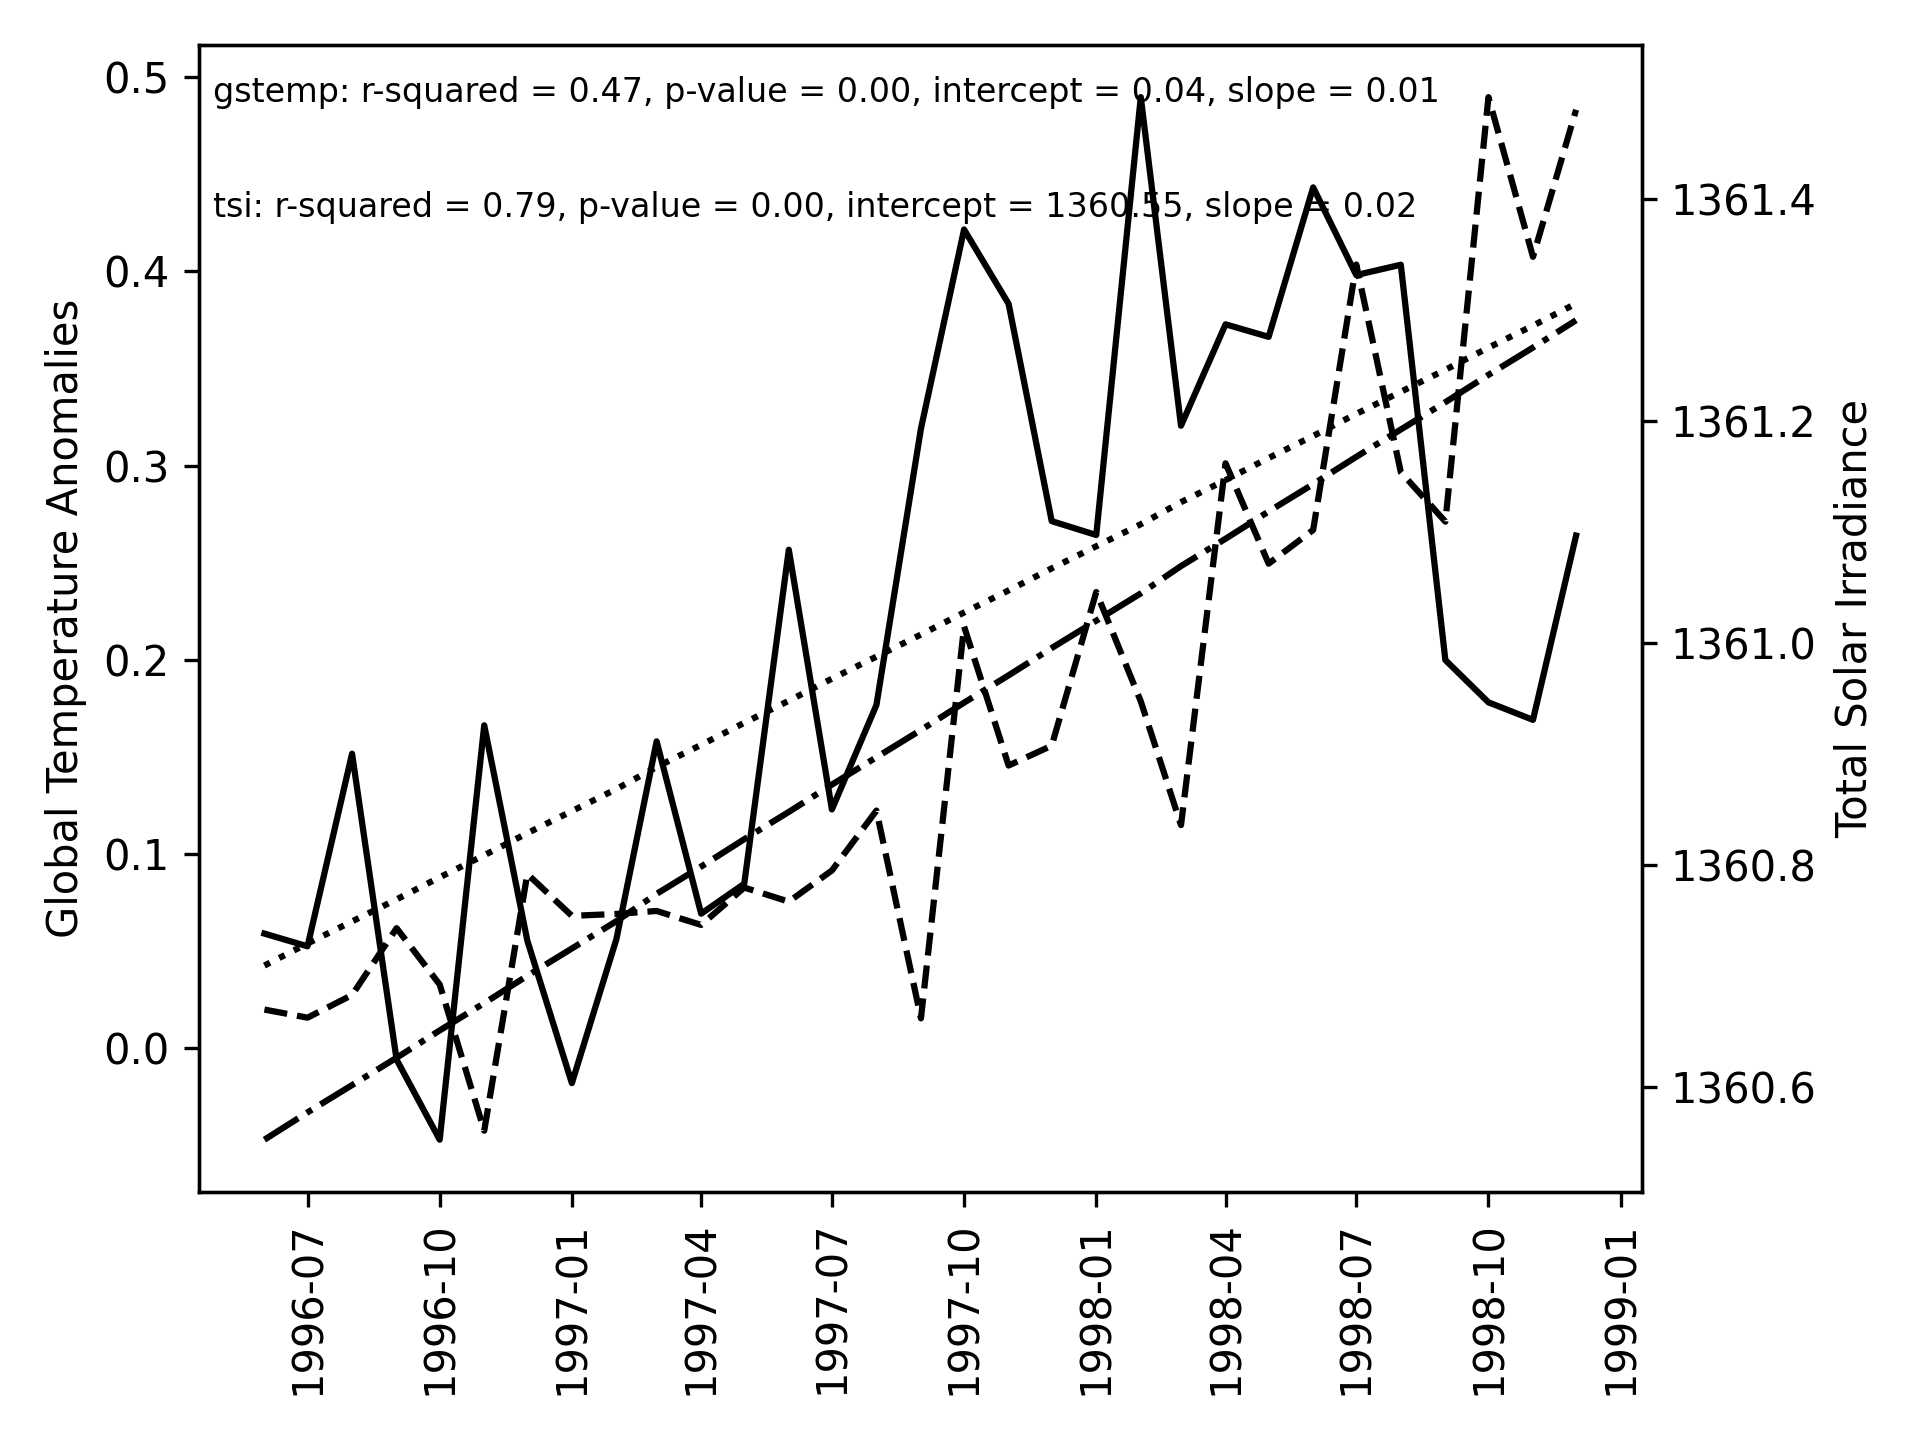
gtemptsi is a PyPI application for visualizing four lines of global surface temperature and total solar irradiance, and their linear-regression lines with R-squared, slope and intercept, and p-value.
NOAA started total solar irradiance (TSI) measurement from 1978. The global surface temperature and TSI are publicly available at the NOAA sites.
TSI (W/m**2): https://www.ncei.noaa.gov/data/total-solar-irradiance/access/monthly/
Global surface temperature (K: Kelvin): https://www.ncei.noaa.gov/data/noaa-global-surface-temperature/v5.1/access/timeseries/
gtemptsi download datasets automatically and save them as tsi.csv (TSI dataset) and noaa.csv (global surface temperature dataset).
How to install gtemptsi
$ pip install gtemptsi
How to run gtemptsi
$ gtemptsi
Enter the beginning year-month (e.g. 1978-11): 1996-06
Enter the end year-month (e.g. 2023-03): 1998-12

solid line: global surface temperature
dotted line: linear regression of temperature
dashed line: TSI
dashdot line: linear regression of TSI

Project details
Release history Release notifications | RSS feed
Download files
Download the file for your platform. If you're not sure which to choose, learn more about installing packages.


