Out-of-box python tool and framework for quantitative trading and study
Project description
Hiquant
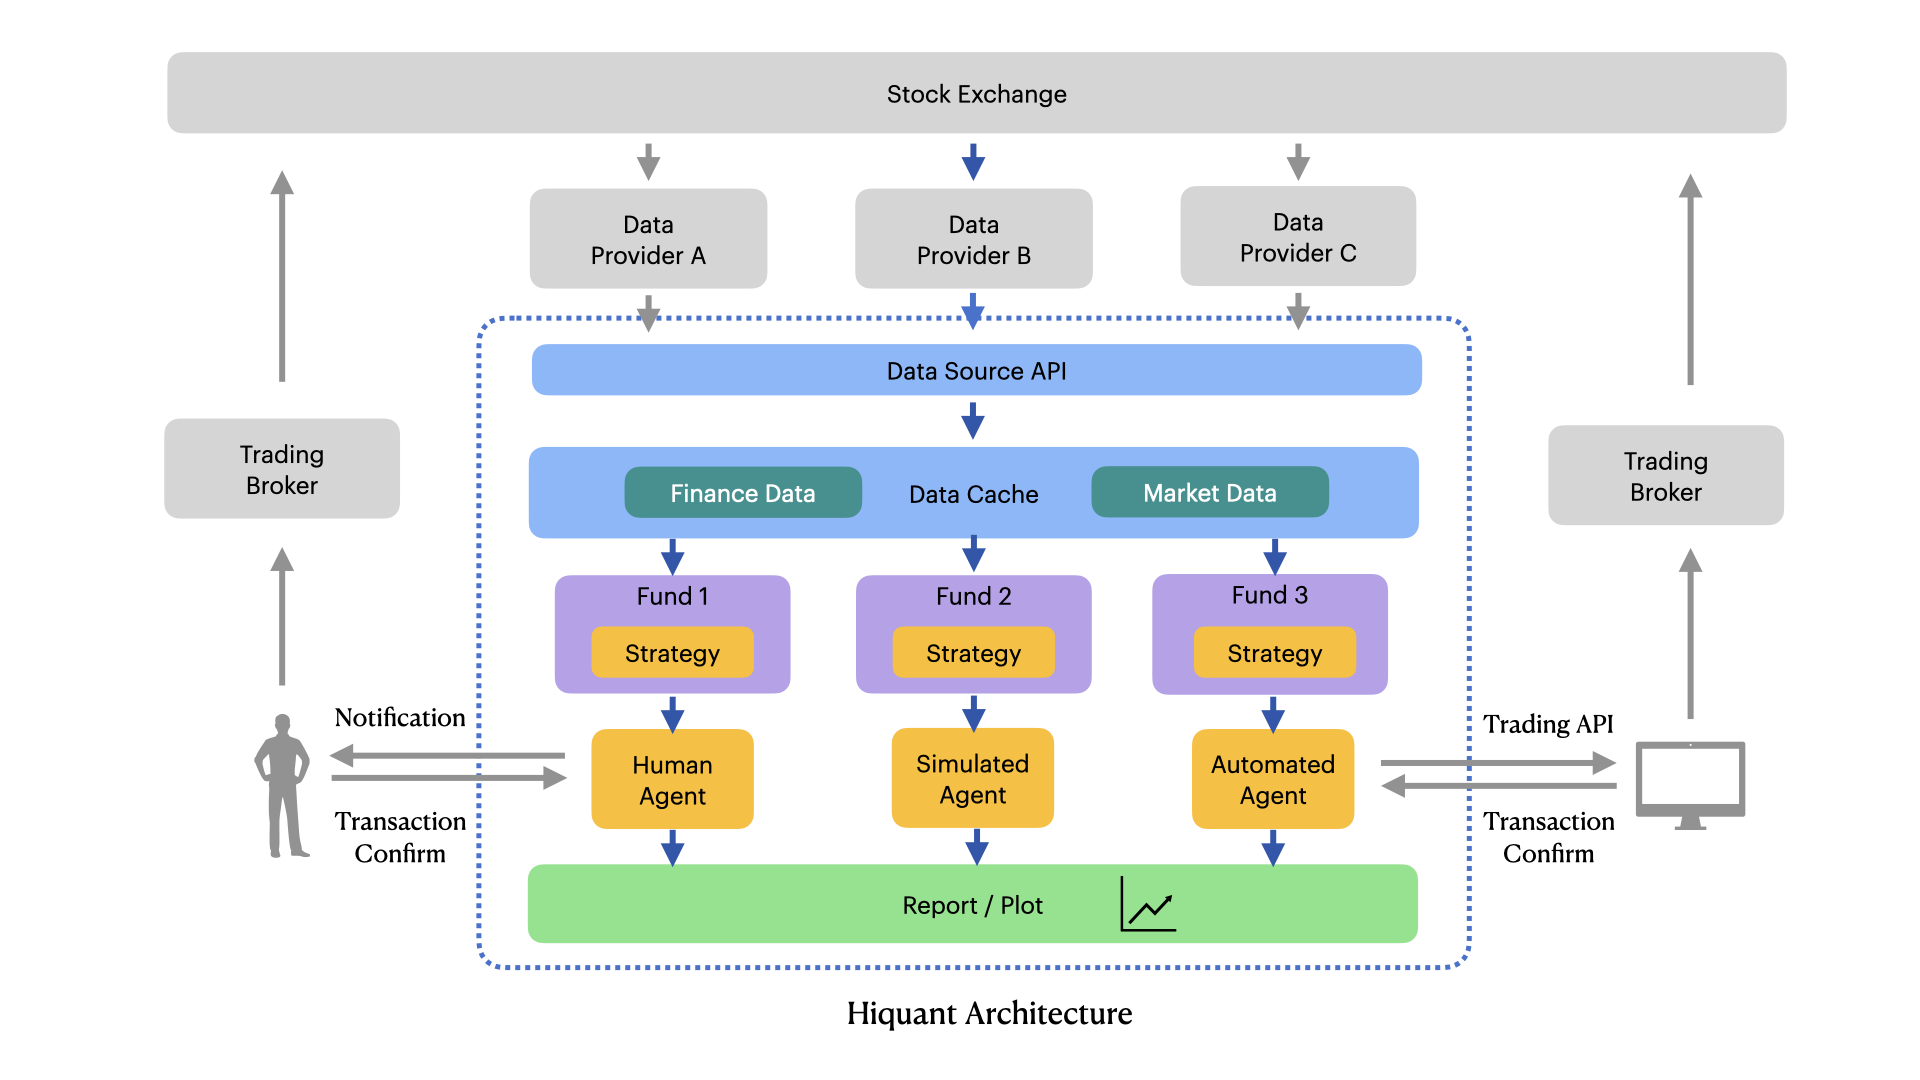
Hiquant is an out-of-box tool and framework for quantitative trading and study.
It can run on any OS with Python 3, suggest Python v3.7+.
This software is developed on Mac, and the examples in this document are written with Mac environment. They are similiar for Linux, but might be a little difference on Windows.
Features
- Data acquisition: fetch the list of stocks and indices, fetch financial reports, historical market quotations, real-time market data, and PE/PB data from financial websites
- Value analysis: extract key financial data from financial reports, calculate annual profit, ROE, net asset growth rate and other indicators, and screen out "value investment" stocks based on specified filter conditions
- Valuation analysis: calculate PE/PB percentiles from PE/PB data, and select “cheap valuation” stocks based on specified filter conditions
- Stock pool: Contains a command to create a "stock pool" csv file, and provides operations such as merging, removing, and intersection
- Strategy Pool: with some trading strategy codes for demo purposes, and provides a command to create a new strategy from the template, which is convenient for users to write their own strategies
- Multi-portfolio: with some fund strategy configurations for demo purposes, and provides a command to create a new configuration from the template
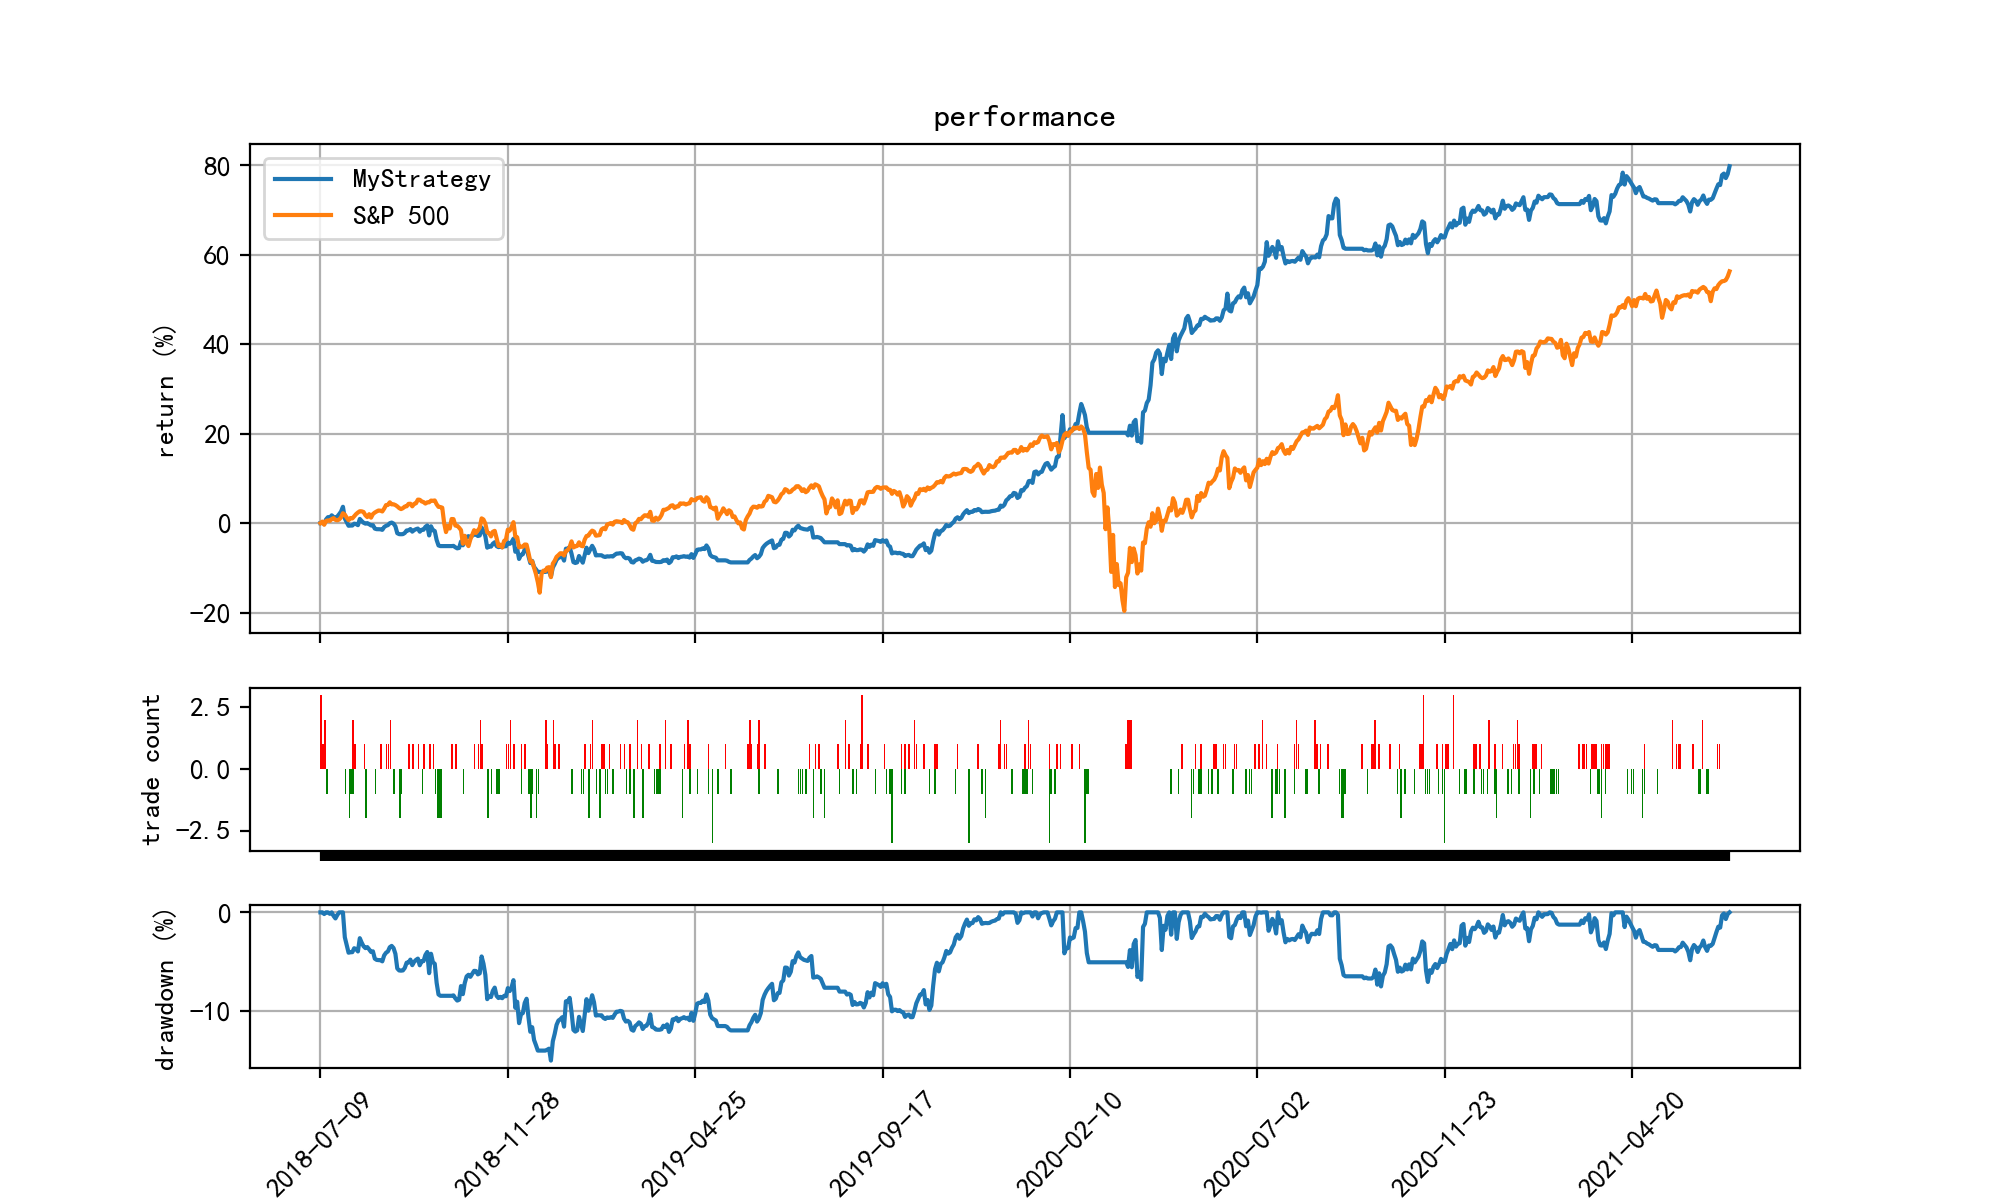
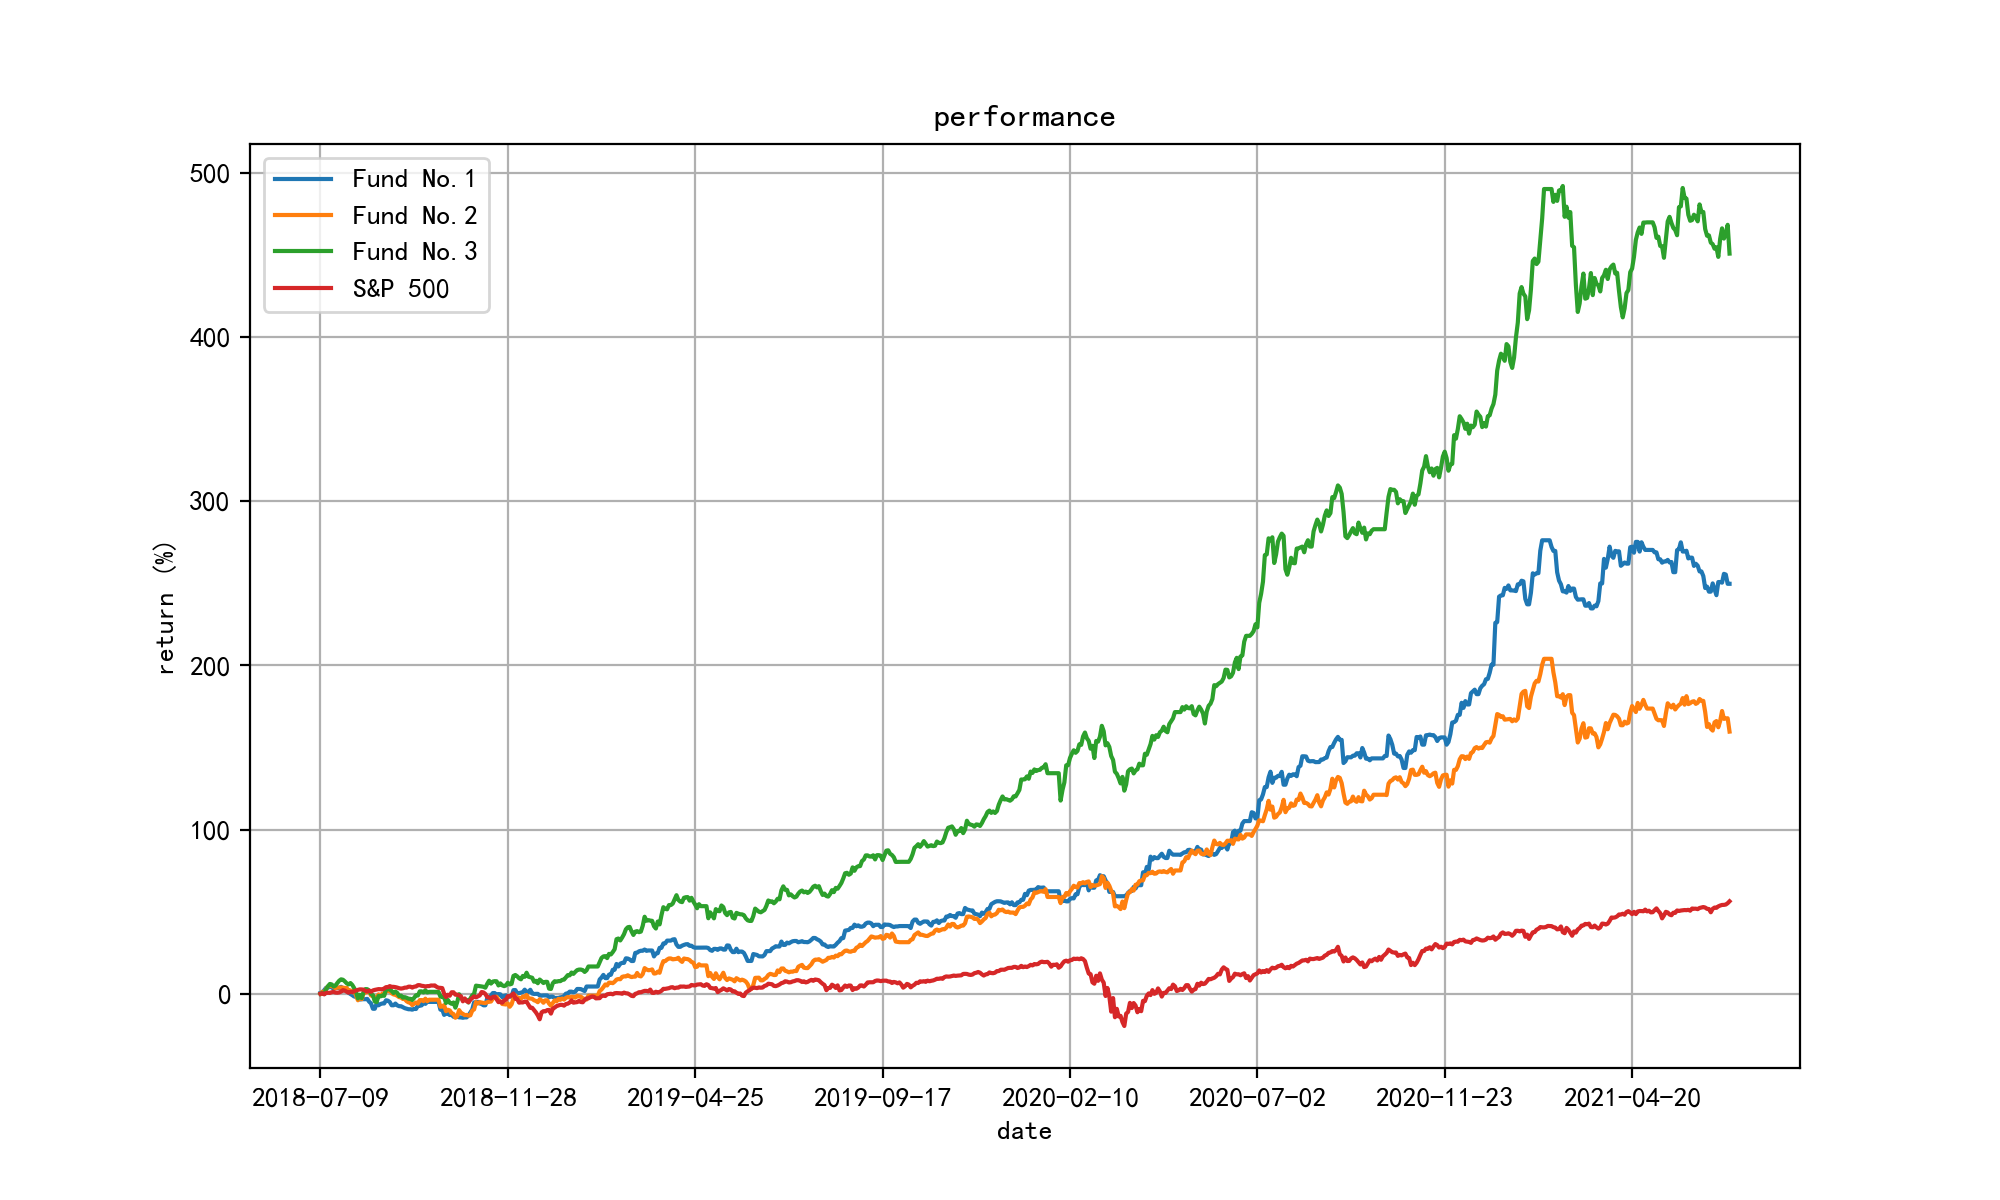
- Simulated backtrade: Use historical market data to simulate backtesting of one or more portfolio strategies, output data analysis of investment returns, and draw yield curves for comparison
- Simulated realtime trading: Synchronize real-time market data, calculate trading decisions based on strategies, and send email notifications to remind users to trade
- Multi markets: currently supports China market (mainland and Hongkong) and USA market, will add support for markets in other countries
- TODO: Automated trading: call the quantitative trading interface to realize automated trading (not yet implemented, planned)
Other additional features:
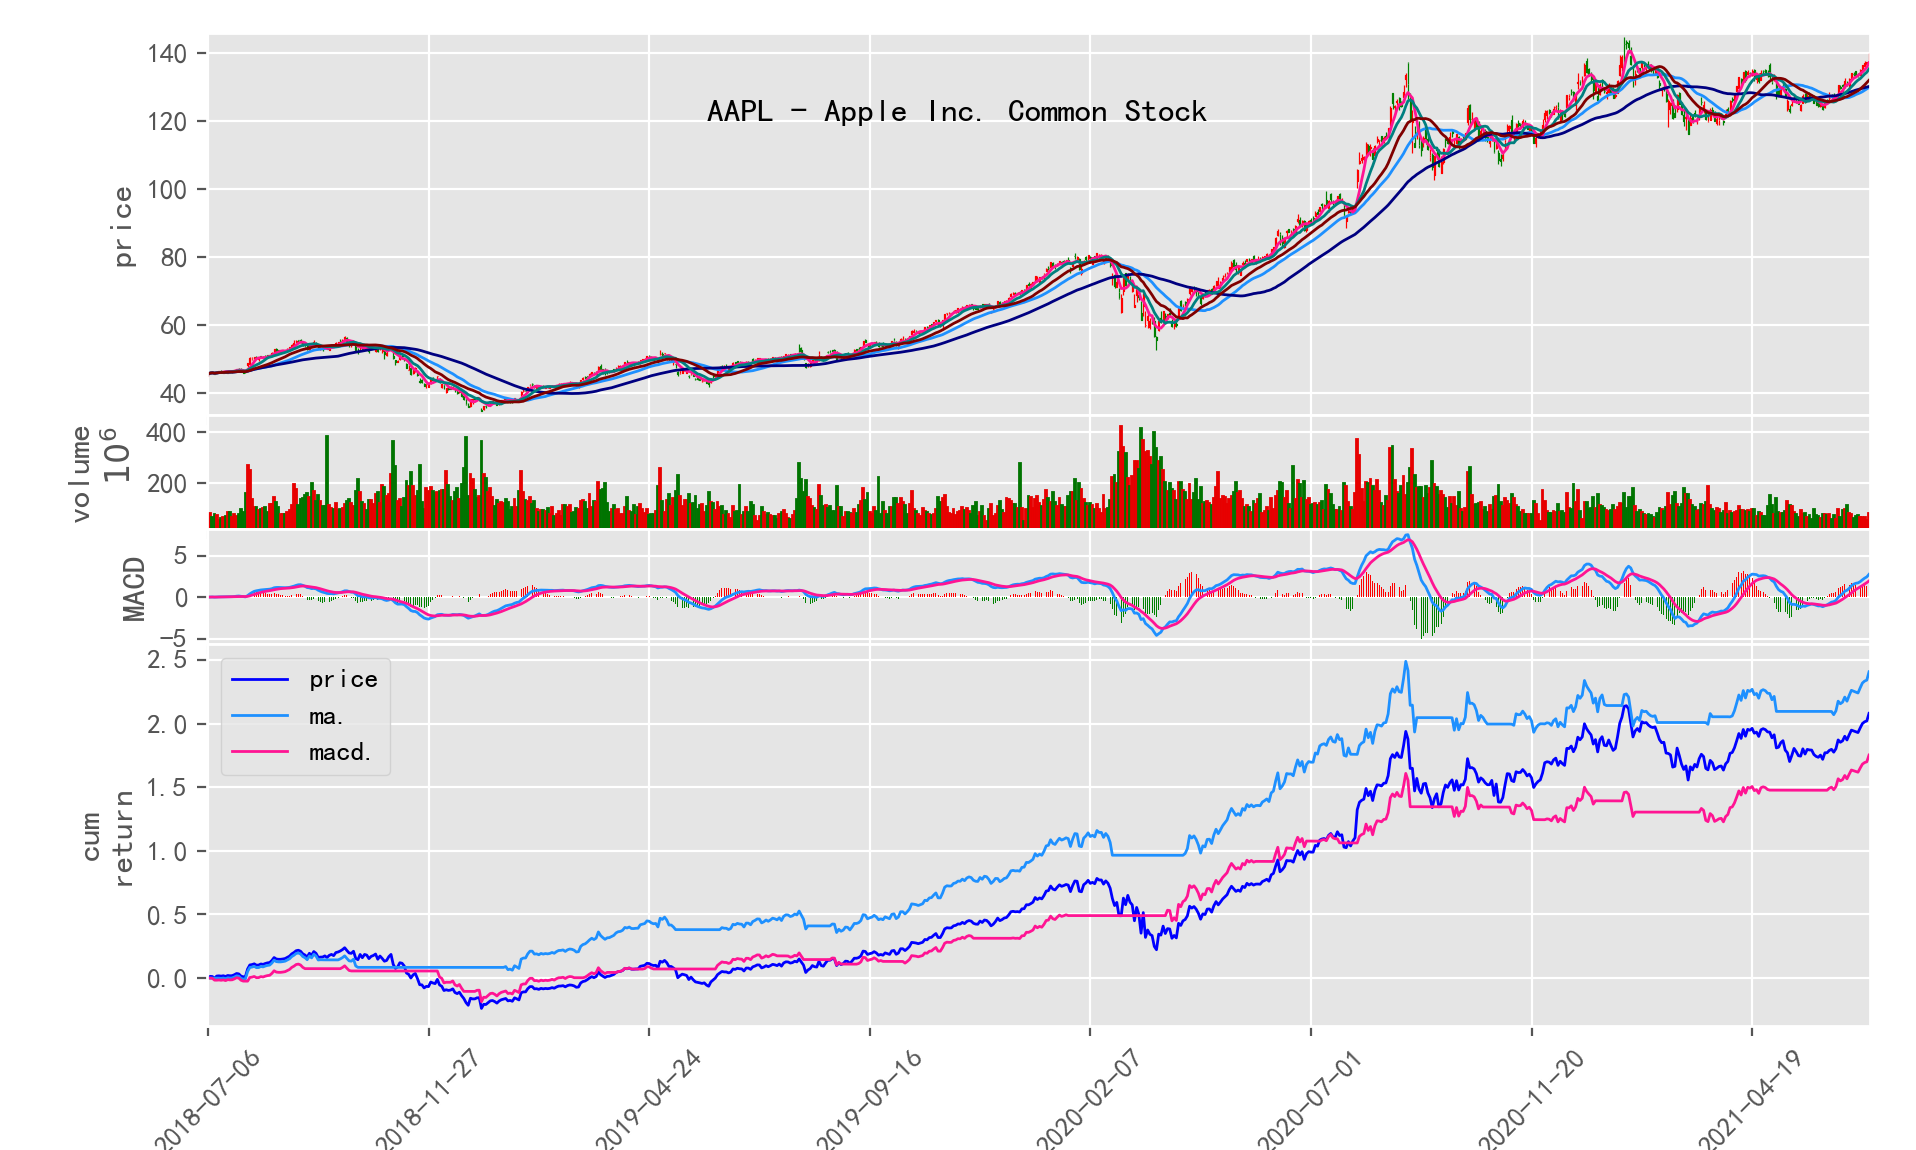
- K-line chart: plot the K-line chart of stocks/indices, including plotting common technical indicators, comparing the profit results of trading based on the indicators
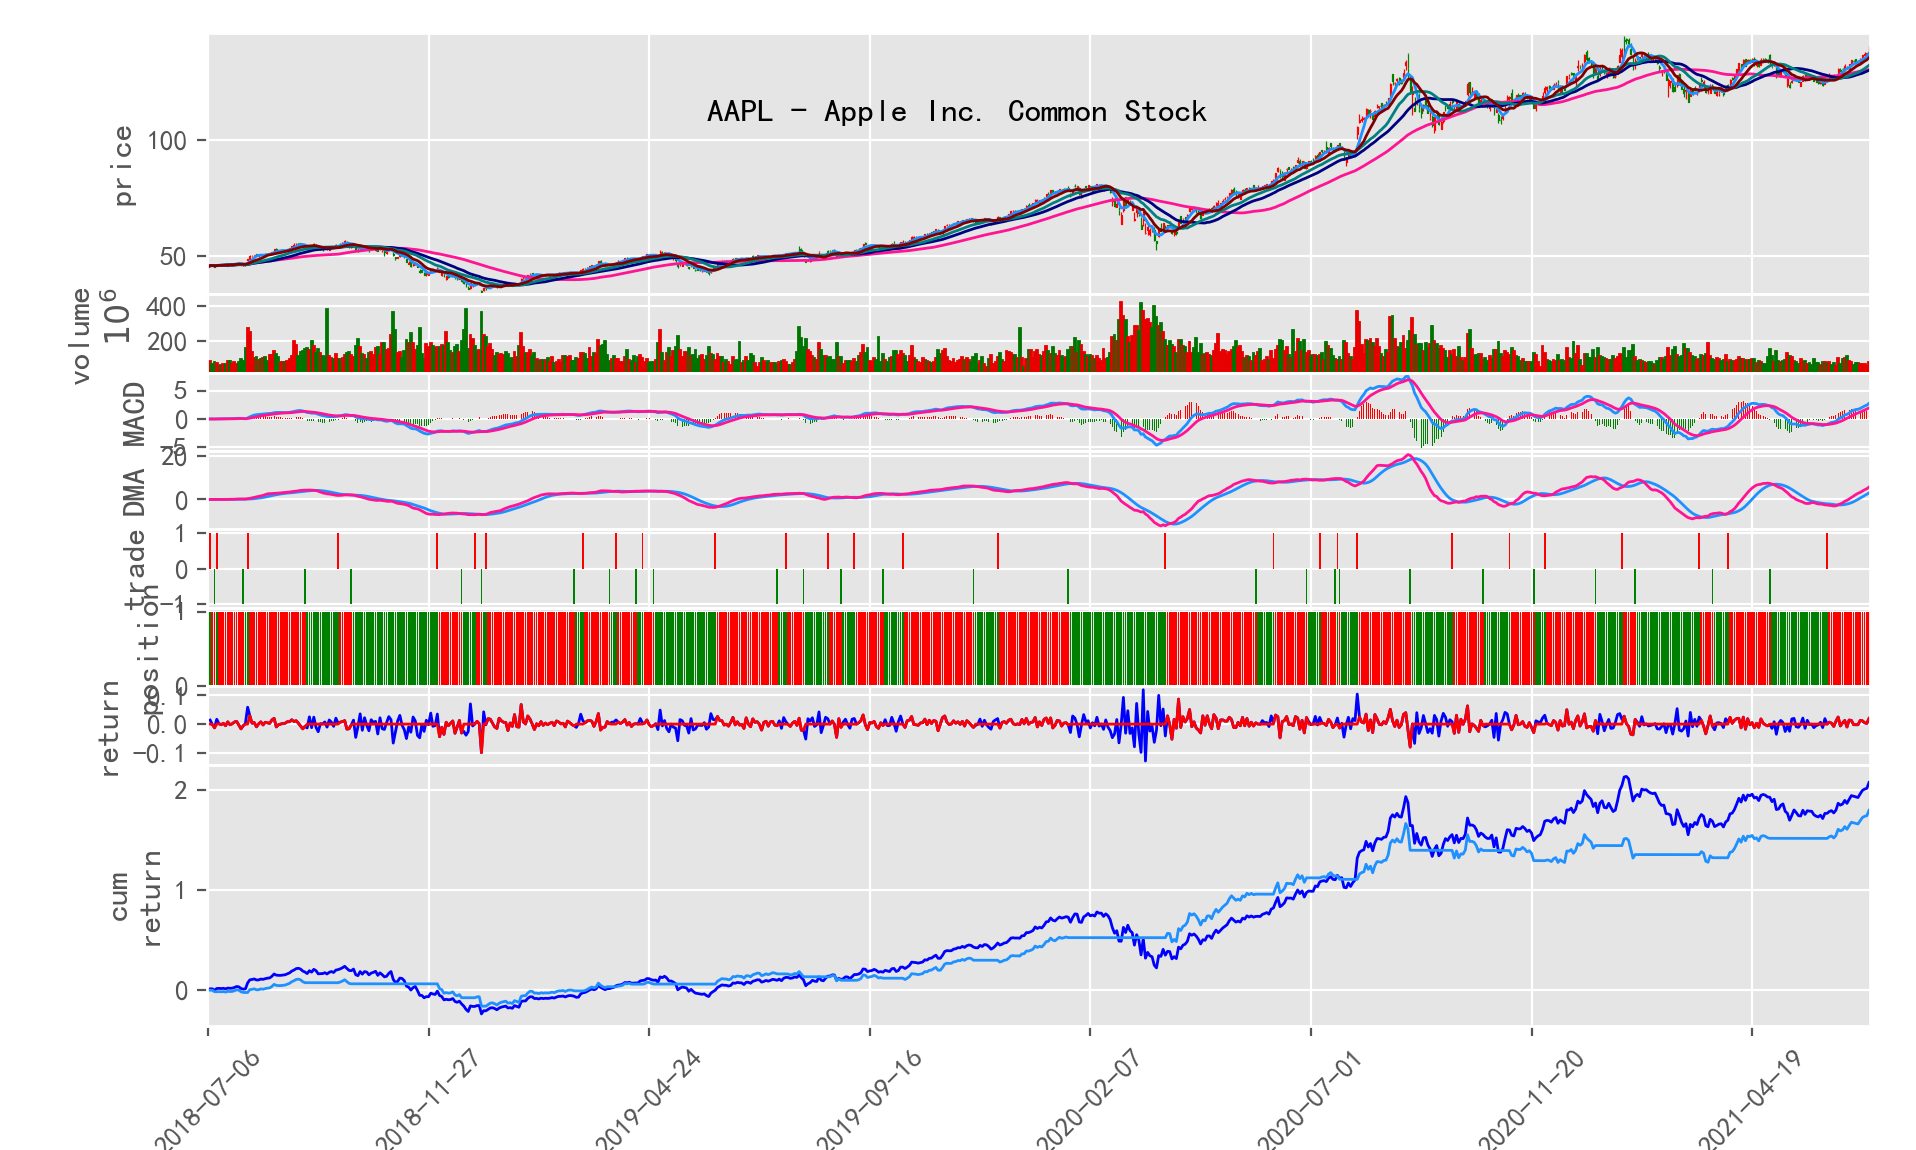
- Multi-indicator combination: When drawing a K-line chart, you can also mix signals from multiple indicators for trading, and display trading actions, holding time, and yield curve
- Indicator test: Use historical data and technical indicators to test the stocks in the stock pool and find the most effective technical indicators for each stock
Installation
Please make sure your Python is v3.7 or above, as it's required by Matplotlib 3.4 for plottting.
python3 --version
python3 -m pip install hiquant
Or, clone from GitHub:
git clone https://github.com/floatinghotpot/hiquant.git
cd hiquant
python3 -m pip install -e .
Command quick start
hiquant create myProj
cd myProj

hiquant index list us
hiquant stock list us

hiquant stock plot AAPL -ma -macd -kdj
hiquant stock plot AAPL -all
hiquant stock plot AAPL -wr -bias -mix

hiquant stock pool AAPL GOOG AMZN TSLA MSFT -out=stockpool/mystocks.csv

hiquant strategy create strategy/mystrategy.py
hiquant backtest strategy/mystrategy.py

hiquant trade create etc/myfund.conf
hiquant backtrade etc/myfund.conf
hiquant run etc/myfund.conf
Code quick start
import pandas as pd
import hiquant as hq

class MyStrategy( hq.BasicStrategy ):
    def __init__(self, fund):
        super().__init__(fund, __file__)
        self.max_stocks = 10
        self.max_weight = 1.2
        self.stop_loss = 1 + (-0.10)
        self.stop_earn = 1 + (+0.20)

    def select_stock(self):
        return ['AAPL', 'MSFT', 'AMZN', 'TSLA', '0700.HK']

    def gen_trade_signal(self, symbol, init_data = False):
        market = self.fund.market
        if init_data:
            df = market.get_daily(symbol)
        else:
            df = market.get_daily(symbol, end = market.current_date, count = 26+9)

        dif, dea, macd_hist = hq.MACD(df.close, fast=12, slow=26, signal=9)
        return pd.Series( hq.CROSS(dif, dea), index=df.index )

    def get_signal_comment(self, symbol, signal):
        return 'MACD golden cross' if (signal > 0) else 'MACD dead cross'

def init(fund):
    strategy = MyStrategy(fund)

if __name__ == '__main__':
    backtest_args = dict(
        #start_cash= 1000000.00,
        #date_start= hq.date_from_str('3 years ago'),
        #date_end= hq.date_from_str('yesterday'),
        #out_file= 'output/demo.png',
        #parallel= True,
        compare_index= '^GSPC',
    )
    hq.backtest_strategy( MyStrategy, **backtest_args )
Usage
Read following docs for more details:
Develop with Hiquant
Read this document on how to develop with Hiquant:
Screenshots
- Draw stock indicators and yield curve
hiquant stock AAPL -ma -macd
- Draw trade signal of mixed indicators, holding time, and yield curve
hiquant stock AAPL -ma -macd -mix
-
Backtrade with one portoflio
-
Backtrade with multiple portoflios
-
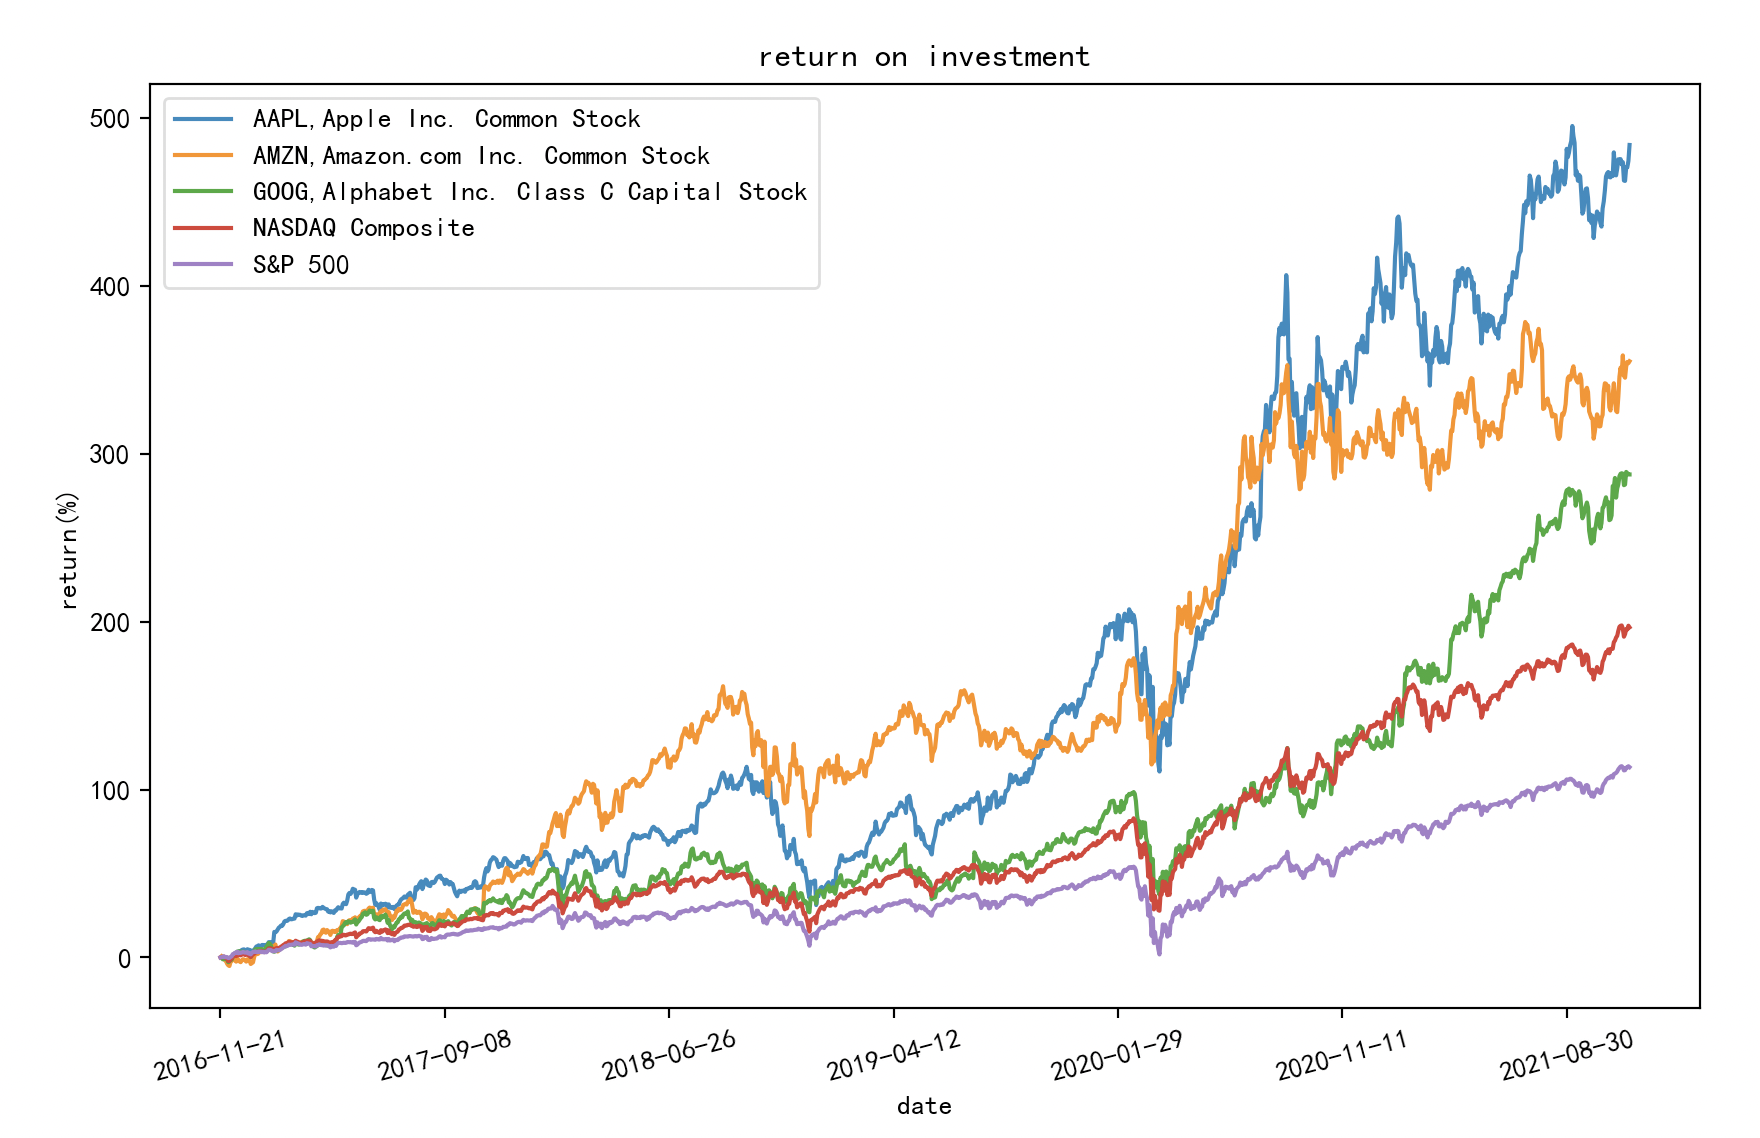
Compare ROI of multiple stocks
hiquant stock plot AAPL GOOG AMZN -years=5 "-base=^IXIC,^GSPC"
Credits
Great appreciate developers of following projects. This project is based on their great works: Pandas, Matplotlib, Mplfinance, Akshare, etc.
Thanks folloowing websites for providing data service: Sina, Legu, Yahoo, Nasdaq, etc.
Thanks the warm-hearted knowledge sharing on Zhihu and Baidu websites.
Disclaimer
This software and related codes are for research purposes only and do not constitute any investment advice.
If anyone invests money in actual investment based on this, please bear all risks by yourself.
Project details
Release history Release notifications | RSS feed
Download files
Download the file for your platform. If you're not sure which to choose, learn more about installing packages.


