iLOSCAR_win
Project description
iloscar
A web-based interactive carbon cycle model, built upon the classic LOSCAR model. Forward and inverse mode incorporated.
Author: Shihan Li.
For any questions, please contact shihan@tamu.edu
Install it from PyPI
pip install iloscar
Usage
from iloscar import iloscar_run

iloscar_run()
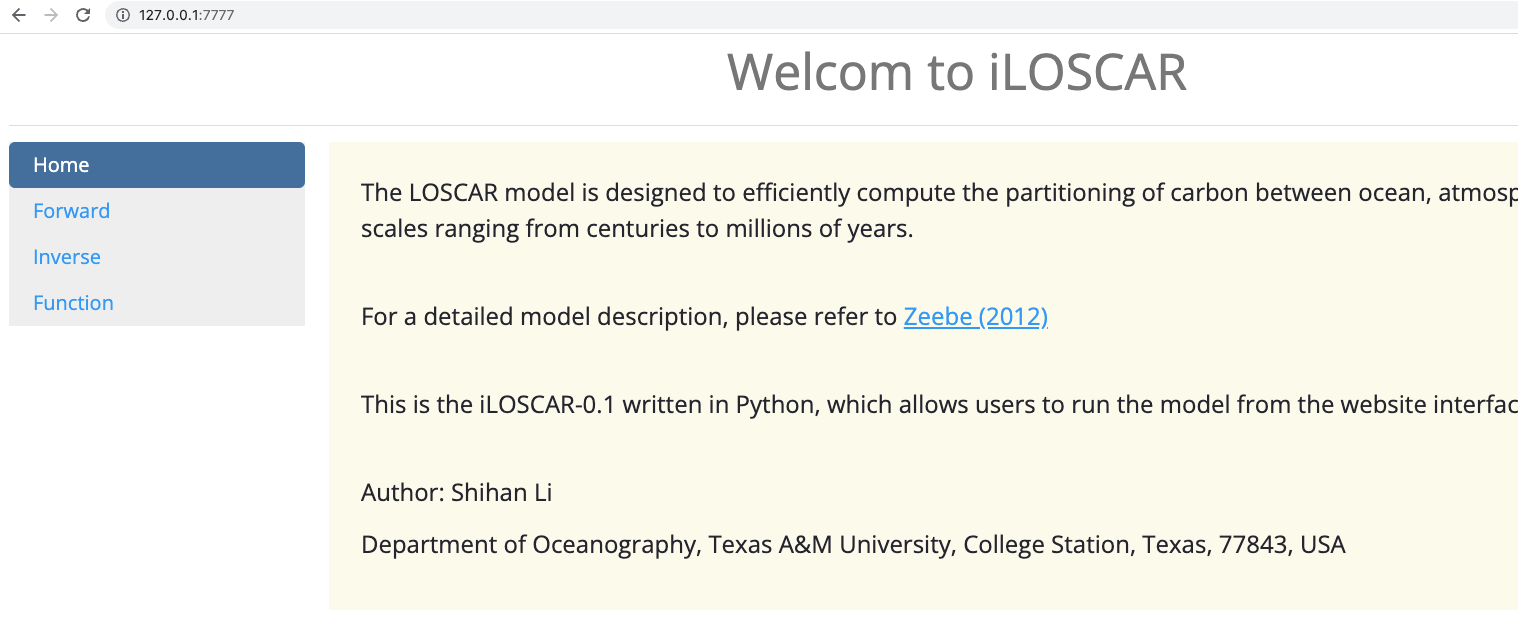
Open http://127.0.0.1:7777/ to run the model.
Model description
The overall framework of iLOSCAR is built upon the LOSCAR (Long-term Ocean-atmosphere Sediment CArbon cycle Reservoir). LOSCAR is a carbon cycle box model that can operate on both short-term (centuries) and long-term (millions of years) time scales, efficiently computing the partitioning of carbon between various model components (ocean, atmosphere, and sediments). The thorough description of the equations and corresponding processes in the model is given in Zeebe (2012). Here I will briefly introduce the original forward model from the mathematic perspective, and the algorithm for the inverse model.
The ocean component in LOSCAR is composed of three (four in the palaeo version) ocean reservoirs (Atlantic, Indian, Pacific, and Tethys in the palaeo set-up). Each of the basins is further subdivided into three depth boxes (surface, intermediate, and deep) and there is one gereric box representing the high latitude ocean. The ocean part is coupled with a genuine sediment model, which contains 13 layers of diffenrent depths and calculates %CaCO3 in each layer.
LOSCAR keeps track the concentrations of various biogeochemical tracers (including total carbon-TC, total alkalinity-TA, stable carbon isotopes-13C, and others) in different boxes. These tracers compose the state variables ($\overrightarrow{y_i}$) of the model and their dynamic changes over time are governed by the following first-order ordinary equation system (Zeebe, 2012):
$$\frac{d\overrightarrow{y_i}}{dt} = F(t, \overrightarrow{y_i}) \text{ } Eq. 1$$,
where $t$ is time, and F is a konwn function to calculate the derivatives of $\overrightarrow{y_i}$. The dimension of $\overrightarrow{y_i}$ is 140 (modern setup) or 184 (palaeo setup). Note that model parameters required for derivative calculation except the state variables are implicitly included in the function F. For the convenience of introducing the inverse algorithm, we rewrite Eq. 1 as: $$\frac{d\overrightarrow{y_i}}{dt} = f(\overrightarrow{y_i}, \lambda, \theta (t) \text{ } Eq. 2$$,
where $\lambda$ represents the assembly of time-invariant parameters and $\theta$ for the time-dependent parameters. $\lambda$ can be subdivided into three categories: i. the model architecture settings (e.g., ocean volume and areas, oceanic Mg and Ca concentrations, the area percentage of each sediment layer, the thermohaline intensity et al.,); ii. initial fluxes and correponding isotopic values (e.g, the initial silicate and weathering fluxes, the initial primary productivity in the high box, et al.,); iii. to describe the dynamic evolution of each flux (e.g., the calcite dissolution constant, silicate and carbonate weathering exponent, air-sea CO2 exchange coefficient, biopump efficiency, rain ratio et al.,). In most LOSCAR applications, the flux from possilbe carbon input sources is the only item in $\theta$ (termed $fcinp$).
According to Eq.2, we can define two main glasses main classes of problems in the carbon cycle study: forward solution and parameter estimation inversely from the data. The first type of models solve the temporal evolution of $\overrightarrow{y_i}$ with $f, \lambda, \theta$ are known and $y(t=0)$ is given, while the latter type starts from available records (e.g., proxy-derived pH, pCO2 records) and aims to find out parameters $lambda and theta$ that best describe the observed data. Usually only several parameters of key interest in $lambda and theta$ will be inversely constrained.
In iLOSCAR, the forward model allows user to tune parameters of interest and runs experiments in the same way as in LOSCAR. The inverse model draws the emission trajectory constrained by the proxy records data in a single run. In both models, users can tune the model parameters and run experiments from a web-based interface interactively instead of diving into the complex code files.
Forward model
There are three innovations in the iLOSCAR compared with the original LOSCAR model. Firstly, it is written in the open source Python language, which is a higher-level programming language than C used in LOSCAR. Thus, the iLOSCAR will be availble to a wider audience and advanced computation packages can be easily applied. Secondly, to comprimise the reduction of running speed caused by switching the programming lanuage, Numba is used to accelerate the model. Also, the original function for the oceanic carbonate system is vectorized to perform calculation from multi-inputs. Lastly, LSODA from scipy package is chosen as the ODE solver due to its stability in stiff systems.
Inverse model
The aim of inverse model is to estimate the carbon emission trajectory (i.e., fcinp(t)) from the given target records (i.e., pCO2 and mean sea surface pH, termed as x(t)) and to constrain the carbon isotopic value (d13c(t)) according to the mean sea surface d13c record (i.e., fd13c(t)).
x(t) can be derived from each given $\overrightarrow{y}(t)$ (pCO2 is a state variable and pH in each ocean box can be caculated from two state variables: TA and ALK.). We generalize the relationship as:
$$x(t) = g(\overrightarrow{y}(t)) \text{ } Eq. 3$$
where $\overrightarrow{y}(t)$ can be solved from Eq. 2 when $lambda$, $\overrightarrow{y}(t=0)$, $fcinp(t)$ are given. Note that fd13c(t) only controls the 13C/12C ratio of input carbon and has no effect on x(t). Here we take $lambda$ and $\overrightarrow{y}(t=0)$ are fixed and $fcinp(t)$ could be adjusted to produce x(t) that makes the best fit with proxy records (X(t)). Then Eq. 3 can be further written as:
$$x(t) = G(fcinp(t)) \text{ } Eq. 4$$.
Theoretically carbon emission could be intermittent and spontaneous, thus it is adventurous to simplify $fcinp(t)$ to some known distributions. However, some assumption is inevitable to reduce the parameters required to describe $fcinp(t)$. Therefore, we seperate the input scenario to (n-1) intervals by n points from X(t) time series data, and in each interval, we assume a linear increase/decrease of emission rate, i.e.:
$$\eqalign{ fcinp(t) &= k_1 * (t - t_0) \text{ } (\text{if }t_0 <= t <=t_1) \ &= fcinp(t_1) + k_2 * (t - t_1) \text{ } (\text{if }t_1 < t <= t_2) \ & ... \ &= fcinp(t_{n-1}) + k_n * (t - t_{n-1})\text{ } (\text{if }t_{n-1} < t <= t_n) } Eq. 5$$
where t_i is the time points of time-series X(t) data. In this way, $fcinp(t)$ could be represented by $(n-1)$ parameters ($k_1 - k_{n-1}$). The problem can be rephrased as to find the $\overrightarrow{k})$ to minimize the following function:
$$\eqalign{ \sum_{i=1}^n G(\overrightarrow{k})[t = t_i] - X(t = t_i) } \text{ } Eq.6$$
Since there are k equations for k parameters, the essence of inverse problem belongs to the category of root finder instead of optimization. To find the solution, a sequential iteration algorithm is applied. Concretely, we start from [t0, t1] interval and apply 'toms748' method from Python scipy package to solve the equation $G(k_1)[t=t_1] = X(t=t_1)$. The toms74 method is chosen as the numerical solver mainly due to its fast convergence rate, thus accelerating the model speed. When $k_1$ is solved, the algorithm will run forwardly with the $k_1$-based fcinp(t) at $[t_0, t_1]$ inveterval and save the $\overrightarrow{y}(t=t_1)$, which will serve as the initial y0 for next iteration at $[t1, t2]$ interval. The same process will repeat until $k_n$ is solved.
The modeling d13c results depend on both the isotopic signature and the mass of emitted carbon. When fcinp(t) is solved, the similar procedure will be applied to calculate fd13c(t), except that a constant d13c value in each interval.
Smoothing function
A LOWESS smoothing function is provided. Users are allowed to upload data files and tune the hyperparamter that controls the windown fraction used in LOWESS manually. Note that the default temporal resolution for output data is 0.2 kyr. For a full description of smoothing algorithm, refer to https://www.statsmodels.org/dev/generated/statsmodels.nonparametric.smoothers_lowess.lowess.html.
Output files
| File.csv | Unit | Variable |
|---|---|---|
| tcb | (deg C) | OCN temperature |
| dic | (mmol/kg) | OCN total dissolved inorganic carbon |
| alk | (mmol/kg) | OCN total alkalinity |
| po4 | (umol/kg) | OCN phosphate |
| dox | (mol/m3) | OCN dissolved oxygen |
| dicc | (mmol/kg) | OCN DIC-13 |
| d13c | (per mil) | OCN delta13C(DIC) |
| d13ca | (per mil) | ATM delta13C(atmosphere) |
| pco2a_d13c | (ppmv, per mil) | ATM atmospheric pCO2 and d13c |
| co3 | (umol/kg) | OCN carbonate ion concentration |
| ph | (-) | OCN pH (total scale) |
| pco2ocn | (uatm) | OCN ocean pCO2 |
| omegaclc | (-) | OCN calcite saturation state |
| omegaarg | (-) | OCN aragonite saturation state |
| fca | (-) | SED calcite content Atlantic |
| fci | (-) | SED calcite content Indian |
| fcp | (-) | SED calcite content Pacific |
| fct | (-) | SED calcite content Tethys (PALEO only) |
| ccda | (m) | SED calcite compens. depth Atlantic |
| ccdi | (m) | SED calcite compens. depth Indian |
| ccdp | (m) | SED calcite compens. depth Pacific |
| ccdt | (m) | SED calcite compens. depth Tethys (PALEO only) |
| Surface_dic_alk_d13c_ph | (-) | Mean OCN surface DIC, ALK, d13c, and pH |
| Carbon_inventory | (mol) | Total carbon and alkalinty in the ocean |
External file requirement
| Mode | File usage | Format | Requirement |
|---|---|---|---|
| Forward | Initial y0 | .dat | 1 column, 140 (for modern) or 184 rows; y0 satisfies dy0/dt = F(t=t0, y0) = 0 |
| Emission file | .dat | When LOADFLAG == 2, two columns (age (yr) + emission mass (Gt/yr)). When LOADFLAG == 3, three columns (age (yr) + emission mass (Gt/yr)+d13c of input (per mil)). |
|
| Save yfinal | .dat | When Save ystart == 1, y(t=tfinal) will be saved into the according | |
| Inverse | pCO2 data for inversion | .csv | 2 column with headline, age (yr) + pCO2 (ppmv) |
| mean surface pH data for inversion | .csv | 2 column with headline, age (yr) + pH | |
| mean surface d13c data for inversion | .csv | 2 column with headline, age (yr) + d13c |
| Function | data to be smoothed | .csv | 2 column with headline, age (yr) + data |
Example
(Required dataset could be downloaded here.)
1. Benchmark
1.1 Origninal PETM example from Zeebe et al., 2009.
1. Go to the Forward page
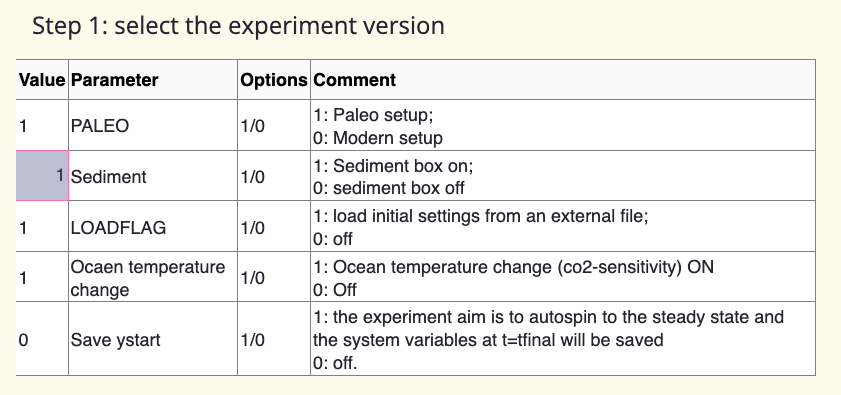
2. Turn the PALEO to '1'. Then the model parameters in Table 2 will adjust automatically to the palaeo settings, so skip the Step 2.
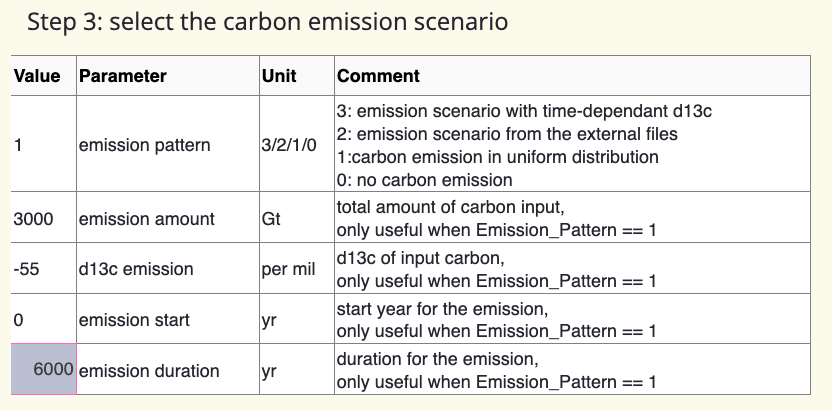
3. Select the carbon emission scenario in Table 3. In this example, set 'emission pattern' == 1, emission amount == 3000, 'd13c emission' == -55, 'emission start' == 0, 'emission duration' == 6000.
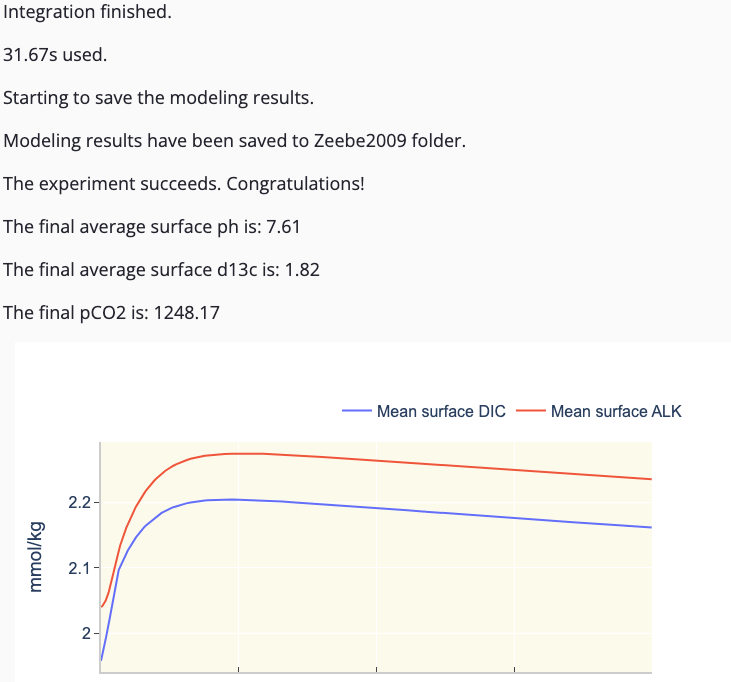
4. Give a name to your experiment and run it. I name it as Zeebe2009 here.
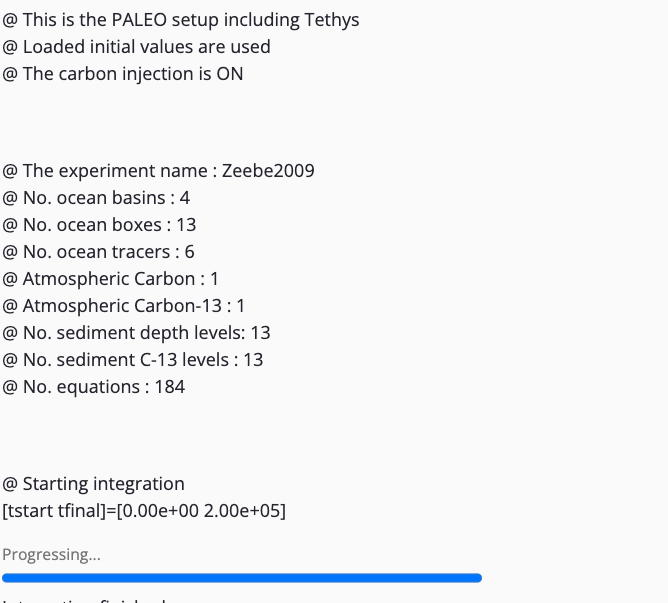
5. The running information will be given in the following chunck. A progress bar is displayed to track the experiment running.
6. When integration finished, modeling results are saved to exp_name folder (Zeebe2009 here). The folder will be in the same dictionary where you run your python code. 44Modeling Mean surface DIC, ALK, pH and d13c, pCO2, and CCD for each ocean basin will be displayed when integration succeeds.
1.2 Inverse twin experiment
To test the performance of inverse algorithm, an identical twin test is performed. In identical twin testing, a preliminary run of the forward model is used to generate a synthetic 'truth' data set which can subsequently be used in inversion experiments. It is straightfoward to check whether the inverse algorithm works correctly.
-
Preliminary run
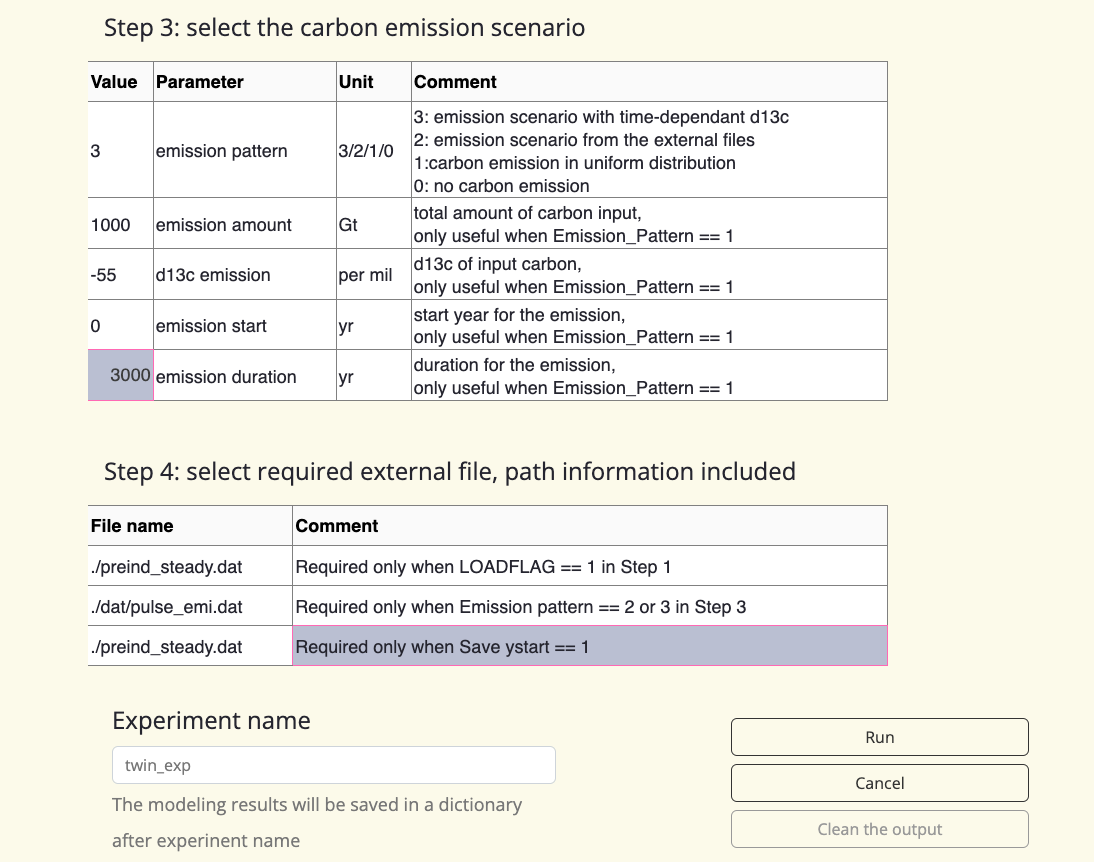
- In Forward page, follow all the default settings in Table 1 and 2, except turn tfinal to 2e4.
- Set 'emission pattern' as 3 in Step 3 and input 'pulse_emi.dat' in second row of Table 4. Note that relative path is required for the file name.
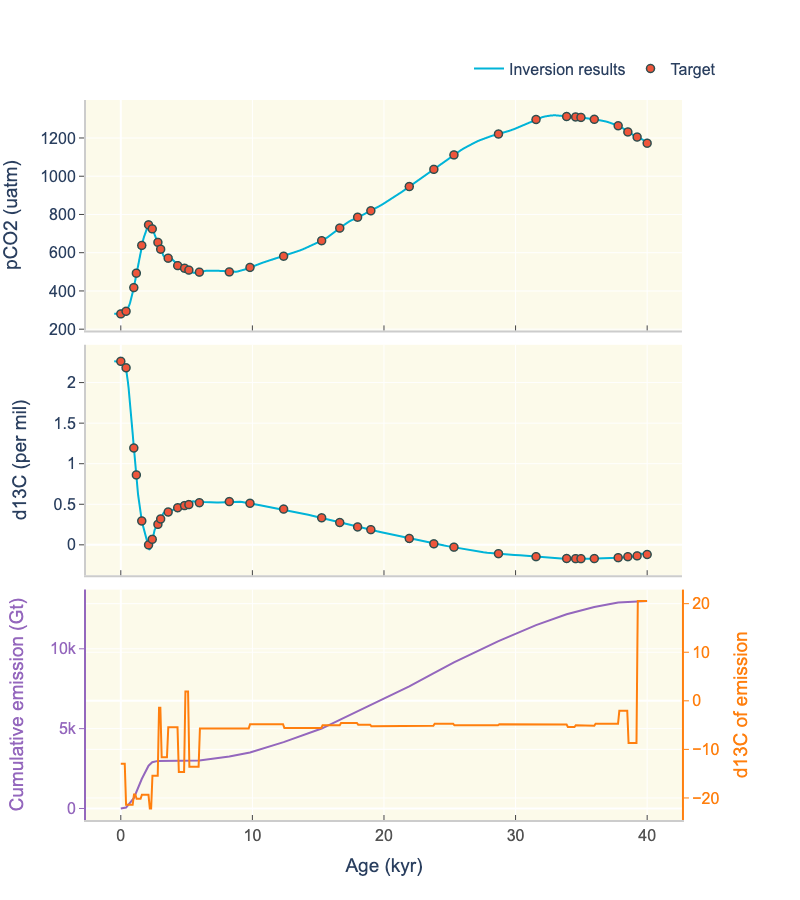
- 'puluse_emi.dat' two emission events: fast and short (3000 Gt in 3 kyr) vs slow and long (10000 Gt in 35 kyr), thus serving an excellent example to check the inversion algorithm.
- Name the model and run the experiment.
-
Prepare data for inversion
- At twin_exp folder, select the pCO2 results from pCO2_d13c.csv file and save as twin_pco2_for_inv.csv. Note that the modeling results are of high temporal resolution and we take a slice to keep the inversion time reasonable.
- Repeat the process for mean surface pH and surface d13C result.
-
Inverse experiment (457.08s used)
- Navigate to the Inverse page. Select 'pCO2 + mean surface d13c' from the dropdown menu and input the target file names manually.
- Name the experiment and run the model.
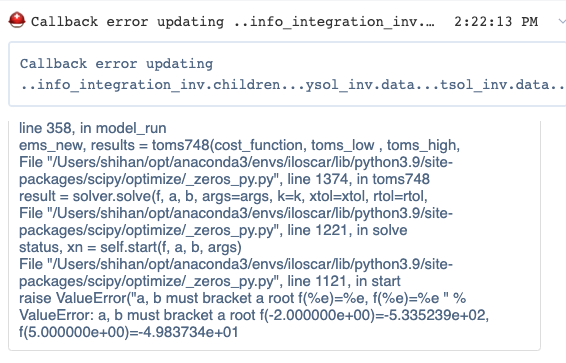
- (If you meet an error similar to the following figure, which means some degassing rate is larger than the default higher boundary in Table 3. Try to adjust the values of second and third row in Table 3.)
- Succeed! Note that when fcinp(t) = 0, inversed d13c may experience some fluctuation.
2. Example
-
Derive the steady state y0
- Navigate to the Forward page.
- In Table 1, set PALEO == 1, LOADFLAG == 0, Save ystart == 1
- In Table 2, set tfinal == 1e7, pCO2_ref == 834, pCO2_initial == 834, silicate weathering0 = 7.5, carbonate weathering0 = 17.5, d13c volcanic == -1.5
- In Table 4, input './gutjahr2017.dat' into the third row.
- Name the experiment and run the model.
-
Inversion experiment (878s)
- Navigate to the Inverse page.
- Download the 'Gutjahr_pH.csv' and 'Gutjahr_d13c.csv' from the link.
- In Table 1, set PALEO == 1, LOADFLAG == 1
- In Table 2, set pCO2_ref == 834, pCO2_initial == 834, silicate weathering0 = 7.5, carbonate weathering0 = 17.5, d13c volcanic == -1.5
- In Table 4, input './gutjahr2017.dat'
- Name the experiment and run the model
- Succeed!
-
Data interpretation
- Refer to [TBD]
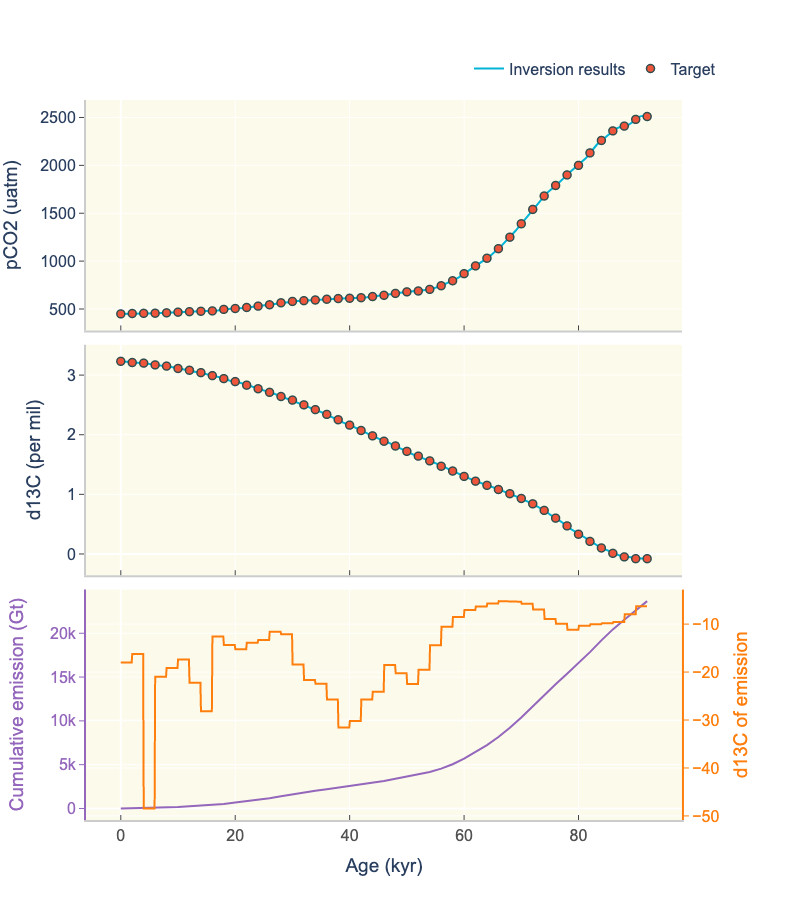
2.2 Wu et al., 2023
-
Derive the steady state y0
- Navigate to the Forward page.
- In Table 1, set PALEO == 0, LOADFLAG == 0, Save ystart == 1
- In Table 2, set tfinal == 1e7, pCO2_ref == 425, pCO2_initial == 449, , fsh == 5, silicate weathering0 = 12, carbonate weathering0 = 17, d13c volcanic == -1.3, ca concentration == 0.013, mg concentration == 0.042
- In Table 4, input './wu2023.dat' into the third row.
- Name the experiment and run the model.
-
Inversion experiment (s)
- Navigate to the Inverse page.
- Download the 'wu_pco2.csv' and 'wu_d13c.csv' from the link.
- In Table 1, set PALEO == 0, LOADFLAG == 1
- In Table 2, set pCO2_ref == 425, pCO2_initial == 449, fsh == 5, silicate weathering0 = 12, carbonate weathering0 = 17, d13c volcanic == -1.3, ca concentration == 0.013, mg concentration == 0.042, nsi == 0.3, ncc == 0.5
- In table 3, set lower and higher boundary as [-0.1, 1], which will accelerate the model
- In Table 4, input './wu2023.dat'
- Name the experiment and run the model
- Succeed!
Common bugs
- The age of target records must be in year unit.
Project details
Download files
Download the file for your platform. If you're not sure which to choose, learn more about installing packages.
Source Distribution
Built Distribution
Hashes for iloscar_win-0.1.7-py3-none-any.whl
| Algorithm | Hash digest | |
|---|---|---|
| SHA256 | ea518fc6c9c4b58bf01aaa517355c9051e57aa381357cab39c43ee2588a47e27 |
|
| MD5 | 448d467e1c7a06ed7c5c24db51a9369b |
|
| BLAKE2b-256 | ac2d56f5d87c18961ea78abfbee4d17d72d6185174d8133d76f9ca018af703f5 |


