





Share:


IPyPlot is a small python package offering fast and efficient plotting of images inside Python Notebooks cells. It's using IPython with HTML for faster, richer and more interactive way of displaying big numbers of images.

Displaying big numbers of images with Python in Notebooks always was a big pain for me as I always used matplotlib for that task and never have I even considered if it can be done faster, easier or more efficiently.
Especially in one of my recent projects I had to work with a vast number of document images in a very interactive way which led me to forever rerunning notebook cells and waiting for countless seconds for matplotlib to do it's thing..
My frustration grew up to the point were I couldn't stand it anymore and started to look for other options..
Best solution I found involved using IPython package in connection with simple HTML. Using that approach I built this simple python package called IPyPlot which finally helped me cure my frustration and saved a lot of my time.
Features:
- Easy, fast and efficient plotting of images in python within notebooks
- Plotting functions (see examples section to learn more):
-
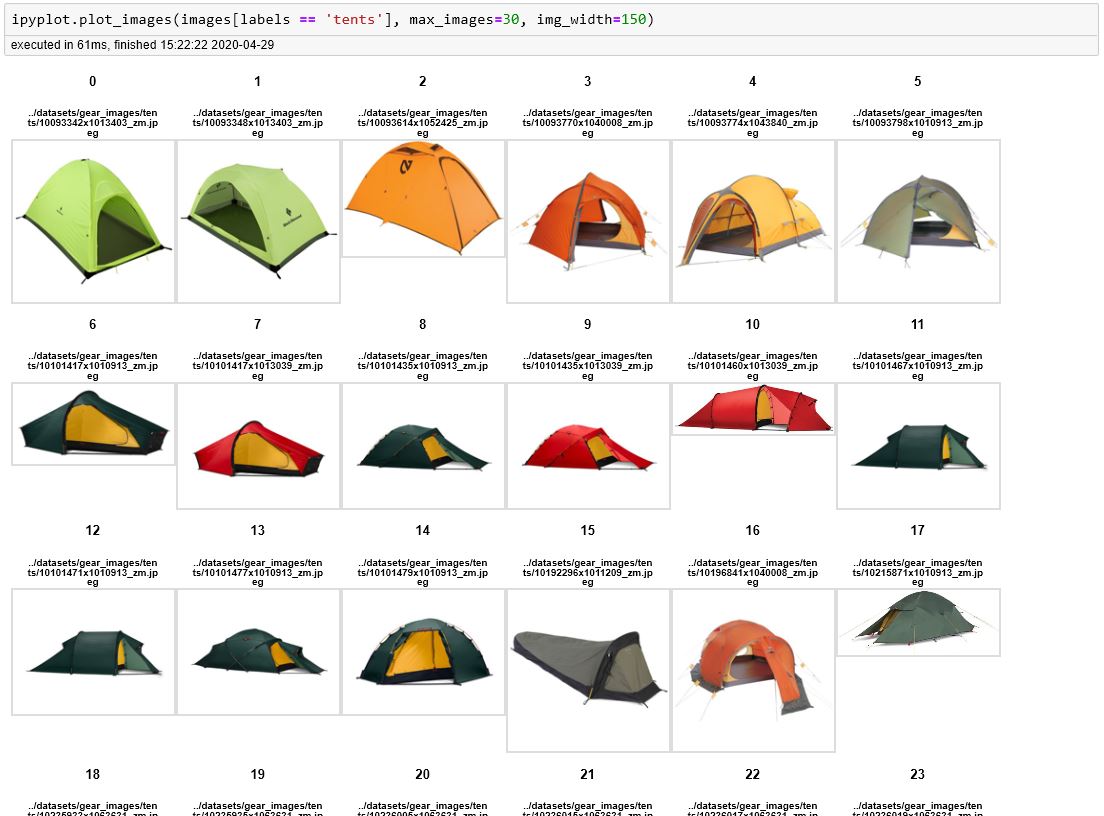
plot_images- simply plots all the images in a grid-like layout -
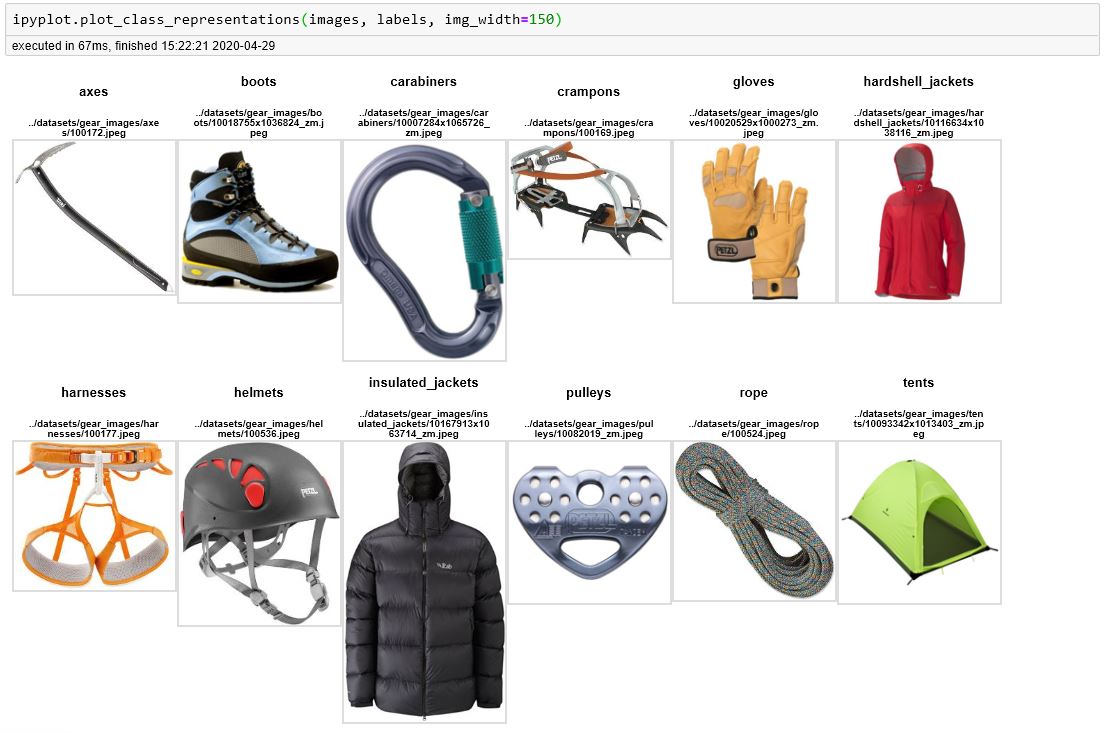
plot_class_representations- similar toplot_imagesbut displays only the first image for each label/class (based on provided labels collection) -
plot_class_tabs- plots images in a grid-like manner in a separate tab for each label/class based on provided labels
-
- Supported image formats:
- Sequence of local storage URLs, e.g.
[your/dir/img1.jpg] - Sequence of remote URLs, e.g.
[http://yourimages.com/img1.jpg] - Sequence of
PIL.Imageobjects - Sequence of images as
numpy.ndarrayobjects - Supported sequence types:
list,numpy.ndarray,pandas.Series
- Sequence of local storage URLs, e.g.
- Misc features:
-
custom_textsparam to display additional texts like confidence score or some other information for each image -
force_b64flag to force conversion of images from URLs to base64 format - click on image to enlarge
- control number of displayed images and their width through
max_imagesandimg_widthparams - "show html" button which reveals the HTML code used to generate plots
- option to set specific order of labels/tabs, filter them or ignore some of the labels
-
- Supported notebook platforms:
- Jupyter
- Google Colab
- Azure Notebooks
- Kaggle Notebooks
Getting Started
To start using IPyPlot, see examples below or go to gear-images-examples.ipynb notebook which takes you through most of the scenarios and options possible with IPyPlot.
Installation
IPyPlot can be installed through PyPI:
pip install ipyplot
or directly from this repo using pip:
pip install git+https://github.com/karolzak/ipyplot
Usage examples
IPyPlot offers 3 main functions which can be used for displaying images in notebooks:
To start working with IPyPlot you need to simply import it like this:
import ipyplot
and use any of the available plotting functions shown below (notice execution times).
- images - should be a sequence of either
string(local or remote image file URLs),PIL.Imageobjects ornumpy.ndarrayobjects representing images - labels - should be a sequence of
stringorint
Display a collection of images
images = [
    "docs/example1-tabs.jpg",
    "docs/example2-images.jpg",
    "docs/example3-classes.jpg",
]
ipyplot.plot_images(images, max_images=30, img_width=150)
Display class representations (first image for each unique label)
images = [
    "docs/example1-tabs.jpg",
    "docs/example2-images.jpg",
    "docs/example3-classes.jpg",
]
labels = ['label1', 'label2', 'label3']
ipyplot.plot_class_representations(images, labels, img_width=150)
Display images in separate, interactive tabs for each unique class
images = [
    "docs/example1-tabs.jpg",
    "docs/example2-images.jpg",
    "docs/example3-classes.jpg",
]
labels = ['class1', 'class2', 'class3']
ipyplot.plot_class_tabs(images, labels, max_imgs_per_tab=10, img_width=150)
To learn more about what you can do with IPyPlot go to gear-images-examples.ipynb notebook for more complex examples.
1 maintainer

Metadata
1 maintainer
Release files for ipyplot 1.1.2
For a detailed explanation of source distributions (sdists) and built distributions (wheels), please see the package formats documentation.
Source distribution (sdist)
| File | Size | Uploaded | |
|---|---|---|---|
| ipyplot-1.1.2.tar.gz | 14.6 kB | Details |
Built distribution (wheel)
| File | Interpreter | ABI | Platform | Reset |
|---|---|---|---|---|
| ipyplot-1.1.2-py3-none-any.whl | Python 3 | none | any | Details |
Total release size: 28.3 kB
Release files / ipyplot-1.1.2.tar.gz
| Download URL | ipyplot-1.1.2.tar.gz |
|---|---|
| Size | 14.6 kB |
| Tags | Source |
|
SHA-256 checksum How to use checksums |
66121c80bb5af645e65a60787a653f16f8badc1b794da03dbe1f135fb9051c6e
|
|
BLAKE2b-256 checksum How to use checksums |
0787edee12b95c93a916e99a48f8ff576e02012d49f3403252281a8d64a50ea6
|
| Upload date | |
|
Uploaded using Trusted Publishing? What is trusted publishing? |
No |
| Uploaded via |
twine/4.0.2 CPython/3.9.18
|
Release files / ipyplot-1.1.2-py3-none-any.whl
| Download URL | ipyplot-1.1.2-py3-none-any.whl |
|---|---|
| Size | 13.7 kB |
| Tags | Python 3 |
|
SHA-256 checksum How to use checksums |
a62417a99994b4c324fbbdd9fd36741372f7908ae17e58f70dbb656139f53c2a
|
|
BLAKE2b-256 checksum How to use checksums |
cb2b7f0c631573360f0946362cdcfd0aa52819f365f11369351e24b1b4269de7
|
| Upload date | |
|
Uploaded using Trusted Publishing? What is trusted publishing? |
No |
| Uploaded via |
twine/4.0.2 CPython/3.9.18
|














