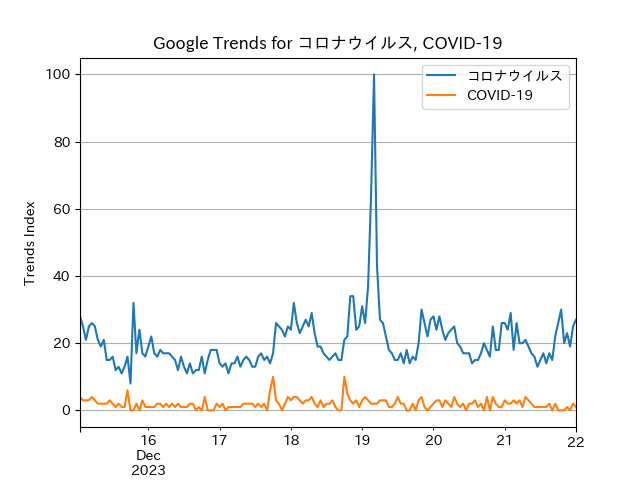
This Python script fetches Google Trends data for specific keywords over the past 7 days in Japan and plots the relative interest over time, handling rate limits by pausing for 60 seconds if necessary.
Project description
Google Trends Plotter
This Python script uses the pytrends library to fetch and plot Google Trends data for given keywords.
Dependencies
systimepytrendsjapanize_matplotlibmatplotlib
How it works
The script takes command line arguments as search queries. It fetches the Google Trends data for these queries over the past 7 days in Japan, and plots the data using matplotlib.
The plot_trends function initializes a TrendReq object with Japanese language and timezone settings. It then builds a payload with the given keywords, category set to 0 (all categories), timeframe set to 'now 7-d' (past 7 days), and geo set to 'JP' (Japan).
The function then fetches the interest over time data for these keywords and plots the data for each keyword. The plot is saved as 'result.png'. Please note that the y-axis of the plot represents relative values (values relative to the maximum value, which is set to 100).
If the number of requests is too high, the script waits for 60 seconds before making the next request.
Usage
Run the script with the search queries as command line arguments. For example:
python jtrends.py コロナウイルス COVID-19
If no command line arguments are provided, the script will prompt you to provide at least one search query.
Note
Please be aware of Google’s rate limits when using this script.
Project details
Release history Release notifications | RSS feed
Download files
Download the file for your platform. If you're not sure which to choose, learn more about installing packages.


