
This release is a pre-release and may not be stable for production use.
justplot
A thin wrapper around matplotlib, which lets you save figure and axes settings for plot reuse.
How to install the module
pip with --pre as option cause this is still an alpha build.
python3.4 -m pip install justplot --pre
– or –
git clone https://github.com/OnionNinja/justplot
cd justplot
python3.4 setup.py install
How to use the module [STRIKEOUT:(as intended)]
TL;DR
from justplot import justplot as jp
import numpy

lat = np.asarray([-90,-60,-30,0,30,60,90])
lon = np.asarray([-180,-150,-120,-90,-60,-30,0,30,60,90,120,150,180])
lat,lon = np.meshgrid(lat, lon)
temp = np.random.randint(10,35,(13,7))
wind = np.random.randint(100,300,(13,7))

awesome = jp.JustPlot(
    title = "Where is it hot?",
    xlabel = "Latitude",
    ylabel = "Longitude",
    # add more options here
)
awesome.add_contourf(lat,lon,temp,ylabel="Temperature (K)", colorbar=True)
awesome.save("Sun.pdf","pdf")

windy = awesome.copy()
windy(title="A little bit windy don't ya think?")
windy.add_contour(lat,lon,wind,ylabel="Wind")
windy.save("Wind.pdf","pdf")
Usage
Let’s say we have some data we want to plot (suprise!). As an example I will use a small data set from ucar.
First off we have to load the data.
import xarray
import numpy as np

data = xarray.open_dataset('sresa1b_ncar_ccsm3-example.nc', decode_times=False) #pretty cryptic, I know
lat = data.lat.data
lon = data.lon.data
temp = data.tas.data[0,:,:]
wind = data.ua.data[0,4,:,:]
xlat,xlon = np.meshgrid(lon,lat)
Let’s build the figure and axes settings first.
from justplot import justplot as jp

blueprint = jp.JustPlot(
    title = "Where is it hot?",
    ylabel = "Latitude",
    xlabel = "Longitude",
    # add more options here
)
Now we can add the actual plot.
blueprint.add_contourf(xlat,xlon,temp,label="Temperature")
blueprint.save('blueprint-1.png','png')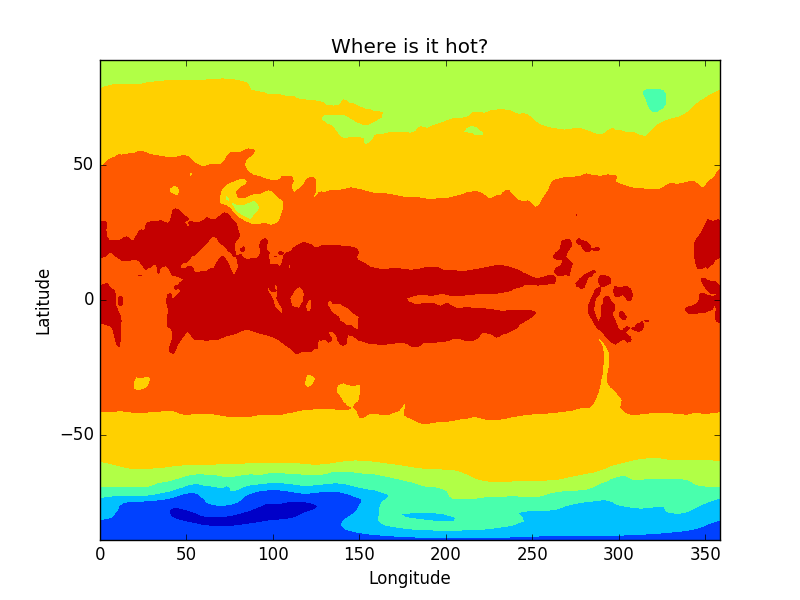
The title is strange and too small. Additionally the both Axes could use some more ticks. So let’s change that.
from matplotlib.ticker import AutoMinorLocator
blueprint(title={"label":"World Temperature","fontsize":19},
          xticks=np.arange(0,361,30),
          yticks=np.arange(-90,91,30),
          xminor=AutoMinorLocator(3),
          yminor=AutoMinorLocator(3),
)
blueprint.save("blueprint-2.png",'png')

Basemap support will be added further down the road. It is on
[STRIKEOUT:my] **our** to do list. You can quote me on that.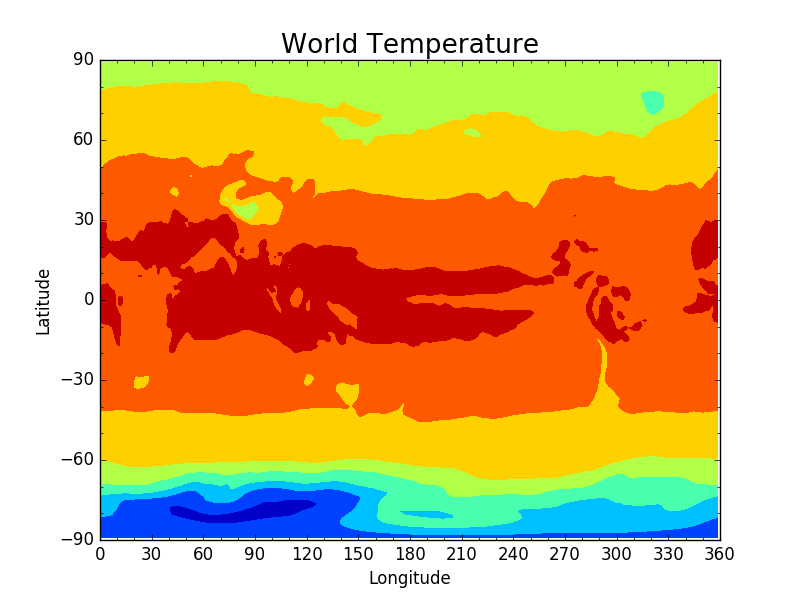
Good enough. Now pretend that you like this plot sooo much that you want all your future plots to look like it. For example the one for Wind. Let’s do that.
windy = blueprint.copy()
windy(title={"label":"Wind","fontsize":19})
windy.add_contour(xlat,xlon,wind,label="Wind")
windy.save("windy.png","png")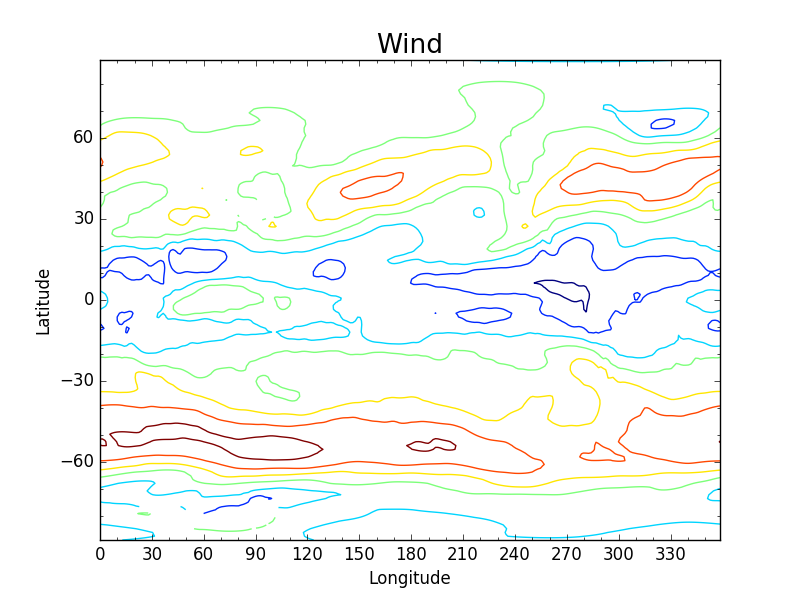
Let’s put all this together.
both = windy.copy()
both(title={"label":"World Temperature + Wind","fontsize":19})
both.add_contourf(xlat,xlon,temp,label="Temperature")
both.add_contour(xlat,xlon,wind,label="Wind",colors=('k'))
blueprint.save("both.png","png")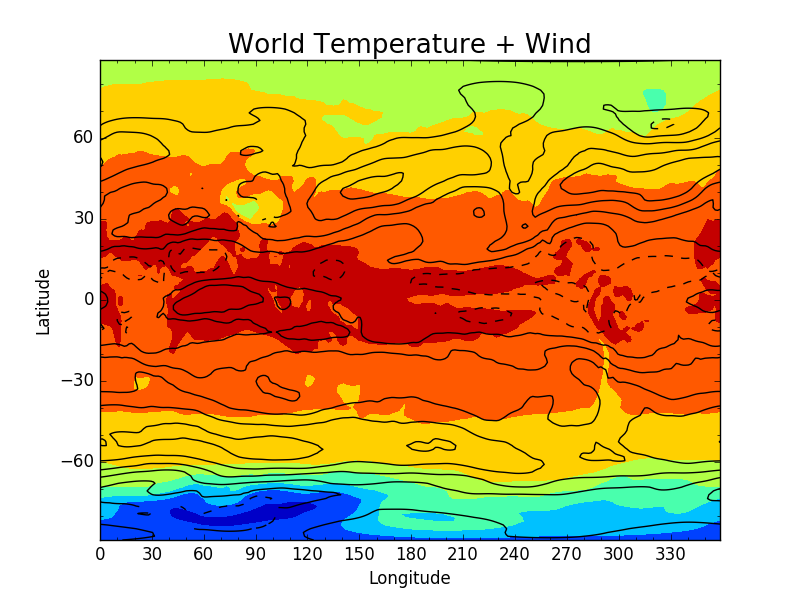
You can find the example code and data in the example folder.
How to improve the module (aka our todo list)
[ ] Save settings from y axes
[ ] Add Basemap support
[ ] Restructure
[ ] Write import function from preconfigured or used figures/axes
[x] Write README.md
1 maintainer

Metadata
1 maintainer
Release files for justplot 0.1.3a3
For a detailed explanation of source distributions (sdists) and built distributions (wheels), please see the package formats documentation.
Source distribution (sdist)
| File | Size | Uploaded | |
|---|---|---|---|
| justplot-0.1.3a3.tar.gz | 5.6 kB | Details |
Release files / justplot-0.1.3a3.tar.gz
| Download URL | justplot-0.1.3a3.tar.gz |
|---|---|
| Size | 5.6 kB |
| Tags | Source |
|
SHA-256 checksum How to use checksums |
edb527d7fa65882faf85373e2bacf6f897a6c074e306a65e967fe218b5acd1dc
|
|
BLAKE2b-256 checksum How to use checksums |
2ae1edbe13563e6b005c2d7967ebabbebb389274ec467b4c58cdb79e7318ea35
|
| Upload date | |
|
Uploaded using Trusted Publishing? What is trusted publishing? |
No |














