A CLI utility for charting data on the fly.

Project description
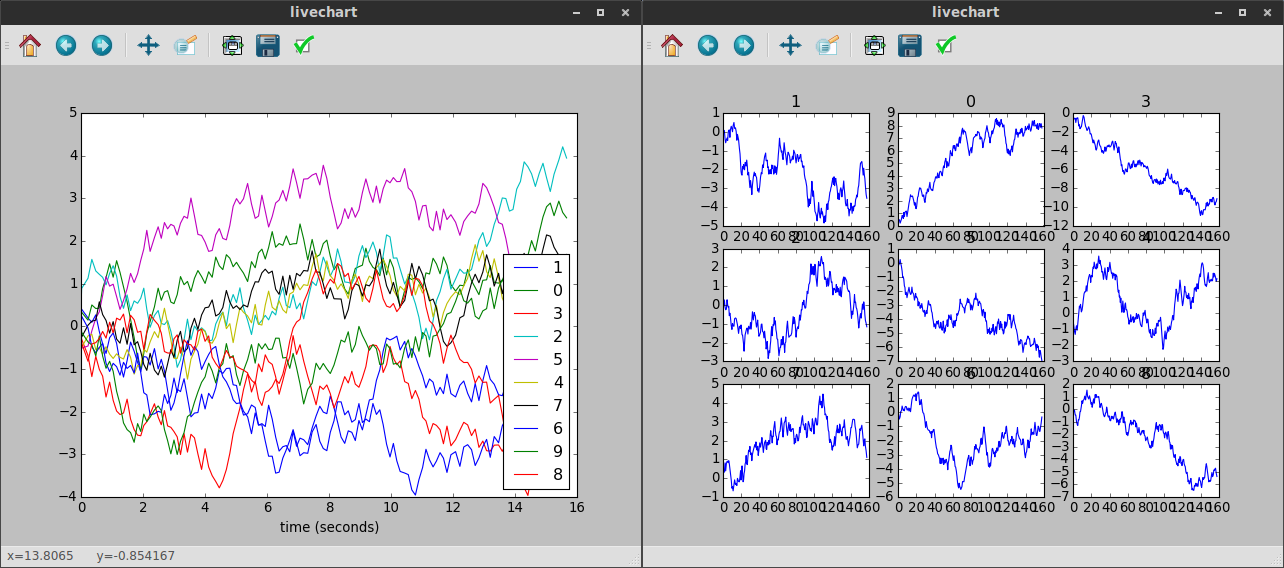
A command-line utility for rendering quick-and-dirty graphs of STDIN input.
installation
Tested against Python 2.7.
sudo pip install livechart
usage
Pipe lines containing either JSON-serialized objects or numbers into livechart; the data must be consistent for the duration of usage. Input like {"a": 1, "b": 3, "c": 5} will result in three graphs, while 1.00 will plot just one.
some_script | livechart
Run livechart --help for all configuration options.


