Visualize LookML relationships network as an interactive figure

Project description
LookML Network Visualizer

TL;DR Visualize LookML contents as an interactive Plotly figure.
Built on top of lookml-tools's grapher. Requires NetworkX and Plotly.
Getting Started
from lookml_visualizer import PlotNetwork

network = PlotNetwork(lkml_paths=['./my_lookml_project/*.lkml'])
To save the interactive plot as an HTML file:
network.fig.save_to_html(output_name='my_lookml_network.html')
Examples
Example1: A tiny project

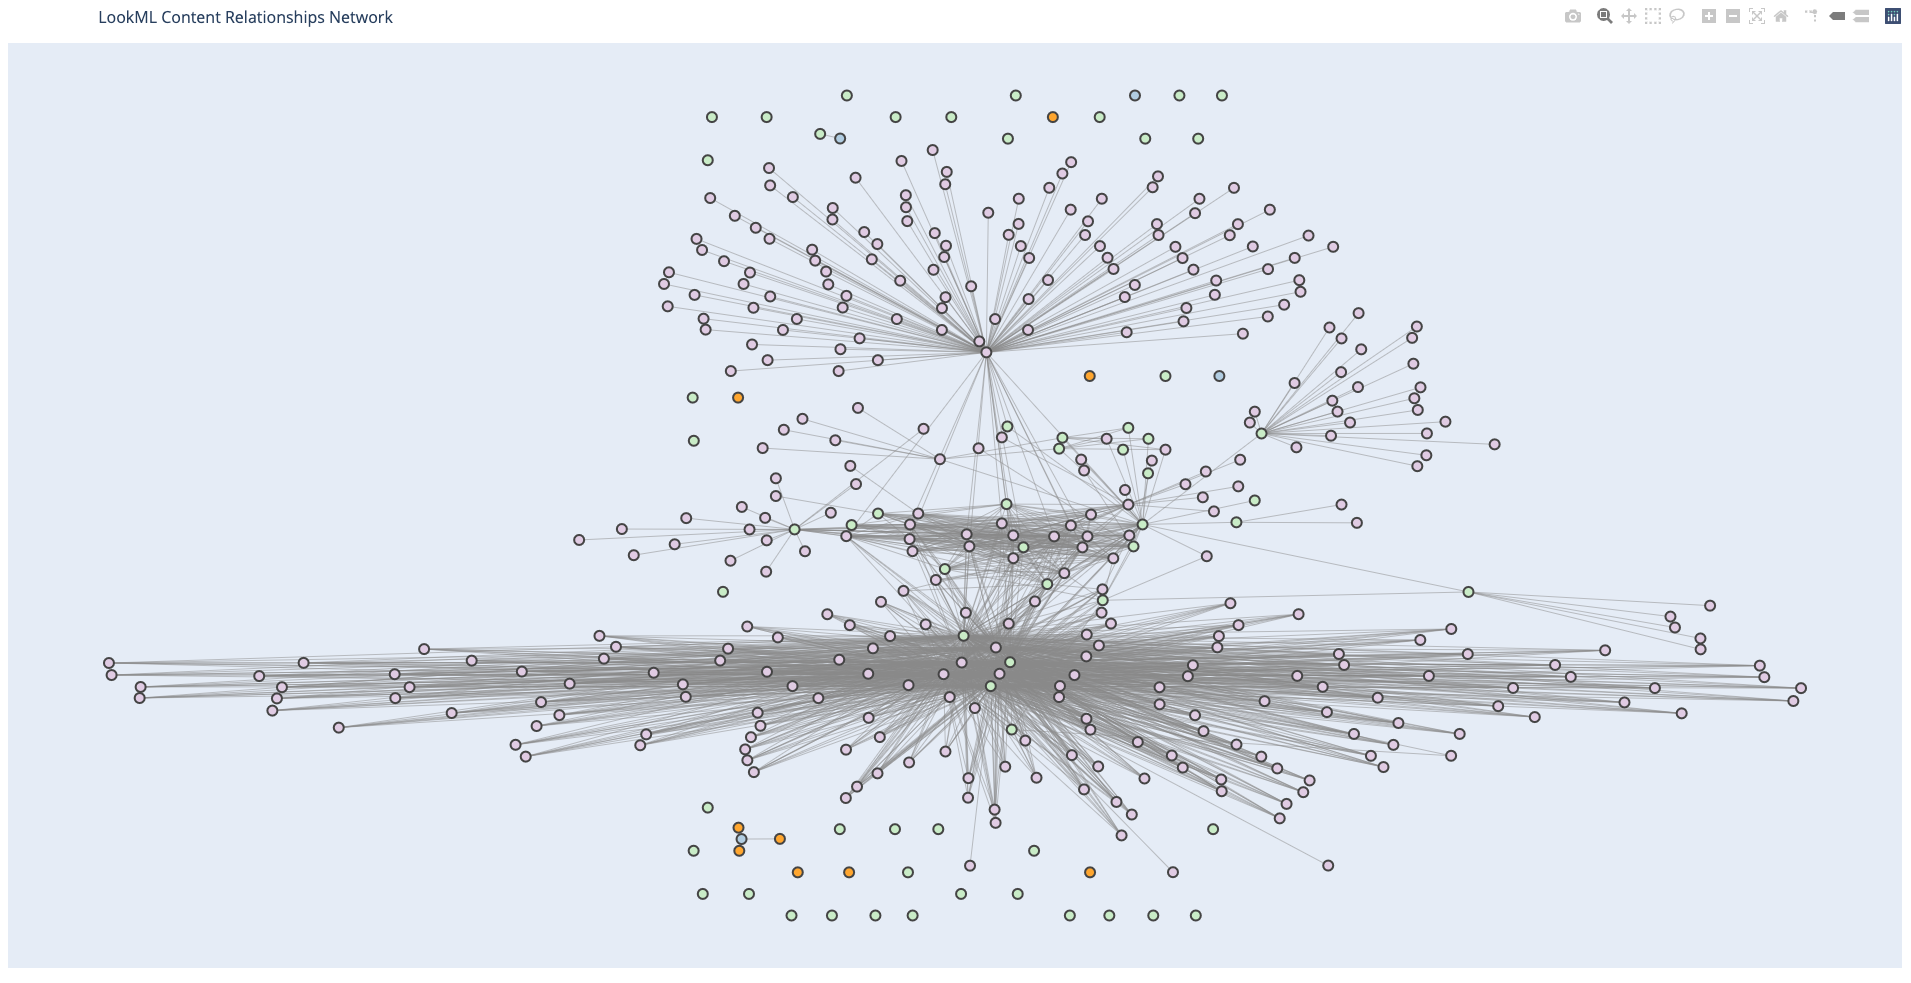
Example2: A large project

Plot layouts
The network plot can have different layouts. The following example shows how to pass a different plot layout:
network = PlotNetwork(paths, plot_layout='dfp')
which will display the same network in example 2 (above) in this layout:
plot_layoutoptions: 'dot', 'twopi', 'fdp', 'sfdp', 'circo'
Install
$ pip install lookml_visualizer
Also, if not installed, need to install PyGraphviz
$ brew install graphviz
Release history Release notifications | RSS feed


Download files
Download the file for your platform. If you're not sure which to choose, learn more about installing packages.
Source Distribution
Built Distribution
Filter files by name, interpreter, ABI, and platform.
If you're not sure about the file name format, learn more about wheel file names.
Copy a direct link to the current filters
File details
Details for the file lookml_visualizer-0.3.tar.gz.
File metadata
- Download URL: lookml_visualizer-0.3.tar.gz
- Upload date:
- Size: 24.0 MB
- Tags: Source
- Uploaded using Trusted Publishing? No
- Uploaded via: python-requests/2.24.0
File hashes
| Algorithm | Hash digest | |
|---|---|---|
| SHA256 |
b5d132e0a0606589e1b782675cfdfd59b1668e7f93f729434332658782cf0be7
|
|
| MD5 |
4715894ec5ab3dd2671c3b346ffcb3f4
|
|
| BLAKE2b-256 |
4cd0aeb27bdddd7981102189216412fff77ed29021451a32b783851bb45721db
|
File details
Details for the file lookml_visualizer-0.3-py2.py3-none-any.whl.
File metadata
- Download URL: lookml_visualizer-0.3-py2.py3-none-any.whl
- Upload date:
- Size: 4.7 kB
- Tags: Python 2, Python 3
- Uploaded using Trusted Publishing? No
- Uploaded via: python-requests/2.24.0
File hashes
| Algorithm | Hash digest | |
|---|---|---|
| SHA256 |
dab567dbc01c31e60d0a356b2aeafd04689db2de3d55fa44c07babd24ebc0bb5
|
|
| MD5 |
1222ff281e096e829e7b27525f584304
|
|
| BLAKE2b-256 |
f8d112395779cdaa3e0dcecd7fab528a42092774b5566d7de133cabff91f1221
|


