MethAmplicons: A tool for plotting targeted bisulfite sequencing.
Project description
MethAmplicons2
Command line tool written in Python for generation of lollipop and ridgleline plots from targeted bisulfite sequencing.
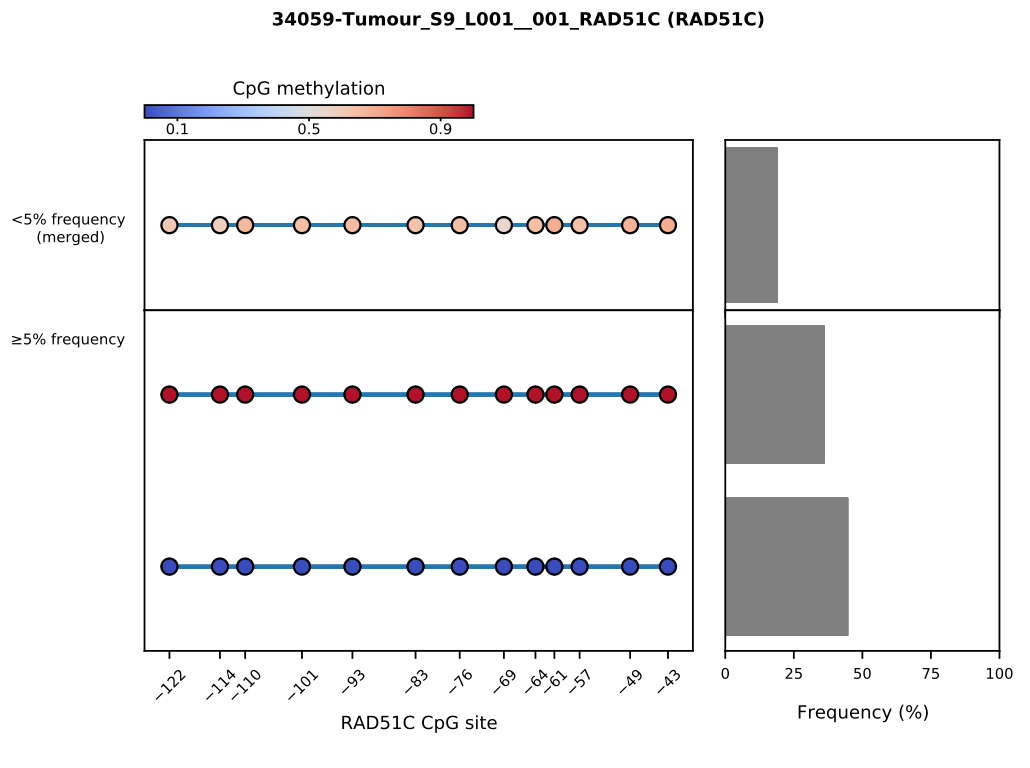
Generate lollipop plots that show the most frequent epialleles for a region of interest as well as a "combined" epiallele that is an average of less frequent (<5%) epialleles e.g. the RAD51C promoter region:

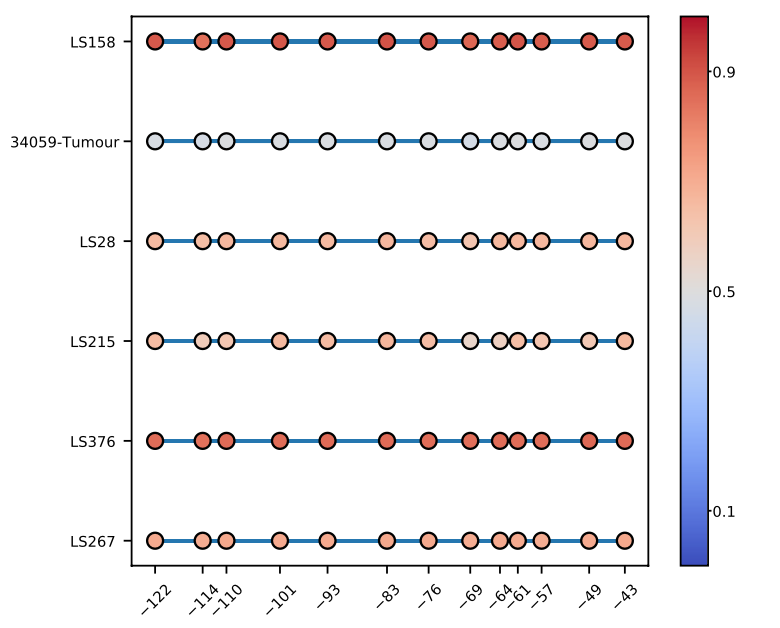
Can also plot the combined/average epialleles for multiple samples of interest together:
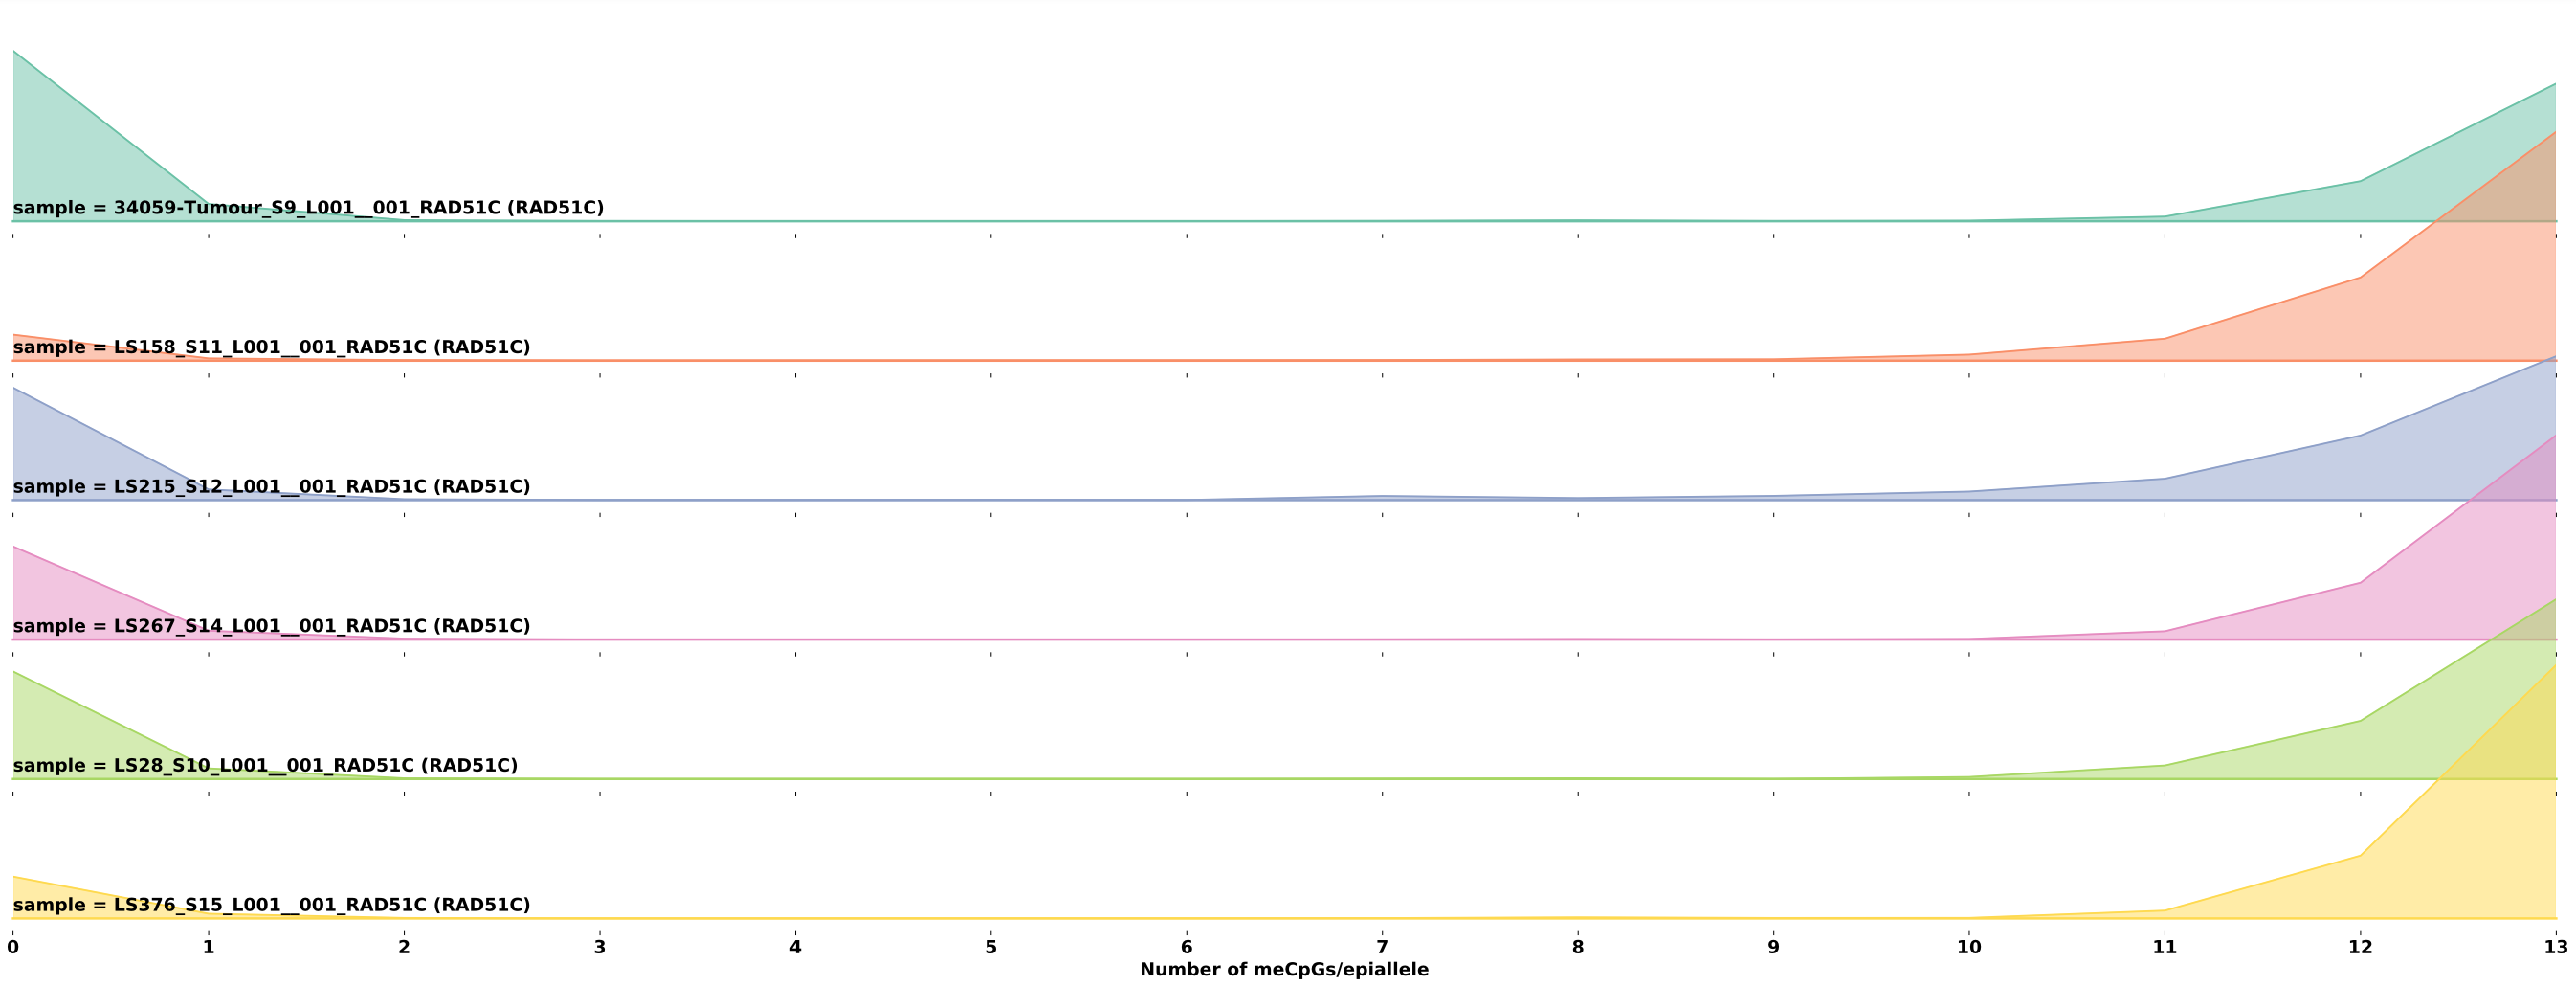
Lastly, you can plot ridgeline plots that allow one to view the distribution of the number of methylated CpGs per epiallele by sample. This provides another visual tool to assess the proportion of non-methylated, partially methylated, and fully methylated epialleles in a sample:
This repo provides a generalised "CLI tool" version of the code from MethAmplicons which is a collection of scripts used for the analysis of RAD51C methylation data in: Nesic, K, Kondrashova, O et al. "Acquired RAD51C promoter methylation loss causes PARP inhibitor resistance in high grade serous ovarian carcinoma." Cancer Research (2021)
This tool uses FLASH paired-end read merging software for merging reads: FLASH: Fast length adjustment of short reads to improve genome assemblies. T. Magoc and S. Salzberg. Bioinformatics 27:21 (2011), 2957-63
Getting Started
- To get started with the tool, follow the steps INSTALLATION and USE below.
INSTALLATION:
pip install methamplicons
USE:
#simple case
methamplicons --PE_read_dir test4 --amplicon_info test4/BS_primers_amplicons_CDS_RC.tsv --sample_labels test4/SampleID_labels_amplicon_meth.csv --output_dir AOCS34059

# specifying optional parameters
methamplicons --PE_read_dir final_test_260221 --amplicon_info final_test_260221/BS_primers_amplicons_CDS_RC.tsv --sample_labels final_test_260221/SampleID_labels_amplicon_meth.csv --output_dir 260221_output --min_seq_freq 0.01 --verbose false --save_intermediates false
- Note: the flash binary used to merge reads is only compiled for Macs (arm64 and intel). See Alternative OS Support for where to find binaries for other systems.
Requirements for directories and files provided as arguments:
- Example tsv and csv files are provided under tests
--PE_read_dir - directory containing paired end read files:
- An assumption of the program is that the last instance of R1 or R2 before the file extension (.fastq, .fastq.gz) indicates that a file contains read 1s of a pair or read 2s of a pair.
- The tested files had read 1s at the same line (position) as the read 2s in the other file, however order shouldn't be important as each fastq files reads are placed in dictionaries and so a read's counterpart can be searched.
--amplicon_info - tsv file containing the information about the amplified regions:
-
The tab-delimited (tsv) file should have data organised into 'columns':
- AmpliconName, Primer1, Primer2, Sequence, and CDS
-
Columns should contain:
- AmpliconName is the name given to the amplicon.
- Primer1 and Primer2 are the primers that will match the reads (they ARE bisulfite converted). Primer2 is assumed to be the reverse primer and therefore its reverse complement is used by the program (the user can provide the reverse primer sequence as is).
- Sequence - reference sequence for the amplified region that is NOT bisulfite converted. The reference sequence should start with primer 1's sequence and ends with primer 2's (reverse complement) sequence.
- CDS is the distance of the first base in the reference sequence relative to the first base in the CDS. For genes on the reverse strand the direction of the amplicon and primer 1 and 2 need to be considered. 0 may be put as a stand in value.
-
If multiple regions are targeted in a single analysis, multiple amplicon entries can be provided (including overlapping regions/amplicons). These will be extracted from the reads and analysed separately.
Example tsv file:
| Amplicon_Name | Primer1 | Primer2 | Sequence | CDS |
|---|---|---|---|---|
| RAD51C | GAAAATTTATAAGATTGCGTAAAGTTGTAAGG | CTAACCCCGAAACAACCAAACTCC | GAAAATTTACAAGACTGCGCAAAGCTGCAAGGCCCGGAGCCCCGTGCGGCCAGGCCGCAGAGCCGGCCCCTTCCGCTTTACGTCTGACGTCACGCCGCACGCCCCAGCGAGGGCGTGCGGAGTTTGGCTGCTCCGGGGTTAG | -156 |
| BRCA1_l | TTGTTGTTTAGCGGTAGTTTTTTGGTT | AACCTATCCCCCGTCCAAAAA | CTGCTGCTTAGCGGTAGCCCCTTGGTTTCCGTGGCAACGGAAAAGCGCGGGAATTACAGATAAATTAAAACTGCGACTGCGCGGCGTGAGCTCGCTGAGACTTCCTGGACGGGGGACAGGCT | -1361 |
| BRCA1_s | TTGTTGTTTAGCGGTAGTTTTTTGGTT | CAATCGCAATTTTAATTTATCTATAATTCCC | CTGCTGCTTAGCGGTAGCCCCTTGGTTTCCGTGGCAACGGAAAAGCGCGGGAATTACAGATAAATTAAAACTGCGACTG | -1361 |
--sample_labels - csv file containing sample label information (optional):
- This file is not required, however it can be used to map the Sample Id (name used in the fastq files) to the SampleLabel or ShortLabel if the CSV includes the following columns:
- SampleID, SampleLabel, ShortLabel
Example output files and directories:
.
├── BRCA1_l
│   ├── BRCA_sample1_BRCA1_l_alleles_above_5_perc_freq_barplot.pdf
│   ├── All_samples_combined_avgd_meth_BRCA1_l.pdf
│   ├── All_samples_combined_avgd_meth_BRCA1_l_w_unmeth.pdf
│   ├── average_BRCA1_l_meth_by_sample.csv
│   ├── average_BRCA1_l_meth_by_sample_w_unmeth.csv
│   ├── multiplexed_BRCA1_l_alleles_above_5_perc_freq_barplot.pdf
│   ├── Ridgeline_data_BRCA1_l.csv
│   ├── ridgeline_plot_BRCA1_l.pdf
│   └── Specific_allele_data_BRCA1_l.csv
├── BRCA1_s
│   ├── BRCA_sample2_BRCA1_s_alleles_above_5_perc_freq_barplot.pdf
│   ├── BRCA_sample1_BRCA1_s_alleles_above_5_perc_freq_barplot.pdf
│   ├── All_samples_combined_avgd_meth_BRCA1_s.pdf
│   ├── All_samples_combined_avgd_meth_BRCA1_s_w_unmeth.pdf
│   ├── average_BRCA1_s_meth_by_sample.csv
│   ├── average_BRCA1_s_meth_by_sample_w_unmeth.csv
│   ├── multiplexed_BRCA1_s_allele_freq_w_below_5_perc_avgd_barplot.pdf
│   ├── Ridgeline_data_BRCA1_s.csv
│   ├── ridgeline_plot_BRCA1_s.pdf
│   └── Specific_allele_data_BRCA1_s.csv
├── flash_stdout.txt
└── RAD51C
    ├── RAD51C_sample1_RAD51C_allele_freq_w_below_5_perc_avgd_barplot.pdf
    ├── RAD51C_sample2_RAD51C_alleles_above_5_perc_freq_barplot.pdf
    ├── multiplexed_RAD51C_alleles_above_5_perc_freq_barplot.pdf
    ├── All_samples_combined_avgd_meth_RAD51C.pdf
    ├── All_samples_combined_avgd_meth_RAD51C_w_unmeth.pdf
    ├── average_RAD51C_meth_by_sample.csv
    ├── average_RAD51C_meth_by_sample_w_unmeth.csv
    ├── RAD51C_sample3_001_RAD51C_allele_freq_w_below_5_perc_avgd_barplot.pdf
    ├── multiplexed_RAD51C_allele_freq_w_below_5_perc_avgd_barplot.pdf
    ├── Ridgeline_data_RAD51C.csv
    ├── ridgeline_plot_RAD51C.pdf
    └── Specific_allele_data_RAD51C.csv
- Note: samples either print out a allele_freq_w_below_5_perc_avgd_barplot or alleles_above_5_perc_freq_barplot depending on if, after filtering the reads by threshold, there are epialleles that represent <5% of the total reads. If there are epialleles with a frequency <5%, they will be shown in allele_freq_w_below_5_perc_avgd_barplot. Otherwise, the latter plot will print.
Argument info
usage: methamplicons [-h] [--PE_read_dir PE_READ_DIR]
                     [--amplicon_info AMPLICON_INFO]
                     [--sample_labels SAMPLE_LABELS] [--output_dir OUTPUT_DIR]
                     [--min_seq_freq MIN_SEQ_FREQ] [--verbose {true,false}]
                     [--save_data {true,false}] [--save_intermediates {true,false}]

CLI tool for plotting targeted bisulfite sequencing

optional arguments:
  -h, --help            show this help message and exit
  --PE_read_dir PE_READ_DIR
                        Desired input directory with fastq files, gzipped or not
  --amplicon_info AMPLICON_INFO
                        Path to the amplicon info file in tsv format, e.g.:
                        AmpliconName Primer1 Primer2 ReferenceSequence
  --sample_labels SAMPLE_LABELS
                        Path to sample labels file in csv format
  --output_dir OUTPUT_DIR
                        Desired output directory
  --min_seq_freq MIN_SEQ_FREQ
                        Threshold frequency an extracted epiallele sequence must
                        have to be included in analysis (default:0.01)
  --verbose {true,false}
                        Print all output after file parsing (default: true).
  --save_data {true,false}
                        Save processed data in csv format (default: true).
  --save_intermediates {true,false}
                        Save 'demultiplexed' and merged read files for all
                        combinations of samples and amplicons (default: true).
Alternative OS support:
- After running "pip install methamplicons", navigate to the folder where it was installed - which is the bin folder of the version of Python being used. On Linux you can run "which methamplicons" to find the location. The location should look like /Python/3.9/bin/methamplicons
- In the methamplicons folder are 4 python files and unix executable/binary for flash on mac. Delete the flash binary and replace it with the one for your system, which can be obtained from: https://ccb.jhu.edu/software/FLASH/
- E.g. for a Linux system, extract the binary from the FLASH-1.2.11-Linux-x86_64.tar.gz
- The tool should now run.
Credit to the creators of FLASH: FLASH: Fast length adjustment of short reads to improve genome assemblies. T. Magoc and S. Salzberg. Bioinformatics 27:21 (2011), 2957-63.
Project details
Release history Release notifications | RSS feed
Download files
Download the file for your platform. If you're not sure which to choose, learn more about installing packages.
Source Distribution
Built Distribution
Hashes for methamplicons-0.3.0-py3-none-any.whl
| Algorithm | Hash digest | |
|---|---|---|
| SHA256 | 6148b7b5b3877c4dcac7e9831ae6e5092391ae1310ef4a1a387b61349e88afd7 |
|
| MD5 | 5f2da05276a007b037db51c66a5dd90f |
|
| BLAKE2b-256 | de9046d8bec5f64bd8975ff7222d8c806823df5bee67f15cfc07326c142190a2 |


