plot geologic stratigraphic columns with python

Project description
mplStrater


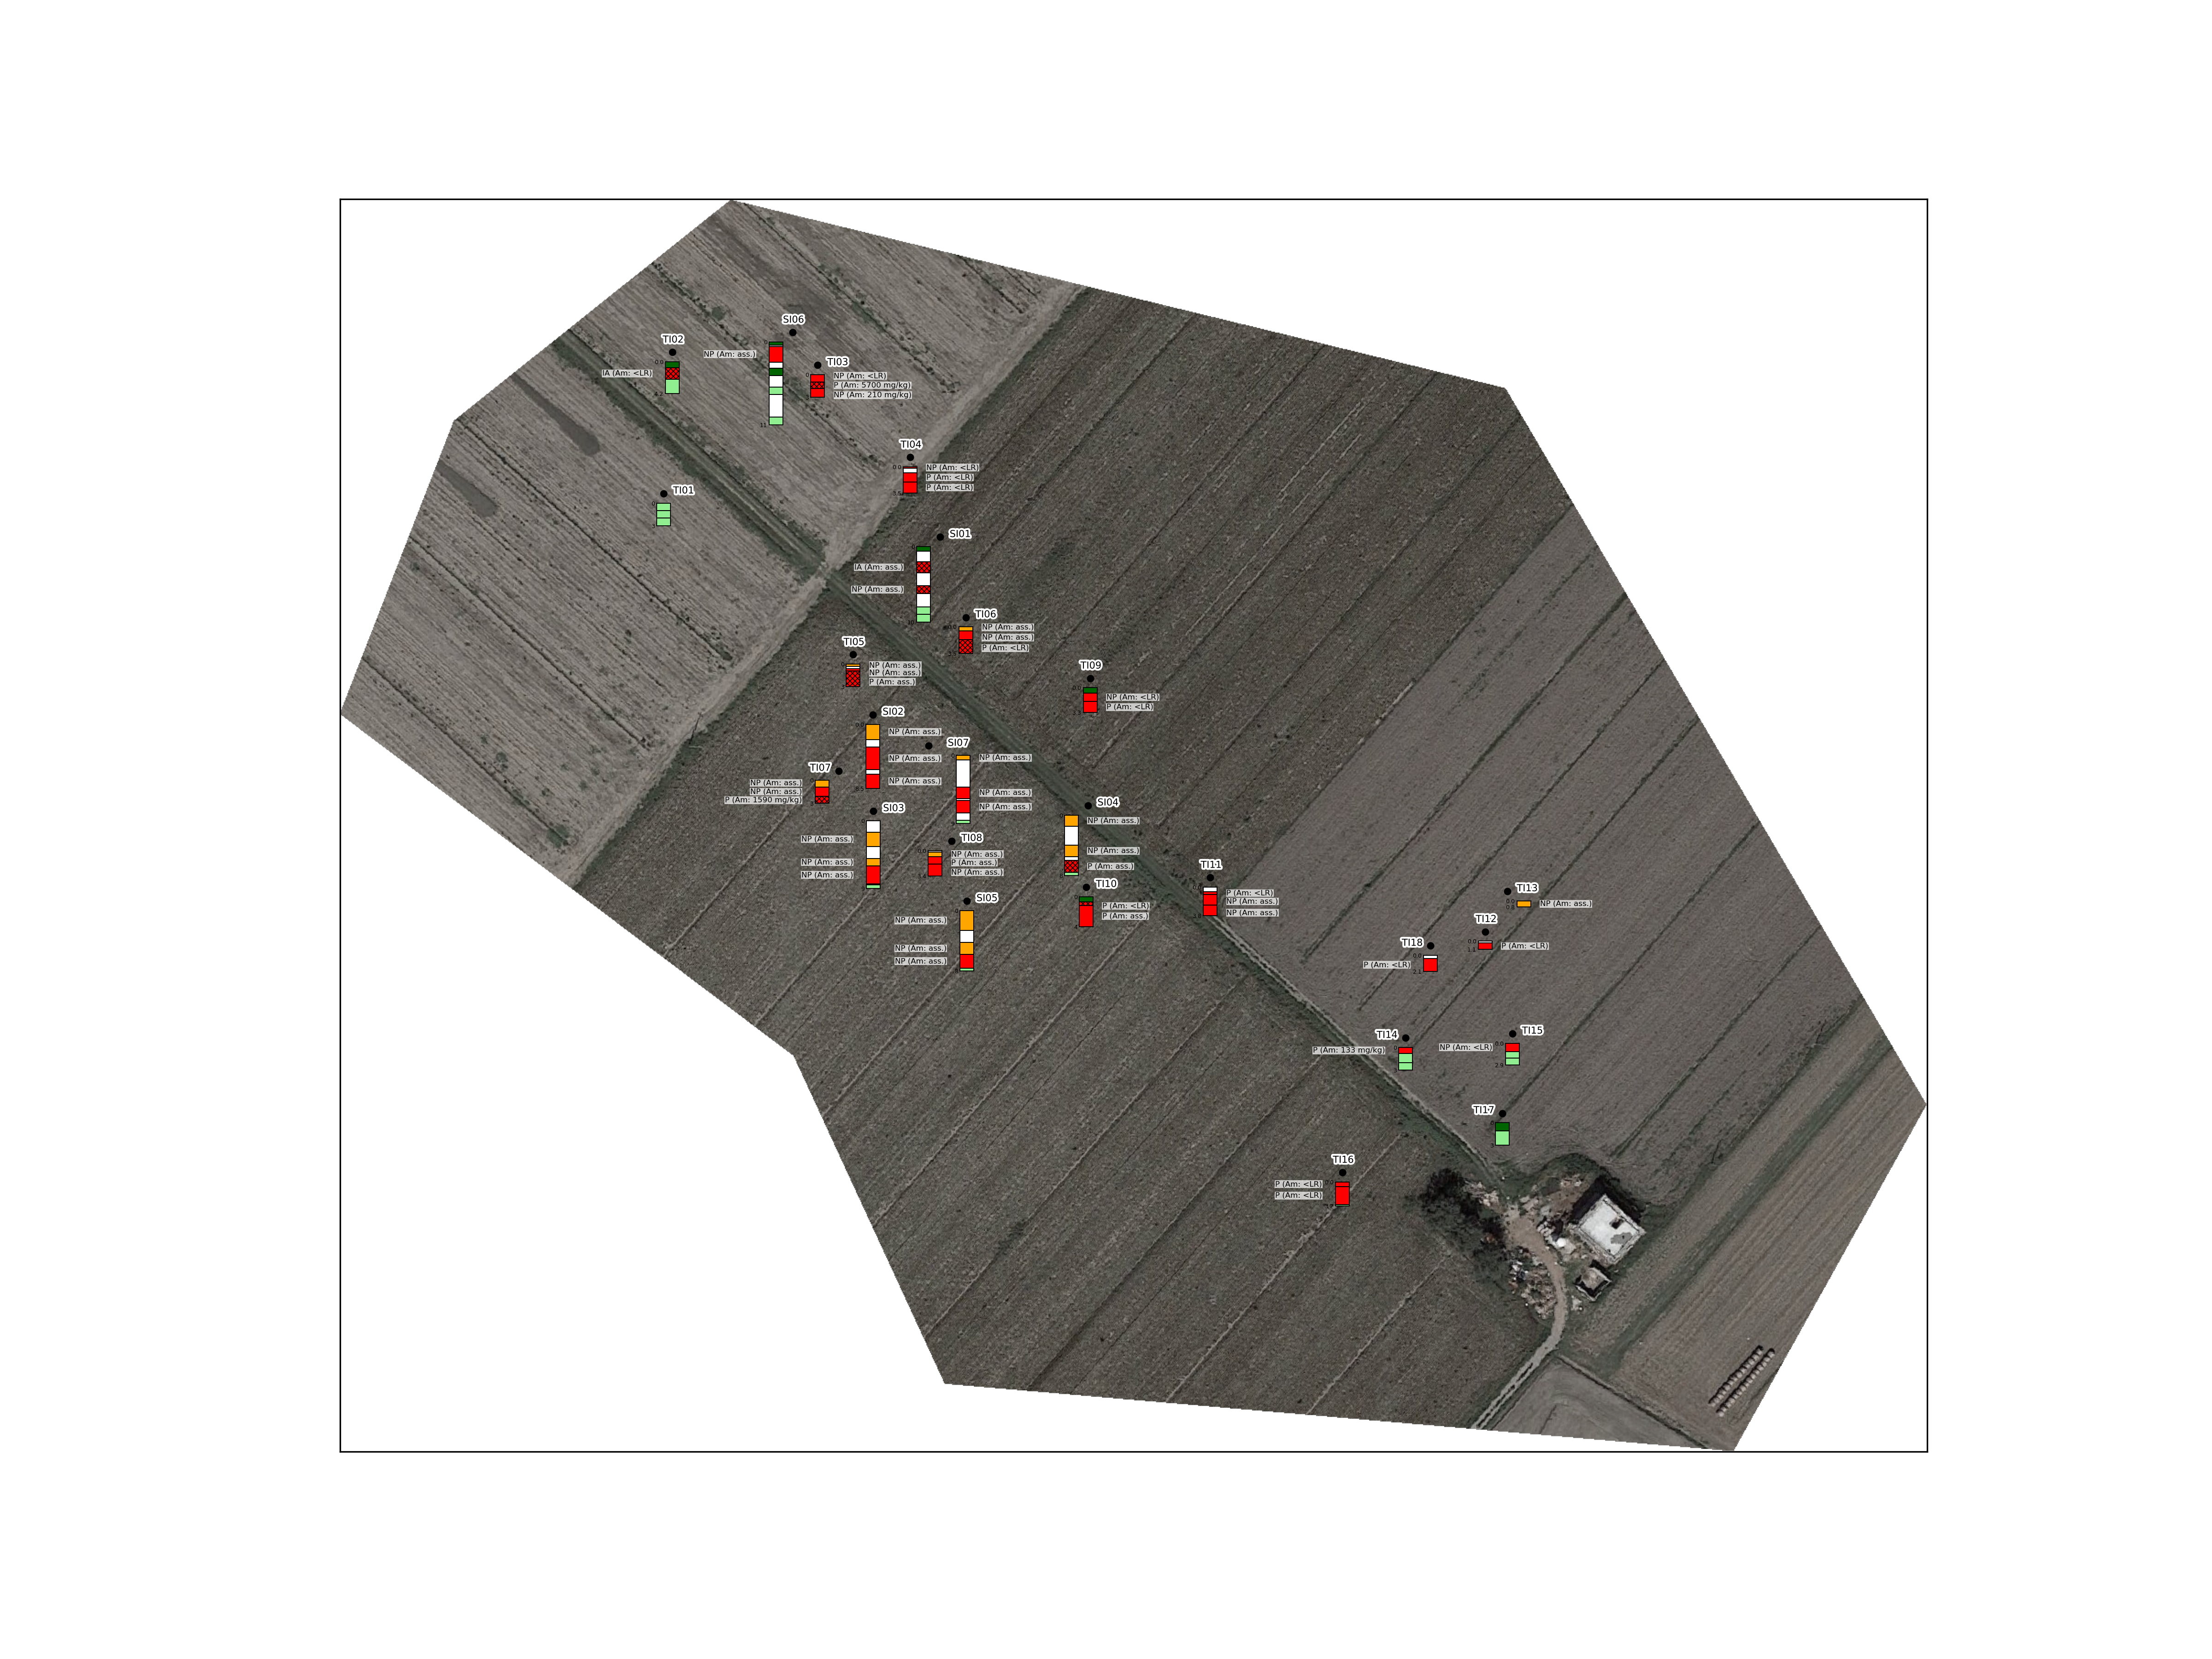
This package provides the possibility to plot geologic stratigraphic columns with a structured symbology and labelling system on matplotlib figures.
The package allows to use georeferenced rasters as basemap.
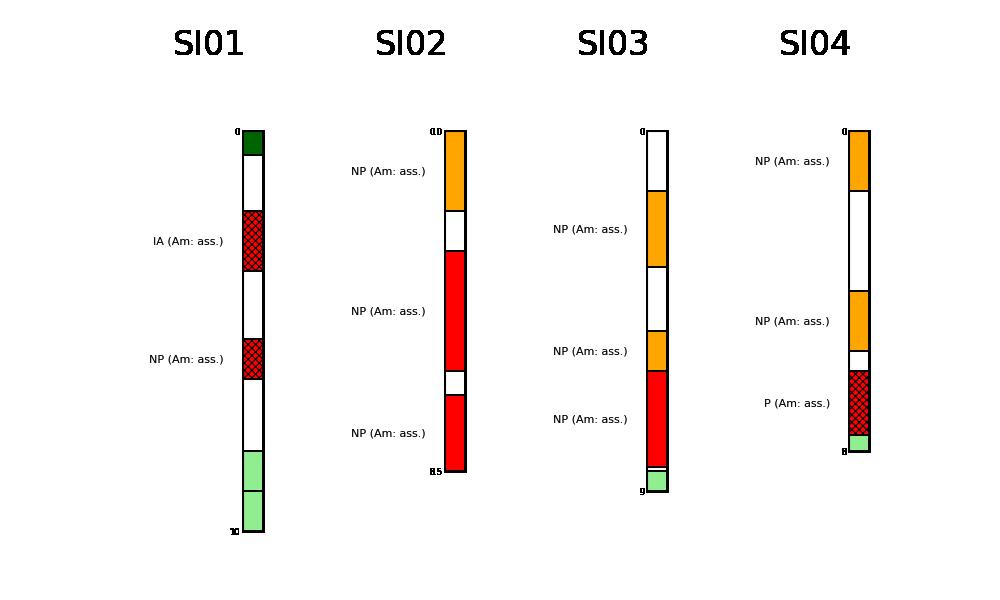
Additionally, the package has the capability to just plot the single stratigraphic columns.
Documentation
The documentation with examples can be found here.
Installation with pip
pip install
Installation (from source)
Clone code from github and install with pip.
git clone https://github.com/giocaizzi/mplStrater.git
cd mplStrater
pip install .
Release history Release notifications | RSS feed


Download files
Download the file for your platform. If you're not sure which to choose, learn more about installing packages.
Source Distribution
Built Distribution
Filter files by name, interpreter, ABI, and platform.
If you're not sure about the file name format, learn more about wheel file names.
Copy a direct link to the current filters
File details
Details for the file mplStrater-0.0.5.tar.gz.
File metadata
- Download URL: mplStrater-0.0.5.tar.gz
- Upload date:
- Size: 8.2 kB
- Tags: Source
- Uploaded using Trusted Publishing? No
- Uploaded via: twine/3.4.1 importlib_metadata/4.8.2 pkginfo/1.7.1 requests/2.26.0 requests-toolbelt/0.9.1 tqdm/4.62.3 CPython/3.7.11
File hashes
| Algorithm | Hash digest | |
|---|---|---|
| SHA256 |
a88767c77fd7b05e887b4848220353f1fc8744cf4f4546e20aabf6d76e7d3031
|
|
| MD5 |
5c5a94d0acaf8057c6255b088cd64d70
|
|
| BLAKE2b-256 |
897514d3f225e0d231dc98bf5fc1a928081c0d82d2a5b60eead28e5e635eb27a
|
File details
Details for the file mplStrater-0.0.5-py3-none-any.whl.
File metadata
- Download URL: mplStrater-0.0.5-py3-none-any.whl
- Upload date:
- Size: 9.1 kB
- Tags: Python 3
- Uploaded using Trusted Publishing? No
- Uploaded via: twine/3.4.1 importlib_metadata/4.8.2 pkginfo/1.7.1 requests/2.26.0 requests-toolbelt/0.9.1 tqdm/4.62.3 CPython/3.7.11
File hashes
| Algorithm | Hash digest | |
|---|---|---|
| SHA256 |
5be2224c92387d84ebd48d1eeb80ba38d9aee89df46ff3f2ad7f188d73a3f7d6
|
|
| MD5 |
b2b066777c093dd9508748648da19c46
|
|
| BLAKE2b-256 |
bb8c9c2976ea1e09e0354fa5f8ffe2e9ba2bb54d7276d8d919cf5dd47fc47be2
|


