🛠️ a command interface to the OpenAI API
Project description
🛠️ openai-commands (@openai)
@openai is a bash interface to the OpenAI API.
🔷 completion 🔷 code generation 🔷 sentence -> image 🔷 text -> mural 🔷 vision 🔷 images 🔷 gpt 🔷 VisuaLyze 🔷
Install
Install awesome-bash-cli (abcli), then,
abcli git clone openai-commands install
Completion
@openai complete "describe mathematics"
Mathematics is an abstract science that examines topics such as quantity, structure, space, change, and other topics in various ways. It involves the use of logic, algorithms, and formulas to solve problems. Mathematics can be used to study the natural world, to describe phenomena, and to make predictions about the future. It provides the foundation for the development of a wide range of disciplines in science, technology, engineering, economics, finance, and more.
also works in a notebook.
Code Generation
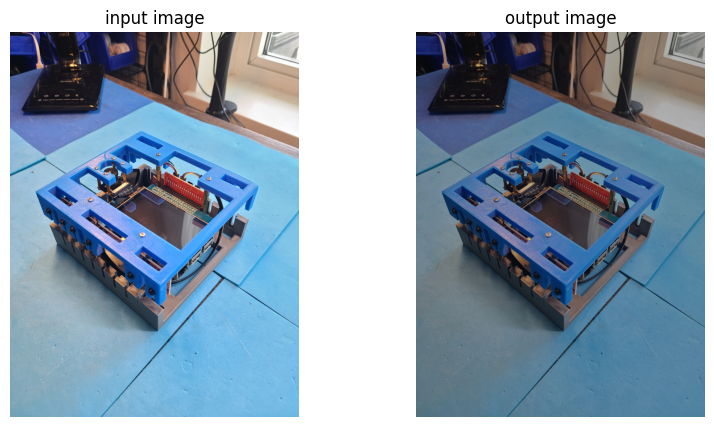
Example notebooks to generate a python functions, special case for image to image python functions, and to write a bash script to use a script, for example, Vancouver-Watching.
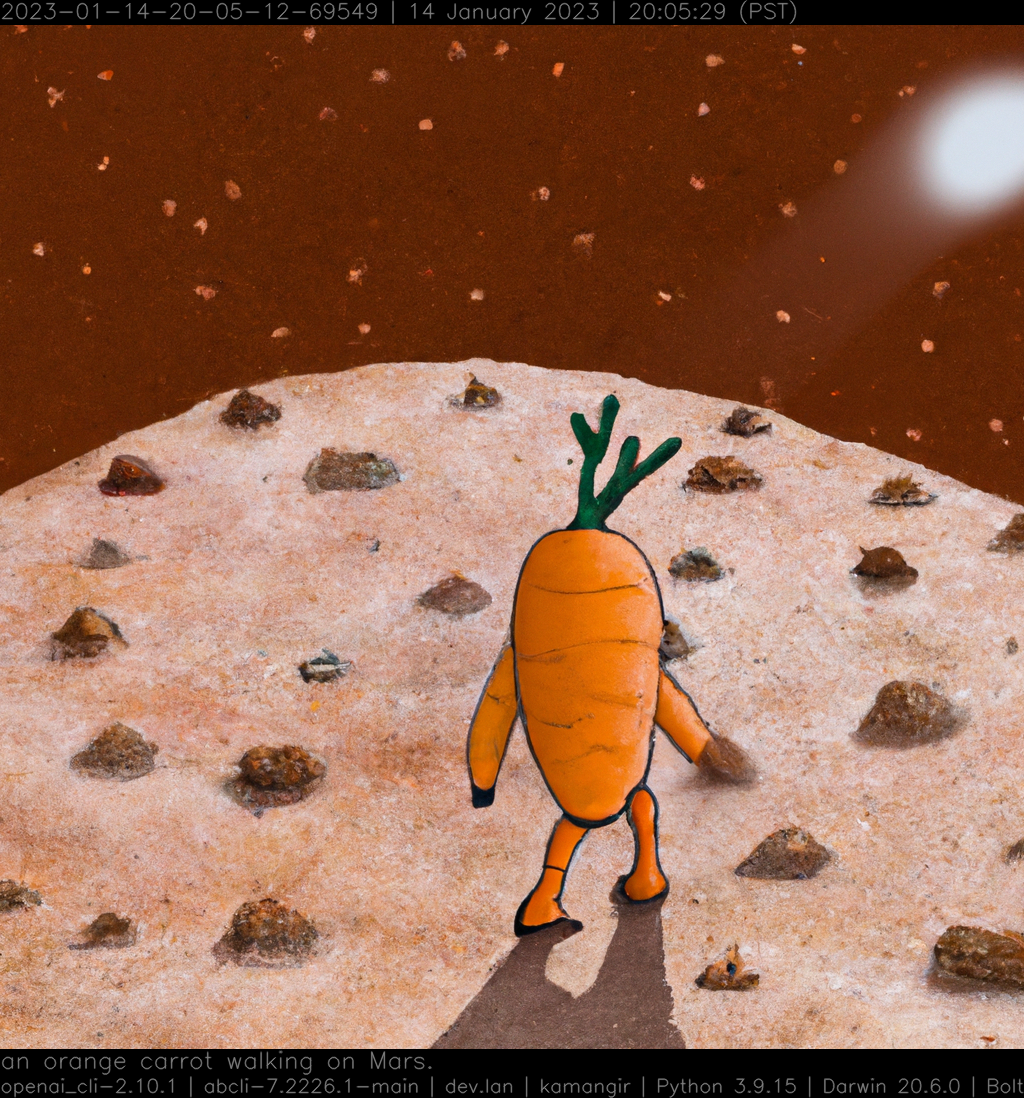
Sentence -> Image
@select - open; \
@openai generate image \
  ~dryrun,height=1024,width=1024 \
  carrot - \
  "an orange carrot walking on Mars."
Text -> Mural
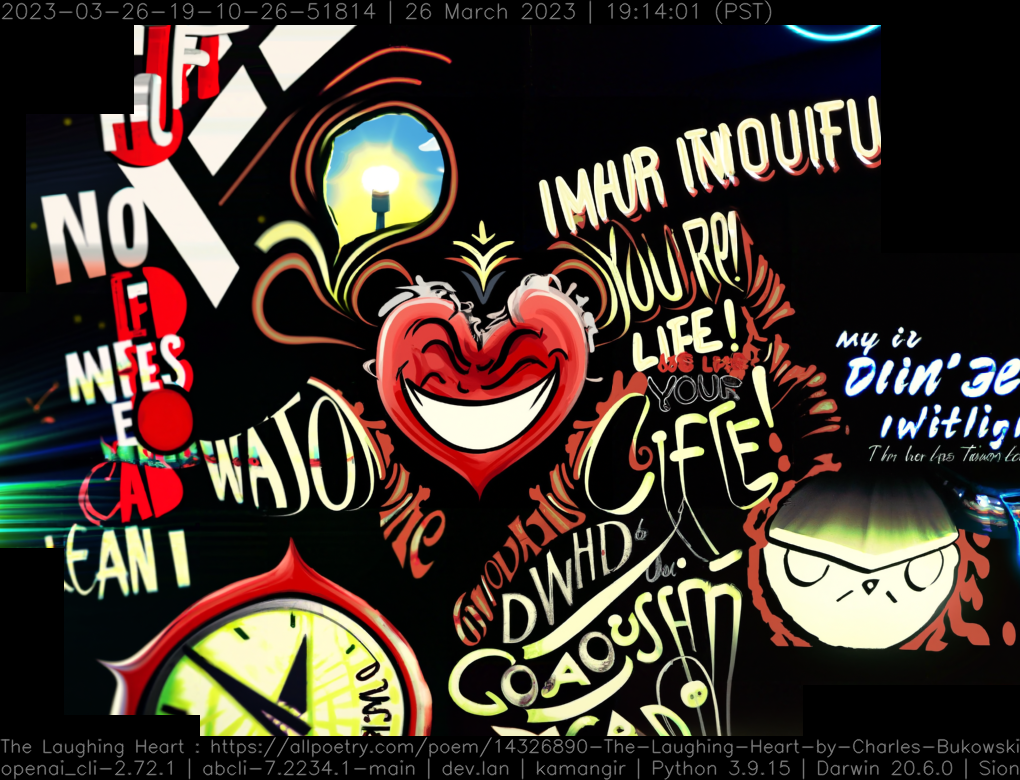
"The Laughing Heart" by Charles Bukowski, more examples.
@select - open; \
DALL-E render  \
  ~dryrun,publish,url,verbose \
  https://allpoetry.com/poem/14326890-The-Laughing-Heart-by-Charles-Bukowski
Vision
Implements the OpenAI vision API.
GPT-4 with Vision ...
GPT-4Vorgpt-4-vision-previewin the API ... model ... take in images and answer questions about them ... not stateful ... (more)
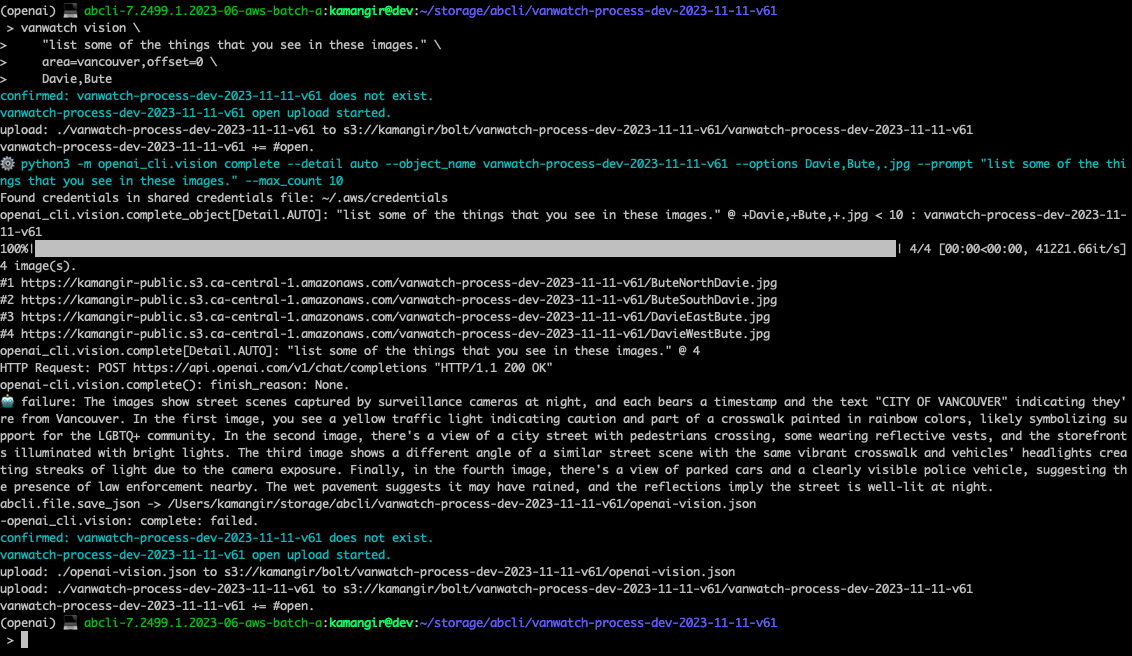
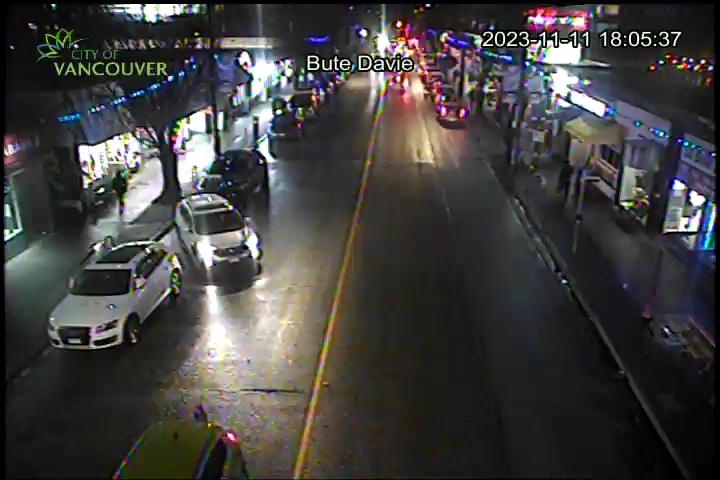
Example use on the images ingested from the traffic cameras in downtown Vancouver, using Vancouver-Watching 🌈,
@openai vision \
    "list some of the things that you see in these images." \
    - Davie,Bute,.jpg \
    $(vanwatch list area=vancouver,ingest,published \
        --log 0 \
        --count 1 \
        --offset 0) \
    --max_count 10 \
    --verbose 1
Or, equivalently,
vanwatch vision \
    "list some of the things that you see in these images." \
    area=vancouver,offset=0 \
    Davie,Bute
 |
 |
 |
 |
|---|
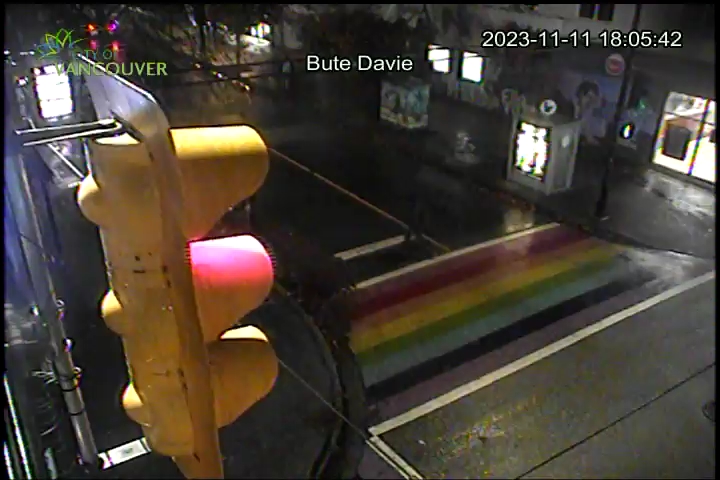
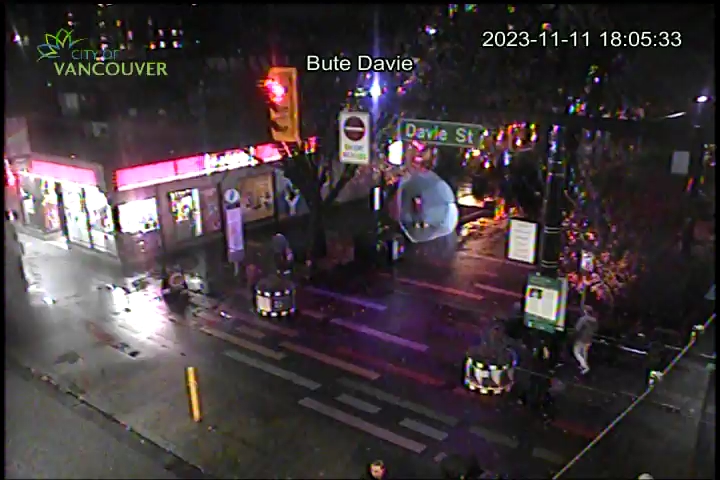
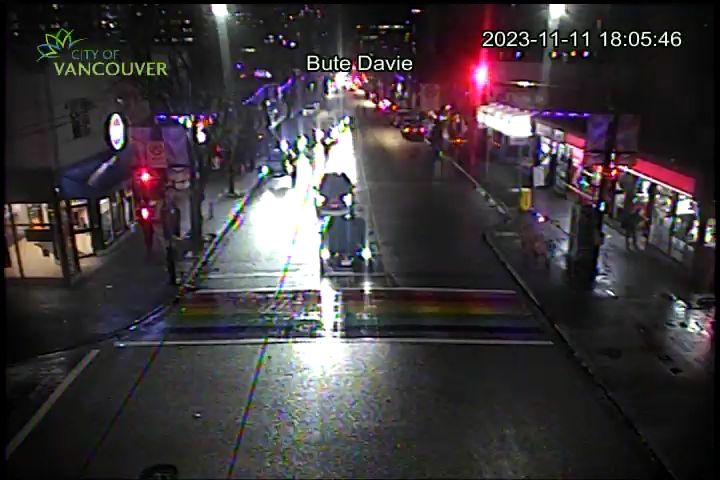
The images show street scenes captured by surveillance cameras at night, and each bears a timestamp and the text "CITY OF VANCOUVER" indicating they're from Vancouver. In the first image, you see a yellow traffic light indicating caution and part of a crosswalk painted in rainbow colors, likely symbolizing support for the LGBTQ+ community. In the second image, there's a view of a city street with pedestrians crossing, some wearing reflective vests, and the storefronts illuminated with bright lights. The third image shows a different angle of a similar street scene with the same vibrant crosswalk and vehicles' headlights creating streaks of light due to the camera exposure. Finally, in the fourth image, there's a view of parked cars and a clearly visible police vehicle, suggesting the presence of law enforcement nearby. The wet pavement suggests it may have rained, and the reflections imply the street is well-lit at night.
images
Implements the OpenAI Image Generation API.
Notebook implementation https://raw.githubusercontent.com/kamangir/openai-commands/main/notebooks/images.ipynb,
@select - open; \
@openai images generate - \
	"a person flying through the streets of Vancouver." \
	. --verbose 1
gpt
co-authored with ChapGPT.
gpt
 > gpt help
gpt [dryrun,~upload] \
	[-|<object-name>] \
	[--model_name gpt-4-turbo-preview]
 . chat with gpt.
gpt list_models [-] \
	[--log 0]
 . list models.
VisuaLyze
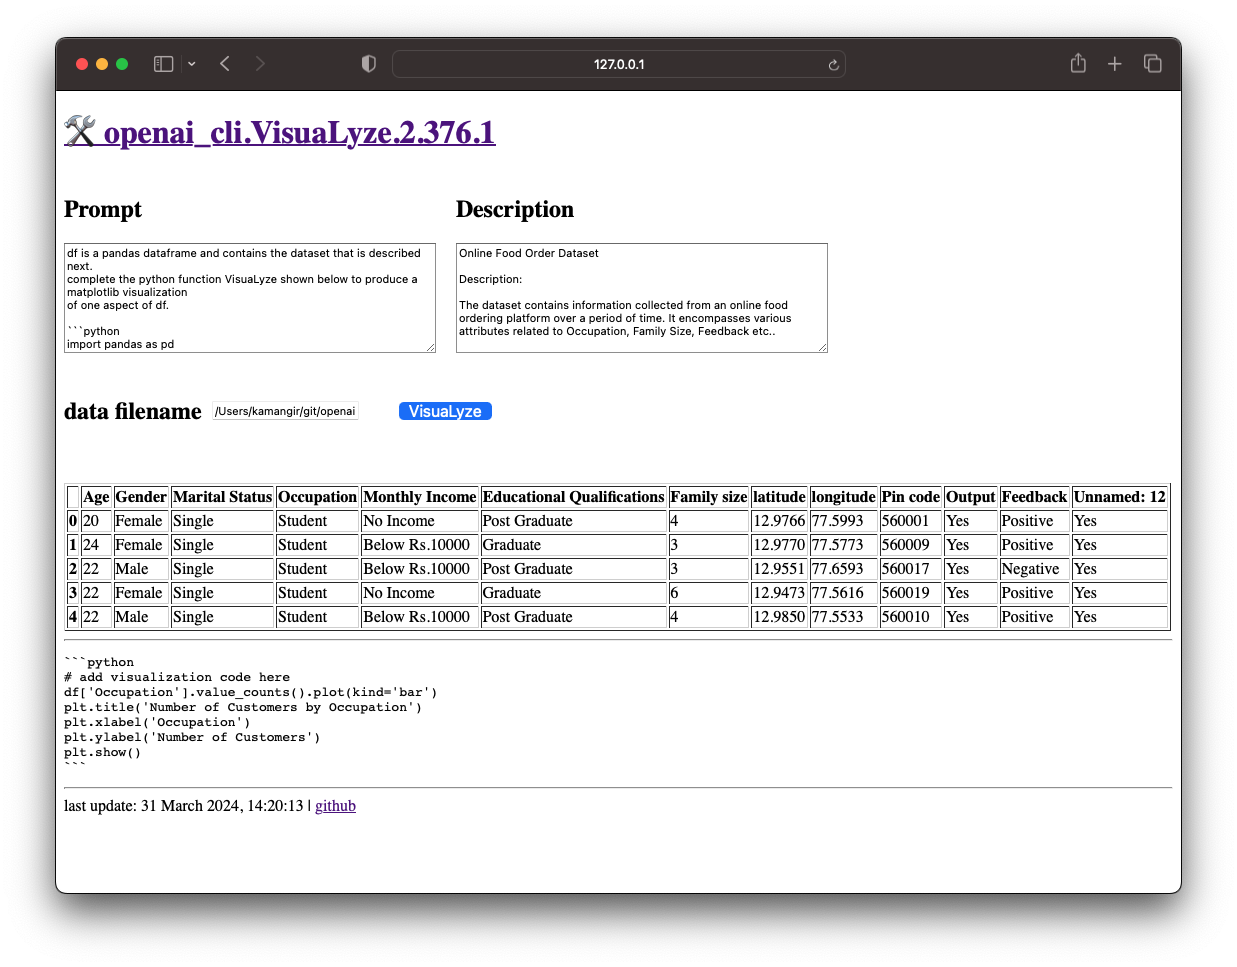
How about calling it "VisuaLyze"? This name combines "visualize" and "analyze," reflecting the tool's capability to generate custom data visualizations and analyze user input through AI - OpenAI, more
VisuaLyze run
sample output for onlinefoods.
import pandas as pd
import matplotlib.pyplot as plt

def VisuaLyze(df: pd.DataFrame()):
    # Generate a matplotlib visualization of one aspect of the dataset

    # For example, let's say we want to visualize the distribution of ages in the dataset
    plt.figure(figsize=(10,6))
    df['Age'].hist(bins=20, color='skyblue', edgecolor='black')
    plt.title('Distribution of Ages in the Online Food Order Dataset')
    plt.xlabel('Age')
    plt.ylabel('Frequency')
    plt.show()
Project details
Release history Release notifications | RSS feed
Download files
Download the file for your platform. If you're not sure which to choose, learn more about installing packages.
Source Distribution
Built Distribution
Hashes for openai_commands-3.7.1-py3-none-any.whl
| Algorithm | Hash digest | |
|---|---|---|
| SHA256 | 7c082d4131f3e8cd07ba168fc13c46fd95ac1a751159343b2c5411d18d108599 |
|
| MD5 | e7513d438ca0a24a147154c2e297ed6b |
|
| BLAKE2b-256 | fb63d857311d353a4f4cd4437eb53ff85760ea062946e35b21973ff0a81a45ad |


