
This release is a pre-release and may not be stable for production use.
OpenTelemetry Prometheus Remote Write Exporter
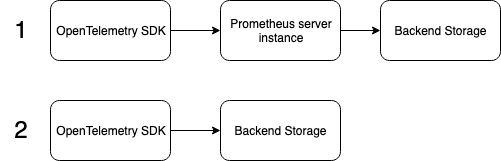
This package contains an exporter to send OTLP metrics from the OpenTelemetry Python SDK directly to a Prometheus Remote Write integrated backend (such as Cortex or Thanos) without having to run an instance of the Prometheus server. The latest types.proto and remote.proto protocol buffers are used to create the WriteRequest. The image below shows the two Prometheus exporters in the OpenTelemetry Python SDK.
Pipeline 1 illustrates the setup required for a Prometheus “pull” exporter.
Pipeline 2 illustrates the setup required for the Prometheus Remote Write exporter.
The Prometheus Remote Write Exporter is a “push” based exporter and only works with the OpenTelemetry push controller. The controller periodically collects data and passes it to the exporter. This exporter then converts the data into timeseries and sends it to the Remote Write integrated backend through HTTP POST requests. The metrics collection datapath is shown below:
See the examples folder for a demo usage of this exporter
Table of Contents
Installation
Prerequisites
- Install the snappy c-library
DEB: sudo apt-get install libsnappy-dev
RPM: sudo yum install libsnappy-devel
OSX/Brew: brew install snappy
Windows: pip install python_snappy-0.5-cp36-cp36m-win_amd64.whl
Exporter
To install from the latest PyPi release, run pip install opentelemetry-exporter-prometheus-remote-write
Quickstart
from opentelemetry import metrics
from opentelemetry.sdk.metrics import MeterProvider
from opentelemetry.exporter.prometheus_remote_write import (
    PrometheusRemoteWriteMetricsExporter
)

# Sets the global MeterProvider instance
metrics.set_meter_provider(MeterProvider())

# The Meter is responsible for creating and recording metrics. Each meter has a unique name, which we set as the module's name here.
meter = metrics.get_meter(__name__)

exporter = PrometheusRemoteWriteMetricsExporter(endpoint="endpoint_here") # add other params as needed

metrics.get_meter_provider().start_pipeline(meter, exporter, 5)
Examples
This example uses Docker Compose to set up:
A Python program that creates 5 instruments with 5 unique aggregators and a randomized load generator
An instance of Cortex to recieve the metrics data
An instance of Grafana to visualizse the exported data
Requirements
Have Docker Compose installed
Users do not need to install Python as the app will be run in the Docker Container
Instructions
Run docker-compose up -d in the the examples/ directory
The -d flag causes all services to run in detached mode and frees up your terminal session. This also causes no logs to show up. Users can attach themselves to the service’s logs manually using docker logs ${CONTAINER_ID} --follow
Log into the Grafana instance at http://localhost:3000
login credentials are username: admin and password: admin
There may be an additional screen on setting a new password. This can be skipped and is optional
Navigate to the Data Sources page
Look for a gear icon on the left sidebar and select Data Sources
Add a new Prometheus Data Source
Use http://cortex:9009/api/prom as the URL
Set the scrape interval to 2s to make updates appear quickly (Optional)
click Save & Test
Go to Metrics Explore to query metrics
Look for a compass icon on the left sidebar
click Metrics for a dropdown list of all the available metrics
Adjust time range by clicking the Last 6 hours button on the upper right side of the graph (Optional)
Set up auto-refresh by selecting an option under the dropdown next to the refresh button on the upper right side of the graph (Optional)
Click the refresh button and data should show up on hte graph
Shutdown the services when finished
Run docker-compose down in the examples directory
Configuring the Exporter
The exporter can be configured through parameters passed to the constructor. Here are all the options:
endpoint: url where data will be sent (Required)
basic_auth: username and password for authentication (Optional)
headers: additional headers for remote write request as determined by the remote write backend’s API (Optional)
timeout: timeout for requests to the remote write endpoint in seconds (Optional)
proxies: dict mapping request proxy protocols to proxy urls (Optional)
tls_config: configuration for remote write TLS settings (Optional)
Example with all the configuration options:
exporter = PrometheusRemoteWriteMetricsExporter(
    endpoint="http://localhost:9009/api/prom/push",
    timeout=30,
    basic_auth={
        "username": "user",
        "password": "pass123",
    },
    headers={
        "X-Scope-Org-ID": "5",
        "Authorization": "Bearer mytoken123",
    },
    proxies={
        "http": "http://10.10.1.10:3000",
        "https": "http://10.10.1.10:1080",
    },
    tls_config={
        "cert_file": "path/to/file",
        "key_file": "path/to/file",
        "ca_file": "path_to_file",
        "insecure_skip_verify": true, # for developing purposes
    }
)
Securing the Exporter
Authentication
The exporter provides two forms of authentication which are shown below. Users can add their own custom authentication by setting the appropriate values in the headers dictionary
Basic Authentication Basic authentication sets a HTTP Authorization header containing a base64 encoded username/password pair. See RFC 7617 for more information. This
exporter = PrometheusRemoteWriteMetricsExporter(
    basic_auth={"username": "base64user",  "password": "base64pass"}
)
Bearer Token Authentication This custom configuration can be achieved by passing in a custom header to the constructor. See RFC 6750 for more information.
header = {
    "Authorization": "Bearer mytoken123"
}
TLS
Users can add TLS to the exporter’s HTTP Client by providing certificate and key files in the tls_config parameter.
Supported Aggregators
Behaviour of these aggregators is outlined in the OpenTelemetry Specification. All aggregators are converted into the timeseries data format. However, method in which they are converted differs from aggregator to aggregator. A map of the conversion methods can be found here.
OpenTelemetry Aggregator |
Equivalent Prometheus Data Type |
Behaviour |
Sum |
Counter |
Metric value can only go up or be reset to 0 |
MinMaxSumCount |
Gauge |
Metric value can arbitrarily increment or decrement |
Histogram |
Histogram |
Unlike the Prometheus histogram, the OpenTelemetry Histogram does not provide a sum of all observed values |
LastValue |
N/A |
Metric only contains the most recently observed value |
ValueObserver |
N/A |
Similar to MinMaxSumCount but also contains LastValue |
Error Handling
In general, errors are raised by the calling function. The exception is for failed requests where any error status code is logged as a warning instead.
This is because the exporter does not implement any retry logic as data that failed to export will be dropped.
For example, consider a situation where a user increments a Counter instrument 5 times and an export happens between each increment. If the exports happen like so:
SUCCESS FAIL FAIL SUCCESS SUCCESS
1       2    3    4       5
Then the received data will be:
1 4 5
Contributing
If you would like to learn more about the exporter’s structure and design decisions please view the design document below
Design Doc
This document is stored elsewhere as it contains large images which will significantly increase the size of this repo.
1 maintainer

Release files for opentelemetry-exporter-prometheus-remote-write 0.17b0
For a detailed explanation of source distributions (sdists) and built distributions (wheels), please see the package formats documentation.
Source distribution (sdist)
| File | Size | Uploaded | |
|---|---|---|---|
| opentelemetry-exporter-prometheus-remote-write-0.17b0.tar.gz | 22.9 kB | Details |
Built distribution (wheel)
| File | Interpreter | ABI | Platform | Reset |
|---|---|---|---|---|
| opentelemetry_exporter_prometheus_remote_write-0.17b0-py3-none-any.whl | Python 3 | none | any | Details |
Total release size: 42.6 kB
Release files / opentelemetry-exporter-prometheus-remote-write-0.17b0.tar.gz
| Download URL | opentelemetry-exporter-prometheus-remote-write-0.17b0.tar.gz |
|---|---|
| Size | 22.9 kB |
| Tags | Source |
|
SHA-256 checksum How to use checksums |
932720d2bd3478841c45d70a1eb367c48add8e7de5bd2a1b827a316358ee9ebe
|
|
BLAKE2b-256 checksum How to use checksums |
9804412929cbda72bb8330dbe95b46de700a91f687ab3854cd3a55c09fd879ca
|
| Upload date | |
|
Uploaded using Trusted Publishing? What is trusted publishing? |
No |
| Uploaded via |
twine/3.3.0 pkginfo/1.7.0 requests/2.25.1 setuptools/51.3.3 requests-toolbelt/0.9.1 tqdm/4.56.0 CPython/3.7.9
|
Release files / opentelemetry_exporter_prometheus_remote_write-0.17b0-py3-none-any.whl
| Download URL | opentelemetry_exporter_prometheus_remote_write-0.17b0-py3-none-any.whl |
|---|---|
| Size | 19.7 kB |
| Tags | Python 3 |
|
SHA-256 checksum How to use checksums |
c4b6a844a599a23ad27a27a2b2f79d543ef171f9dcef67a052ad85f8f90700c6
|
|
BLAKE2b-256 checksum How to use checksums |
3c5941a232313615e925ae6d7f746e57e61c4d9c24112e2b309a81ebdf6983a0
|
| Upload date | |
|
Uploaded using Trusted Publishing? What is trusted publishing? |
No |
| Uploaded via |
twine/3.3.0 pkginfo/1.7.0 requests/2.25.1 setuptools/51.3.3 requests-toolbelt/0.9.1 tqdm/4.56.0 CPython/3.7.9
|














