
This is a Python script for printing performance profiles as defined by E. D. Dolan and J. J. Moré.
It is based on perfprof.m
from the MATLAB Guide by D. J. Higham and N. J. Higham.
Performance profiles
Performance profiles are a mechanism to visualise the performance of multiple algorithms on multiple test problems.
Given m problems and n algorithms, we're interested in the relative performance of all algorithms across the entire problem set.
Let t = t(i, j) > 0 be a measure of the performance of solver j on problem i, where lower means "better".
Common choices for t are:
- execution/CPU time;
- number of iterations (assuming the algorithms are iterative);
- the number of evaluations of some reference function (e.g., the ordering predicate in a sorting algorithm, or the objective function in an optimisation algorithm).
Given this data, a typical performance profile may look like this:
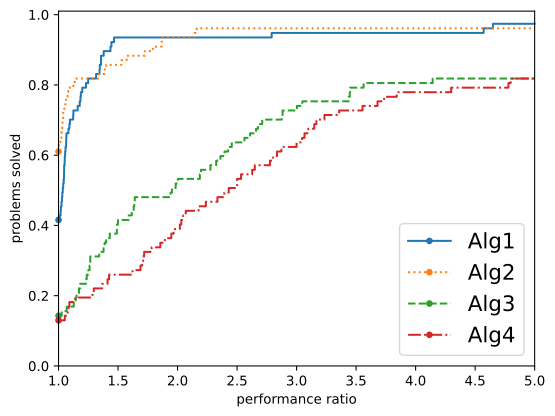
Each algorithm has one line plot, where a point (x, y) means that, for x of the problem set, the algorithm in question was within a factor of y of the respective best algorithm.
For example:
- the point ≈
(1, 0.6)means thatAlg2was the fastest algorithm on around 60% of the problem set; - the point ≈
(1.5, 0.4)means thatAlg3was within a factor of 1.5 of the respective best algorithm for 40% of problems;- note that the "best" algorithm may be different for each problem;
- the point ≈
(1.5, 0.95)means thatAlg1was within a factor of 1.5 of the respective best algorithm for 95% of problems; - etc.
Generally speaking, an algorithm is considered efficient (relative to the others) when its performance profile comes close to the top left corner (1, 1).
It is possible for algorithms to fail on certain problems.
This can be achieved by simply setting the performance measure t(i, j) to +inf or NaN.
Usage examples
import matplotlib.pyplot as plt
import perfprof

palette = ['-r', ':b', '--c', '-.g', '-y']

perfprof.perfprof(data, palette)
plt.show()
Marking y-intercepts
Markers can be inserted using the standard matplotlib pattern.
import matplotlib.pyplot as plt
import perfprof

palette = ['o-r', 'o:b', 'o--c', 'o-.g', 'o-y']

perfprof.perfprof(data, palette, markersize=4, markevery=[0])
plt.show()
Displaying legends
Legends can be displayed using matplotlib.pyplot.legend.
import matplotlib.pyplot as plt
import perfprof

palette = ['o-r', 'o:b', 'o--c', 'o-.g', 'o-y']
legend = ['Algorithm 1', 'Algorithm 2']

perfprof.perfprof(data, palette, markersize=4, markevery=[0])
plt.legend(legend)
plt.show()
Why another implementation?
Multiple implementations of performance profiles already exist in the public domain.
The design of perfprof was driven by a few key desires:
- Simplicity: provide a clearly scoped, easy to use implementation that integrates with
matplotlib; - Flexibility: unlock the full power of
matplotlibfor plot styling, legends, subplots etc.; - Robustness: the implementation must work in all edge cases including
inf,NaN, etc.; - Usability: full Python3 compatibility and sensible defaults where possible.
1 maintainer

Metadata
1 maintainer
Release files for perfprof 0.2
For a detailed explanation of source distributions (sdists) and built distributions (wheels), please see the package formats documentation.
Source distribution (sdist)
| File | Size | Uploaded | |
|---|---|---|---|
| perfprof-0.2.tar.gz | 5.5 kB | Details |
Built distributions (wheels)
| File | Interpreter | ABI | Platform | Reset |
|---|---|---|---|---|
| perfprof-0.2-py3.8.egg | Legacy Egg format | - | - | Details |
| perfprof-0.2-py3-none-any.whl | Python 3 | none | any | Details |
Total release size: 18.7 kB
Release files / perfprof-0.2.tar.gz
| Download URL | perfprof-0.2.tar.gz |
|---|---|
| Size | 5.5 kB |
| Tags | Source |
|
SHA-256 checksum How to use checksums |
4d54aeca8e2646fc7c9c2be5e397de0b72bf03d449235a48afe5ee3661085cc9
|
|
BLAKE2b-256 checksum How to use checksums |
73257248b257255f30b60db4fa61c1583a470d56eecb1336546df85183b35eb1
|
| Upload date | |
|
Uploaded using Trusted Publishing? What is trusted publishing? |
No |
| Uploaded via |
twine/3.4.1 importlib_metadata/4.4.0 pkginfo/1.7.0 requests/2.25.1 requests-toolbelt/0.9.1 tqdm/4.61.0 CPython/3.8.10
|
Release files / perfprof-0.2-py3.8.egg
| Download URL | perfprof-0.2-py3.8.egg |
|---|---|
| Size | 7.5 kB |
| Tags | Egg |
|
SHA-256 checksum How to use checksums |
f13d56fb309a63d7d1e467a40ab24c4feac062aa2bbc13d4ecb2fb9bfaf2ab7f
|
|
BLAKE2b-256 checksum How to use checksums |
08d6c373ead0d62a135d7bc9fdfc266f1f54a9c3b52cc011d00b9c17f5dfc0eb
|
| Upload date | |
|
Uploaded using Trusted Publishing? What is trusted publishing? |
No |
| Uploaded via |
twine/3.4.1 importlib_metadata/4.4.0 pkginfo/1.7.0 requests/2.25.1 requests-toolbelt/0.9.1 tqdm/4.61.0 CPython/3.8.10
|
Release files / perfprof-0.2-py3-none-any.whl
| Download URL | perfprof-0.2-py3-none-any.whl |
|---|---|
| Size | 5.6 kB |
| Tags | Python 3 |
|
SHA-256 checksum How to use checksums |
2d053c52b21229014aab94ce1866dd234381e2badce45eb522ae6f81148c4b0f
|
|
BLAKE2b-256 checksum How to use checksums |
13f02e442e4c590fcbeeb938604215090d314d9e1f34b994010775d5b44a6285
|
| Upload date | |
|
Uploaded using Trusted Publishing? What is trusted publishing? |
No |
| Uploaded via |
twine/3.4.1 importlib_metadata/4.4.0 pkginfo/1.7.0 requests/2.25.1 requests-toolbelt/0.9.1 tqdm/4.61.0 CPython/3.8.10
|













