Python profiling tool

Project description


Installing
pip install pprof
or
poetry add pprof
A Simple Example
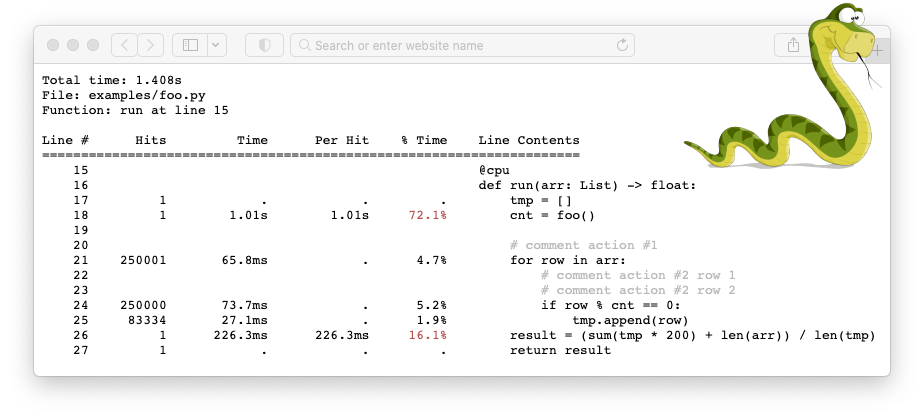
from time import sleep
from typing import List
from pprof import cpu

cpu.auto_report()

def foo():
    sleep(1.01)
    return 3

@cpu
def run(arr: List) -> float:
    tmp = []
    cnt = foo()

    # comment action #1
    for row in arr:
        # comment action #2 row 1
        # comment action #2 row 2
        if row % cnt == 0:
            tmp.append(row)
    result = (sum(tmp * 200) + len(arr)) / len(tmp)  # comment action #3
    return result

run(list(range(250000)))
(venv) python run.py
Links
- line_profiler (https://github.com/pyutils/line_profiler)


Download files
Download the file for your platform. If you're not sure which to choose, learn more about installing packages.
Source Distribution
pprof-0.2.0.tar.gz
(4.5 kB
view hashes)
Built Distribution
pprof-0.2.0-py3-none-any.whl
(4.2 kB
view hashes)


