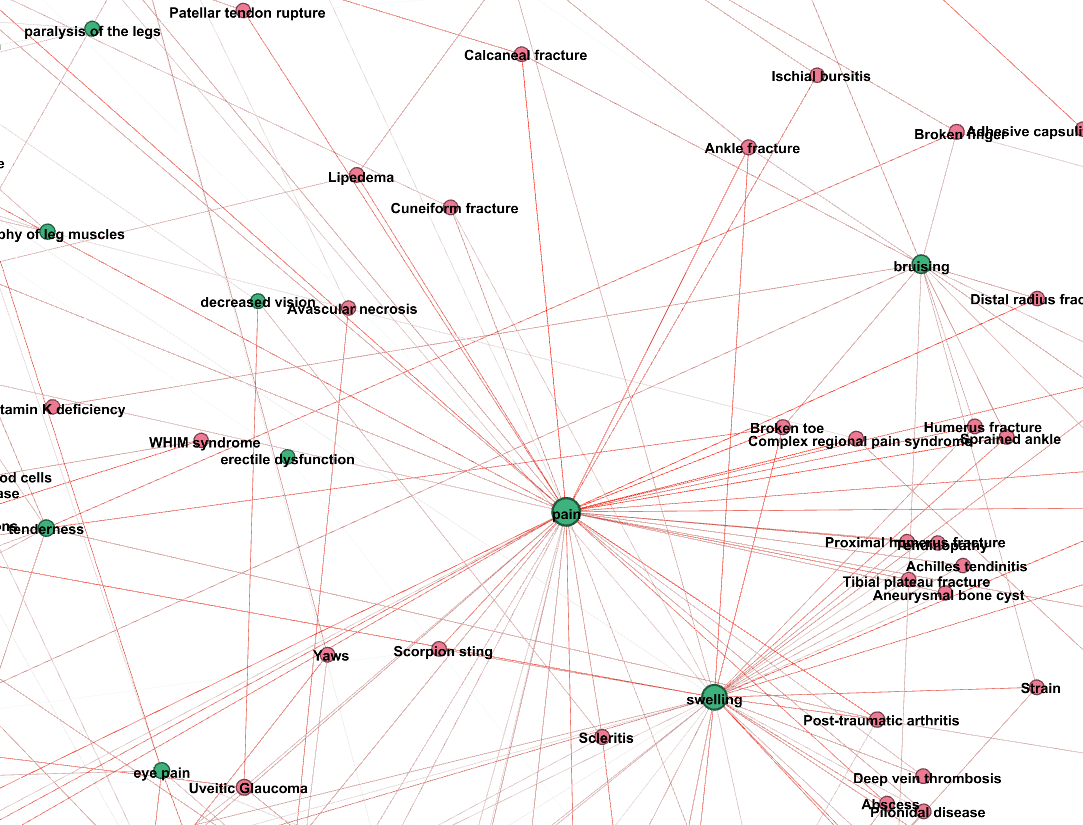
Using a bipartite graph of medical conditions and symptoms with relative weighted edges, gives the estimated probability of having each illness given a list of symptoms
Project description
Probabilistic Symptom Graph
pip install probabilistic-symptom-graph
from src.ProbabilisticSymptomGraph import ProbabilisticSymptomConditionGraph

import networkx as nx
import numpy as np

medical_condition_gexf = "./data/medical-condition-symptom-graph.gexf"
graph = nx.read_gexf(medical_condition_gexf)
sim_matrix = np.load('./data/md-symptom-sim-mat.npy')

symptom_names = []
for node_id, tpe in graph.nodes(data="type"):
    if tpe == "Symptom":
        symptom_names.append(node_id)
symptom_names = sorted(symptom_names)

condition_names = []
for node_id, tpe in graph.nodes(data="type"):
    if tpe == "MedicalCondition":
        condition_names.append(node_id)
condition_names = sorted(condition_names)

probabilistic_graph = ProbabilisticSymptomConditionGraph(condition_names, symptom_names, graph, sim_matrix)
print(" | ".join(probabilistic_graph.get_all_symptoms()[:10]))
probabilistic_graph.get_condition_probs(["acne"])[:5]
Graph Image
Red nodes represent medical conditions and green nodes represent symptoms.

Data Mining
See ./data/WikipediaSymptomExtractor.ipynb
Project details
Release history Release notifications | RSS feed
Download files
Download the file for your platform. If you're not sure which to choose, learn more about installing packages.
Source Distribution
Built Distribution
Close
Hashes for probabilistic-symptom-graph-1.0.3.tar.gz
| Algorithm | Hash digest | |
|---|---|---|
| SHA256 | 8ae051f049796daede0327cb3235fe0e1c4a03296843e1ee027aa24848888ac3 |
|
| MD5 | 34db3c15af82277f808edb1269163cb4 |
|
| BLAKE2b-256 | 8d45b7542d976f10ce4a17d285e3b1e432580f0115807a37688e321fa17e91f7 |
Close
Hashes for probabilistic_symptom_graph-1.0.3-py3-none-any.whl
| Algorithm | Hash digest | |
|---|---|---|
| SHA256 | b18d9c6da5d3c1ae11ac5f07877ea42a114d14055af7546e6157a70ee42d5881 |
|
| MD5 | 222c45ebd799b9a913fd5000564b4d5a |
|
| BLAKE2b-256 | f0c09bcaff60982a33defaedc871d813279feea1c2f3f2a24179c3b751caea16 |


