Connecting Process Network Synthesis (PNS) to Modern Programming Ecosystems

Project description
Pgraph : Process Graphs for Process Network Synthesis (PNS)


Table of Contents
About The Project
This project aims at enabling the classical P-graph Framework (www.p-graph.org) to interface with modern Python programming ecosystems. The backend solver is the original executable from P-graph, staying true to the original implementation of P-graph. For manual network manipulation, the P-graph studio can be downloaded from this link: https://p-graph.org/downloads/.
Changelog
14/11/2024: Due to update of P-graph studio, mutual exclusion is not properly processed. This is now fixed. Custom solvers can now also be selected for advanced users.
18/10/2024: Due to update of networkx draw, older versions of Pgraph crashes when it draws the graph. This has now been fixed. Users now need to adjust axis size themselves.
Getting Started
Install this library either from the official PyPI or from this Github repository:
Install a Stable Version (PyPI)
pip install ProcessGraph
Install most updated version from Github
In a environment terminal or CMD:
pip install git+https://github.com/tsyet12/Pgraph
Usage Examples
See examples for all code examples.
Simple Example
from Pgraph.Pgraph import Pgraph #This is our Pgraph library
import networkx as nx
import matplotlib.pyplot as plt
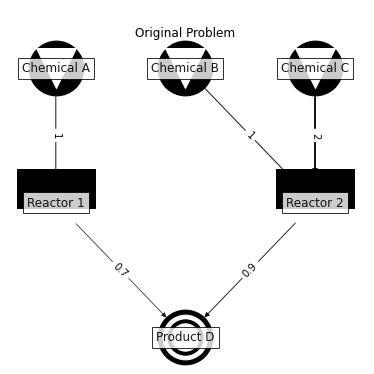
##### STEP 1 : Problem Specification ######
G = nx.DiGraph()
G.add_node("M1",names="Product D",type='product',flow_rate_lower_bound=100, flow_rate_upper_bound=100)
G.add_node("M2",names="Chemical A",type='raw_material',price=200,flow_rate_lower_bound=0)
G.add_node("M3",names="Chemical B", type='raw_material',price=100,flow_rate_lower_bound=0)
G.add_node("M4",names="Chemical C", type='raw_material',price=10,flow_rate_lower_bound=0)
G.add_node("O1",names="Reactor 1",fix_cost=2000, proportional_cost=400)
G.add_node("O2", names="Reactor 2",fix_cost=1000, proportional_cost=400)
G.add_edge("M2","O1", weight = 1)
G.add_edge("M3","O2", weight = 1)
G.add_edge("M4","O2", weight = 2)
G.add_edge("O1","M1", weight = 0.7)
G.add_edge("O2","M1", weight = 0.9)
ME=[["O1","O2"]] #Reactor 1 and Reactor 2 are mutually excluded. Only one can be chosen as solution.
#### Step 2: Setup Solver ####
P=Pgraph(problem_network=G, mutual_exclusion=ME, solver="INSIDEOUT",max_sol=100)
#### Step 2.1: Plot Problem #####
ax1=P.plot_problem(figsize=(5,5))
ax1.set_xlim(0,200)
plt.show()
##################################
#### Step 3: Run ####
P.run()
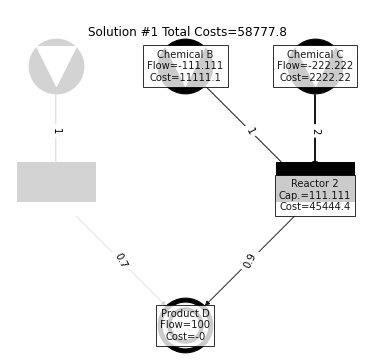
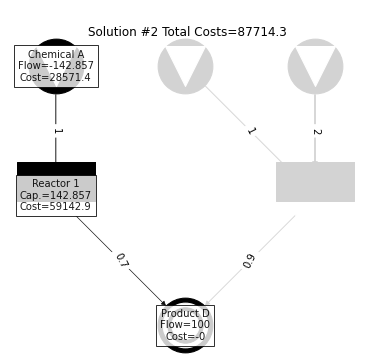
#### Step 3.1: Plot Solution########
total_sol_num=P.get_sol_num()
for i in range(total_sol_num): # Here we loop through all the solutions to plot everything
ax=P.plot_solution(sol_num=i) #Plot Solution Function
ax.set_xlim(0,200)
plt.show()
#### Step 3.2: Export to P-graph Studio ####
from google.colab import files #This is only for google colab
string = P.to_studio(path='./',verbose=False) #export to p-graph studio
files.download("./studio_file.pgsx") #download for google colab
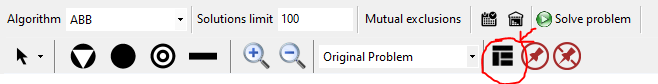
#Note: Please be reminded to press "Generate Layout" button in P-graph Studio after opening
Press "Generate Layout" Button:
Contributing
Contributions are what make the open source community such an amazing place to be learn, inspire, and create. Any contributions you make are greatly appreciated.
- Fork the Project
- Create your Feature Branch (
git checkout -b testbranch/prep) - Commit your Changes (
git commit -m 'Improve testbranch/prep') - Push to the Branch (
git push origin testbranch/prep) - Open a Pull Request
License
Distributed under the Open Sourced BSD-2-Clause License. See LICENSE for more information.
Contact
Main Developer:
Sin Yong Teng sinyong.teng@ru.nl or tsyet12@gmail.com Radboud University Nijmegen
References
Teng, S.Y., Orosz, Á., How, B.S., Pimentel, J., Friedler, F. and Jansen, J.J., 2022. Framework to Embed Machine Learning Algorithms in P-graph: Communication from the Chemical Process Perspectives. Chemical Engineering Research and Design. (Paper explaining the software)
Friedler, F., Tarjan, K., Huang, Y.W. and Fan, L.T., 1992. Graph-theoretic approach to process synthesis: axioms and theorems. Chemical Engineering Science, 47(8), pp.1973-1988.
Friedler, F., Tarjan, K., Huang, Y.W. and Fan, L.T., 1992. Combinatorial algorithms for process synthesis. Computers & chemical engineering, 16, pp.S313-S320.
Friedler, F., Tarjan, K., Huang, Y.W. and Fan, L.T., 1993. Graph-theoretic approach to process synthesis: polynomial algorithm for maximal structure generation. Computers & Chemical Engineering, 17(9), pp.929-942.
Acknowledgements
The research contribution from S.Y. Teng is supported by the European Union's Horizon Europe Research and Innovation Program, under Marie Skłodowska-Curie Actions grant agreement no. 101064585 (MoCEGS).
How to cite this software
S.Y. Teng (2022). tsyet12/Pgraph: Process Graphs for Process Network Synthesis (PNS), Zenodo Release 2 (v1.0-zenodo-2). Zenodo. https://doi.org/10.5281/zenodo.6778354


Download files
Download the file for your platform. If you're not sure which to choose, learn more about installing packages.
Source Distributions
Built Distribution
Filter files by name, interpreter, ABI, and platform.
If you're not sure about the file name format, learn more about wheel file names.
Copy a direct link to the current filters
File details
Details for the file ProcessGraph-1.26-py3-none-any.whl.
File metadata
- Download URL: ProcessGraph-1.26-py3-none-any.whl
- Upload date:
- Size: 7.7 MB
- Tags: Python 3
- Uploaded using Trusted Publishing? No
- Uploaded via: twine/4.0.1 CPython/3.8.7
File hashes
| Algorithm | Hash digest | |
|---|---|---|
| SHA256 |
47ba941ca5433587fa8ed51e0da0d8b92c249a2b58c9d91a4f2b7c40a10a5734
|
|
| MD5 |
12b2b5d0b5246d9aeecb794c836e40cf
|
|
| BLAKE2b-256 |
c548783c671f165fb3af78174041b0f226e4c6129596edb8b6b9122d9358e6f2
|


