

PyBarePlot
Description
Lightweight SVG chart generator for the command line and Python, supporting multiple chart types, themes, gradients, legends and fully standalone SVG output.
Supported charts:
- Lines
- Bars
- Grouped bars
- Stacked bars
- Horizontal bars
- Horizontal grouped bars
- Horizontal stacked bars
- Pie
- Radar
- Boxplot
- Gradient line
- Step line
- Optimized step line
Requirements
This package require:
- python3
- python3 Standard Library
Installation
Pip
python3 -m pip install PyBarePlot
Git
git clone "https://github.com/mauricelambert/PyBarePlot.git"
cd "PyBarePlot"
python3 -m pip install .
Wget
wget https://github.com/mauricelambert/PyBarePlot/archive/refs/heads/main.zip
unzip main.zip
cd PyBarePlot-main
python3 -m pip install .
cURL
curl -O https://github.com/mauricelambert/PyBarePlot/archive/refs/heads/main.zip
unzip main.zip
cd PyBarePlot-main
python3 -m pip install .
Usages
Command line
PyBarePlot              # Using CLI package executable
python3 -m PyBarePlot   # Using python module
python3 PyBarePlot.pyz  # Using python executable
PyBarePlot.exe          # Using python Windows executable

PyBarePlot --values 30 50 20 0 10 -o examples/simple.svg

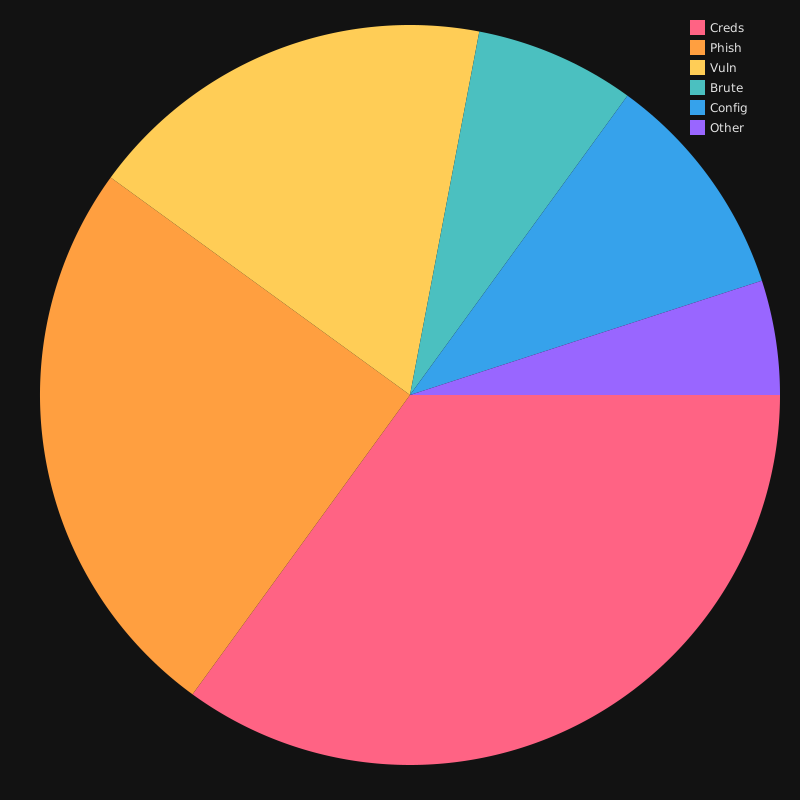
PyBarePlot --type pie --values 35 25 18 7 10 5 --labels Creds Phish Vuln Brute Config Other --graph-name "Accounts breach causes" --colors "#ff6384cc" "#ff9f40cc" "#ffcd56cc" "#4bc0c0cc" "#36a2ebcc" "#9966ffcc" --theme dark --legend --width 800 --height 800 --margin-top 20 --margin-bottom 30 --margin-left 40 --margin-right 20 -o examples/pie.svg --open

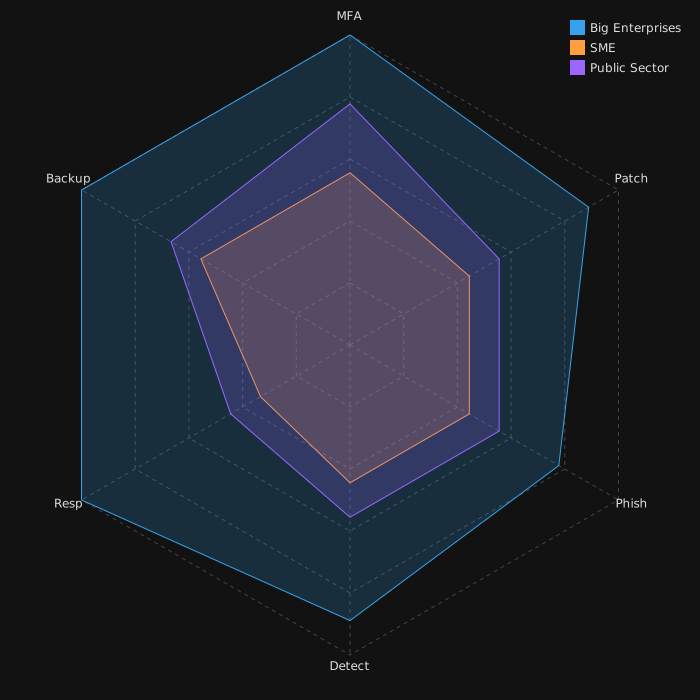
PyBarePlot --type radar --values 4.5 4.0 3.5 4.0 4.5 4.5 --values 2.5 2.0 2.0 2.0 1.5 2.5 --values 3.5 2.5 2.5 2.5 2.0 3.0 --point-labels MFA Patch Phish Detect Resp Backup --graph-name "Big Enterprises" --graph-name "SME" --graph-name "Public Sector" --colors "#36a2eb" "#ff9f40" "#9966ff" --theme dark --legend --width 700 --height 700 --margin-top 20 --margin-bottom 30 --margin-left 40 --margin-right 20 -o examples/radar.svg --open

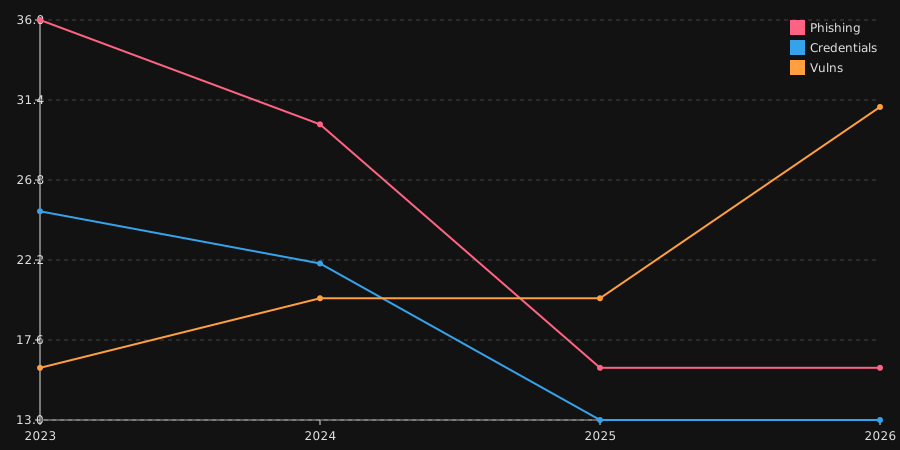
PyBarePlot --type lines --values 36 30 16 16 --values 25 22 13 13 --values 16 20 20 31 --point-labels 2023 2024 2025 2026 --graph-name Phishing --graph-name Credentials --graph-name Vulns --graph-color "#ff6384" --colors "#ff6384" "#ff6384" "#ff6384" "#ff6384" --graph-color "#36a2eb" --colors "#36a2eb" "#36a2eb" "#36a2eb" "#36a2eb" --graph-color "#ff9f40" --colors "#ff9f40" "#ff9f40" "#ff9f40" "#ff9f40" --theme dark --legend --show-points --width 900 --height 450 --margin-top 20 --margin-bottom 30 --margin-left 40 --margin-right 20 -o examples/lines.svg --open

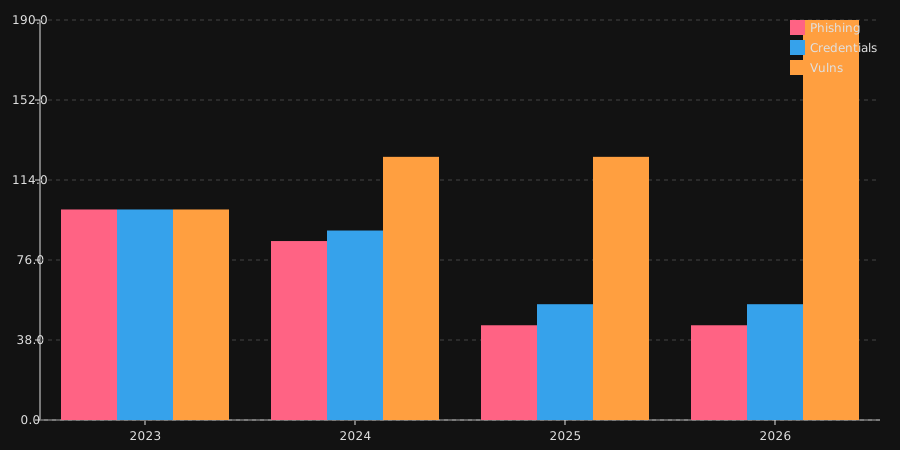
PyBarePlot --type grouped-bars --values 100 85 45 45 --values 100 90 55 55 --values 100 125 125 190 --point-labels 2023 2024 2025 2026 --graph-name Phishing --graph-name Credentials --graph-name Vulns --graph-color "#ff6384" --colors "#ff6384" "#ff6384" "#ff6384" "#ff6384" --graph-color "#36a2eb" --colors "#36a2eb" "#36a2eb" "#36a2eb" "#36a2eb" --graph-color "#ff9f40" --colors "#ff9f40" "#ff9f40" "#ff9f40" "#ff9f40" --theme dark --legend --width 900 --height 450 --margin-top 20 --margin-bottom 30 --margin-left 40 --margin-right 20 -o examples/grouped-bars.svg --open

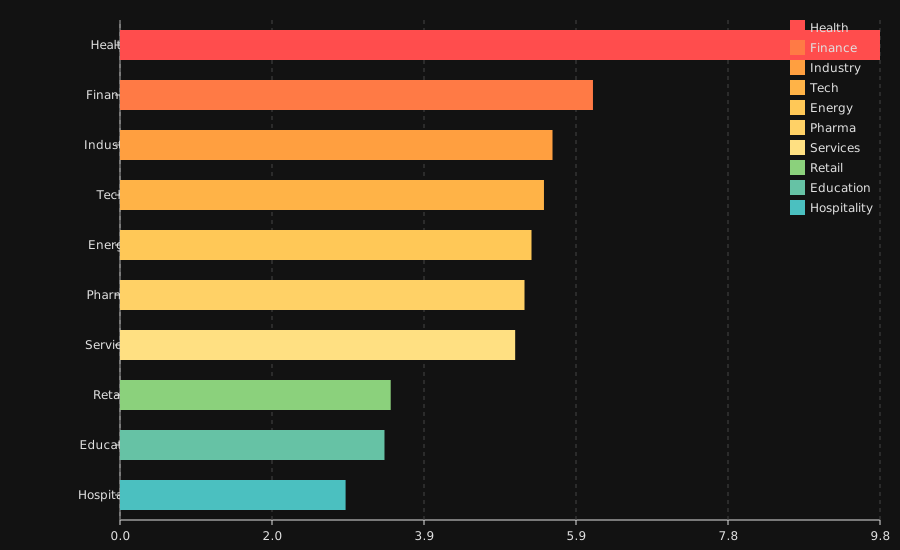
PyBarePlot --type horizontal-bars --values 9.77 6.08 5.56 5.45 5.29 5.20 5.08 3.48 3.40 2.90 --labels Health Finance Industry Tech Energy Pharma Services Retail Education Hospitality --graph-name "Cost (M$)" --graph-color "#36a2eb" --colors "#ff4d4d" "#ff7a45" "#ff9f40" "#ffb347" "#ffc857" "#ffd166" "#ffe082" "#8bd17c" "#66c2a5" "#4bc0c0" --theme dark --width 900 --height 550 --margin-top 20 --margin-bottom 30 --margin-left 120 --margin-right 20 -o examples/horizontal-bars.svg --open --legend
Help:
~# PyBarePlot --help
usage: PyBarePlot PyBarePlot         [-h] [-v VALUE [VALUE ...]] [--csv FILE] [--json FILE] [--mjson FILE]
                                     [-t {lines,bars,grouped-bars,stacked-bars,horizontal-bars,horizontal-grouped-bars,horizontal-stacked-bars,pie,boxplot,radar,gradient-line,step-line,step-line-optimized,bar,line,hbar,horizontal,stack,group,box,gradient,step}]
                                     [--theme {light,dark,transparent}] [-W WIDTH] [-H HEIGHT] [--margin-top MARGIN_TOP] [--margin-bottom MARGIN_BOTTOM]
                                     [--margin-left MARGIN_LEFT] [--margin-right MARGIN_RIGHT] [--graph-name NAME [NAME ...]] [--labels LABEL [LABEL ...]]
                                     [--graph-color NAME] [-c COLOR [COLOR ...]] [--gradient VALUE [VALUE ...]] [--color-step MIN MAX COLOR] [--legend]
                                     [--show-points] [--x-zone START END COLOR] [--y-zone START END COLOR] -o FILE [--open]

Generate SVG charts from the command line.

options:
  -h, --help            show this help message and exit

Input:
  -v, --values VALUE [VALUE ...]
                        Graph values. Repeat the option to create multiple graphs. Example: --values 1 2 3 --values 4 5 6 (default: [])
  --csv FILE            Load one graph from a CSV file. Repeat the option to load multiple CSV files.Format: FILE[;GRAPH_NAME[;GRAPH_COLOR]] (default: [])
  --json FILE           Load one graph from a JSON file. Repeat the option to load multiple JSON files.Format: FILE[;GRAPH_NAME[;GRAPH_COLOR]] (default:
                        [])
  --mjson FILE          Load one or more graphs from a Multi-JSON file. Repeat the option to load multiple files.Format: FILE[;GRAPH_NAME[;GRAPH_COLOR]]
                        (default: [])

Chart:
  -t, --type {lines,bars,grouped-bars,stacked-bars,horizontal-bars,horizontal-grouped-bars,horizontal-stacked-bars,pie,boxplot,radar,gradient-line,step-line,step-line-optimized,bar,line,hbar,horizontal,stack,group,box,gradient,step}
                        Chart type. (default: line)
  --theme {light,dark,transparent}
                        Chart theme. (default: light)
  -W, --width WIDTH     SVG width. (default: 800)
  -H, --height HEIGHT   SVG height. (default: 400)
  --margin-top MARGIN_TOP
                        Top margin. (default: 20)
  --margin-bottom MARGIN_BOTTOM
                        Bottom margin. (default: 30)
  --margin-left MARGIN_LEFT
                        Left margin. (default: 40)
  --margin-right MARGIN_RIGHT
                        Right margin. (default: 20)

Labels:
  --graph-name NAME [NAME ...]
                        Graph name. Repeat once for each graph. (default: [])
  --labels LABEL [LABEL ...]
                        Point labels. (default: [])*
  --point-labels LABEL [LABEL ...]
                        Default labels applied to all graphs (used when per-graph labels are not provided). (default: [])

Colors:
  --graph-color NAME    Graph color. Repeat once for each graph. (default: [])
  -c, --colors COLOR [COLOR ...]
                        Point colors. (default: [])
  --gradient VALUE [VALUE ...]
                        Gradient colors. Examples: --gradient green red --gradient green red 0 100 (default: None)
  --color-step MIN MAX COLOR
                        Color step definition. (default: [])

Decorations:
  --legend              Draw graph legend. (default: False)
  --show-points         Display graph points. (default: False)
  --x-zone START END COLOR
                        Highlight an X zone. (default: [])
  --y-zone START END COLOR
                        Highlight a Y zone. (default: [])

Output:
  -o, --output FILE     Destination SVG file. (default: None)
  --open                Open the generated SVG after saving. (default: False)

~#
Python script
from PyBarePlot import *

chart = SVGChart()
chart.plot_line(Graph([30, 50, 20, 0, 10]))
chart.save("examples/simple.svg")

graph = Graph([DataPoint(35, name="Creds"), DataPoint(25, name="Phish"), DataPoint(18, name="Vuln"), DataPoint(7,  name="Brute"), DataPoint(10, name="Config"), DataPoint(5,  name="Other")], name="Accounts breach causes")
chart = SVGChart(width=800, height=800, margin_top=20, margin_bottom=30, theme="dark")
chart.plot_pie(graph, fill_opacity=0.65, stroke_opacity=1.0)
chart.draw_pie_legend(graph, fill_opacity=0.65, stroke_opacity=1.0)
chart.save("examples/pie.svg")

big = Graph([DataPoint(v, name=n) for v, n in zip([4.5, 4.0, 3.5, 4.0, 4.5, 4.5], ["MFA", "Patch", "Phish", "Detect", "Resp", "Backup"])], name="Big Enterprises", default_color="#36a2eb")
sme = Graph([DataPoint(v, name=n) for v, n in zip([2.5, 2.0, 2.0, 2.0, 1.5, 2.5], ["MFA", "Patch", "Phish", "Detect", "Resp", "Backup"])], name="SME", default_color="#ff9f40")
public = Graph([DataPoint(v, name=n) for v, n in zip([3.5, 2.5, 2.5, 2.5, 2.0, 3.0], ["MFA", "Patch", "Phish", "Detect", "Resp", "Backup"])], name="Public Sector", default_color="#9966ff")
chart = SVGChart(700, 700, margin_top=20, margin_bottom=30, theme="dark")
chart.plot_radar([big, sme, public], fill_opacity=0.2)
chart.draw_legend([big, sme, public])
chart.save("examples/radar.svg")

phishing = Graph([DataPoint(v, name=n) for v, n in zip([36, 30, 16, 16], [2023, 2024, 2025, 2026])], name="Phishing", default_color="#ff6384")
creds = Graph([DataPoint(v, name=n) for v, n in zip([25, 22, 13, 13], [2023, 2024, 2025, 2026])], name="Credentials", default_color="#36a2eb")
vuln = Graph([DataPoint(v, name=n) for v, n in zip([16, 20, 20, 31], [2023, 2024, 2025, 2026])], name="Vulns", default_color="#ff9f40")
chart = SVGChart(900, 450, margin_top=20, margin_bottom=30, theme="dark")
chart.plot_lines([phishing, creds, vuln])
chart.draw_legend([phishing, creds, vuln])
chart.save("examples/lines.svg")

phishing = Graph([DataPoint(v, name=n, color="#ff6384") for v, n in zip([100, 85, 45, 45], [2023, 2024, 2025, 2026])], name="Phishing", default_color="#ff6384")
creds = Graph([DataPoint(v, name=n, color="#36a2eb") for v, n in zip([100, 90, 55, 55], [2023, 2024, 2025, 2026])], name="Credentials", default_color="#36a2eb")
vuln = Graph([DataPoint(v, name=n, color="#ff9f40") for v, n in zip([100, 125, 125, 190], [2023, 2024, 2025, 2026])], name="Vulns", default_color="#ff9f40")
chart = SVGChart(900, 450, margin_top=20, margin_bottom=30, theme="dark")
chart.plot_grouped_bars([phishing, creds, vuln])
chart.draw_legend([phishing, creds, vuln])
chart.save("examples/grouped-bars.svg")

graph = Graph([DataPoint(v, name=n, color=c) for v, n, c in zip([9.77, 6.08, 5.56, 5.45, 5.29, 5.20, 5.08, 3.48, 3.40, 2.90], ["Health", "Finance", "Industry", "Tech", "Energy", "Pharma", "Services", "Retail", "Education", "Hospitality"], ["#ff4d4d", "#ff7a45", "#ff9f40", "#ffb347", "#ffc857", "#ffd166", "#ffe082", "#8bd17c", "#66c2a5", "#4bc0c0"])], name="Cost (M$)", default_color="#36a2eb")
chart = SVGChart(900, 550, margin_top=20, margin_bottom=30, margin_left=120, theme="dark")
chart.plot_horizontal_bars([graph])
chart.draw_pie_legend(graph)
chart.save("examples/horizontal-bars.svg")
Gallery
Pie chart
Radar chart
Line chart
Grouped bars
Horizontal bars
Links
License
Licensed under the GPL, version 3.
1 maintainer

Metadata
1 maintainer
Release files for PyBarePlot 0.0.4
For a detailed explanation of source distributions (sdists) and built distributions (wheels), please see the package formats documentation.
Source distribution (sdist)
| File | Size | Uploaded | |
|---|---|---|---|
| pybareplot-0.0.4.tar.gz | 39.5 kB | Details |
Release files / pybareplot-0.0.4.tar.gz
| Download URL | pybareplot-0.0.4.tar.gz |
|---|---|
| Size | 39.5 kB |
| Tags | Source |
|
SHA-256 checksum How to use checksums |
dff2c7d4de4bccbe6f9513577f1c38f250c7e95e700e848631850bfa37b74a2e
|
|
BLAKE2b-256 checksum How to use checksums |
6c6ff45e9f3093bec07df71250d482058b0d2112197d4a75c960da99a85a3fc0
|
| Upload date | |
|
Uploaded using Trusted Publishing? What is trusted publishing? |
No |
| Uploaded via |
twine/6.2.0 CPython/3.13.12
|














