IDW interpolation library for python
Project description
All in one IDW package for python
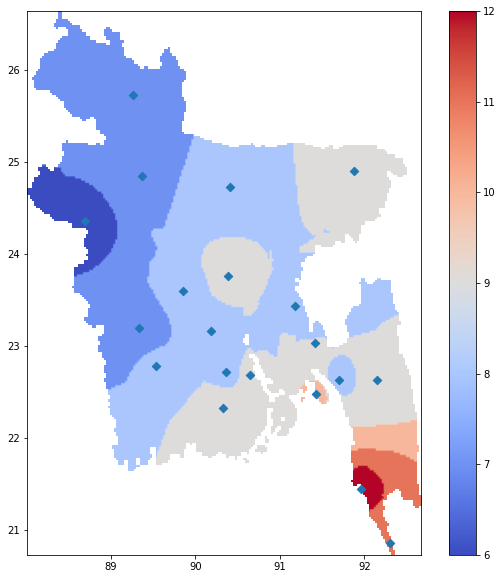
This is an example map created using pyidw library.
Features
- Simple IDW Interpolation.
- IDW with external raster (eg, elevation raster) covariable.
- Accuracy Score.
- Built in raster visualisation with coordinate and colour bar.
Why pyidw ?
Inverse distance weighted interpolation is one of the simplest geospatial interpolation method available in GIS. Although it is easy to produce an idw raster using conventional desktop GIS software (eg. ArcGIS, QGIS). It was never straightforward to create such a beautiful map image using python. This is why I have created the pyidw library where you can create beautiful idw maps of your desired location using your favourite programming language 🐍
pyidw package also incorporates a clever technique to use additional raster data as a covariable using polynomial regression. For example, if you are working with temperature data, it is widely known that temperature is inversely proportional to elevation, the higher the elevation, the lower the temperature is. With pyidw, you can easily add elevation data with traditional idw calculation to obtain a different result.
Installation
pyidw library can be installed using simple pip install pyidw command. However, if you are facing trouble installing pyidw on your windows machine, please try the commands below on the windows command line.
pip install wheel
pip install pipwin
pipwin refresh
pipwin install numpy
pipwin install pandas
pipwin install shapely
pipwin install gdal
pipwin install fiona
pipwin install pyproj
pipwin install six
pipwin install rtree
pipwin install geopandas
pipwin install rasterio
pip install pyidw
pipwin refresh
Example
If you are convinced enough to give pyidw a try, here is a simple tutorial for you. You should first download the pyidw_example.zip file. This zip file contains four files,
- pyidw_tutorial.ipynb
- Bangladesh_Temperature.shp
- Bangladesh_Border.shp
- Bangladesh_Elevation.tif
The pyidw_tutorial.ipynb file is a jupyter notebook file of this example tutorial, which you could try to run and then modify with your own data. The Bangladesh_Temperature.shp file is an ESRI point shapefile that contains maximum and minimum temperature values for 34 weather stations all over Bangladesh. Its attribute table looks something like this.
| Station_Name | Station_ID | Latitude | Longitude | Max_Temp | Min_Temp |
|---|---|---|---|---|---|
| BARISAL | BGM00041950 | 22.75 | 90.37 | 36.75 | 9.60 |
| BHOLA | 41951099999 | 22.68 | 90.65 | 35.62 | 10.19 |
| BOGRA | BGM00041883 | 24.85 | 89.37 | 38.62 | 8.29 |
| CHANDPUR | 41941099999 | 23.27 | 90.70 | 35.87 | 11.28 |
| CHITTAGONG | BGM00041978 | 22.25 | 91.81 | 36.92 | 11.24 |
| CHUADANGA | 41926099999 | 23.65 | 88.82 | 37.84 | 8.59 |
| COMILLA | 41933099999 | 23.43 | 91.18 | 35.41 | 10.35 |
| COXS BAZAR | BGM00041992 | 21.45 | 91.96 | 37.11 | 11.51 |
For those who are not familiar with shapefile, every shapefile consists of seven different files with the same name but seven different file extensions. Namely .cpg .dbf .prj .sbn .sbx .shp and .shx. If any of these files are missing then the shapefile system won't work properly. Note that Max_Temp and Min_Temp column in Bangladesh_Temperature.shp files attribute table, we will use one of these columns later when creating IDW interpolated maps.
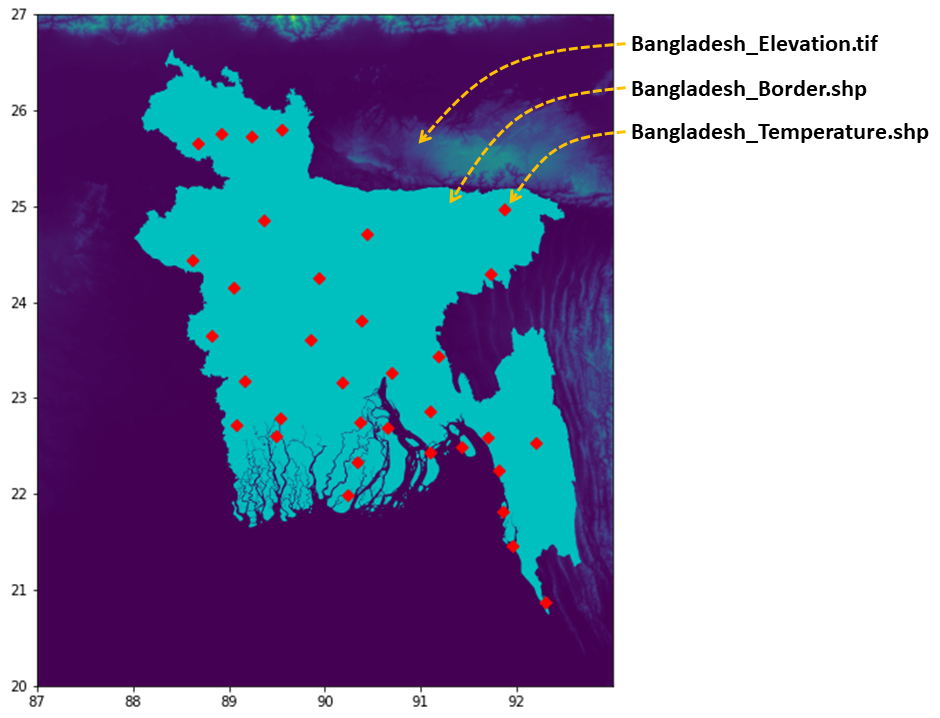
The Bangladesh_Border.shp is an ESRI polygon shapefile that covers all the areas of the country Bangladesh. We will use this shapefile to define the calculation extent for IDW interpolation. And finally, the Bangladesh_Elevation.tif file which is a raster file containing elevation information in meter, We don't need this file for standard IDW interpolation but with regression_idw, we will use this file as an external covariable. All the files and their spatial dimension is shown below.
idw_interpolation()
Now the fun part begins. Write these few line of code from below in any python interpreter while you are on pyidw_example directory.
from pyidw import idw

idw.idw_interpolation(
    input_point_shapefile="Bangladesh_Temperature.shp",
    extent_shapefile="Bangladesh_Border.shp",
    column_name="Max_Temp",
    power=2,
    search_radious=4,
    output_resolution=250,
)
It will take a few second to complete, then a map image like below will be shown. And a new file will be created namely Bangladesh_Temperature_idw.tif, this is the saved raster file of interpolated map. This file is named after input_point_shapefile name with _idw.tif suffix. idw_interpolation() function take six parameters.
- The first parameter input_point_shapefile= take an ESRI point shapefile which should contain the particular data value we are interseted to create an interpolation map. Also there shouldn't any value outside of our given extent_shapefile area.
- The second parameter extent_shapefile= take an ESRI polygon shapefile, this shapefile is used for defining the calculation and mapping boundary. The coordinate system of extent_shapefile should be same as input_point_shapefile.
- The third parameter column_name= take the column name of particular field as a string. This is the value upon which IDW map will be created.
- The fourth parameter power= is an optional parameter with default value of 2, this is the power parameter from idw equation.
- The fifth parameter search_radious= is also an optional parameter with default value of 4, it determines how many nearest points will be used for idw calculation.
- The sixth parameter output_resolution= is also optional with default value of 250. This parameter define the maximum height or width (which one is higher) of reasulting _idw.tif file in pixel.
Output map from idw_interpolation() function.
accuracy_standard_idw()
If you are interested
from pyidw import idw
from sklearn.metrics import mean_squared_error

original_value, interpolated_value = idw.accuracy_standard_idw(
    input_point_shapefile="Bangladesh_Temperature.shp",
    extent_shapefile="Bangladesh_Border.shp",
    column_name="Max_Temp",
    power=2,
    search_radious=6,
    output_resolution=250,
)

print("RMSE:", mean_squared_error(original_value, interpolated_value, squared=False))
Output:
RMSE: 1.401379
If you have any questions or problems, feel free to contact me at: yahyatamim0@gmail.com
Project details
Release history Release notifications | RSS feed
Download files
Download the file for your platform. If you're not sure which to choose, learn more about installing packages.


