Meteorology utilities, SkewT plotting and more

Project description
pyMeteo

General meteorological routines, skew-T/log-p plotting and working with CM1 model data.
Online documentation available at http://cwebster2.github.io/pyMeteo/
Getting pyMeteo
The easiest way to get pymeteo is via pip
pip install pymeteo
or via anaconda
conda install -c cwebster2 pymeteo
pyMeteo is developed with python 3.7 and should work with any version of python 3 but may not work with python 2. Open an issue or send me a pull request if you want to make python 2 work but make sure any submissions do not regress against python 3.
You can obtain the most recent development version of pymeteo by cloing this repository.
git clone https://github.com/cwebster2/pyMeteo.git
cd pyMeteo
python3 setup.py install
Inlcuded scripts
cm1_geninit -- visualize analytical skewt and hodograph and write sounding file suitable for CM1 or WRF
plot-acars -- visualize aircraft sounding data, updated hourly.
[TOC]
CM1 / WRF intput sounding generation
The utility:
$ cm1_geninit
allows the previwing of analytic soundings and hodographs and writing to files suitable for initializing the CM1 or WRF weather models. The code is extensible and adding your own analytic profiles should be straightforward. Future documentation will detail this and I welcome pull requests!
#Skew-T / Ln-P diagrams
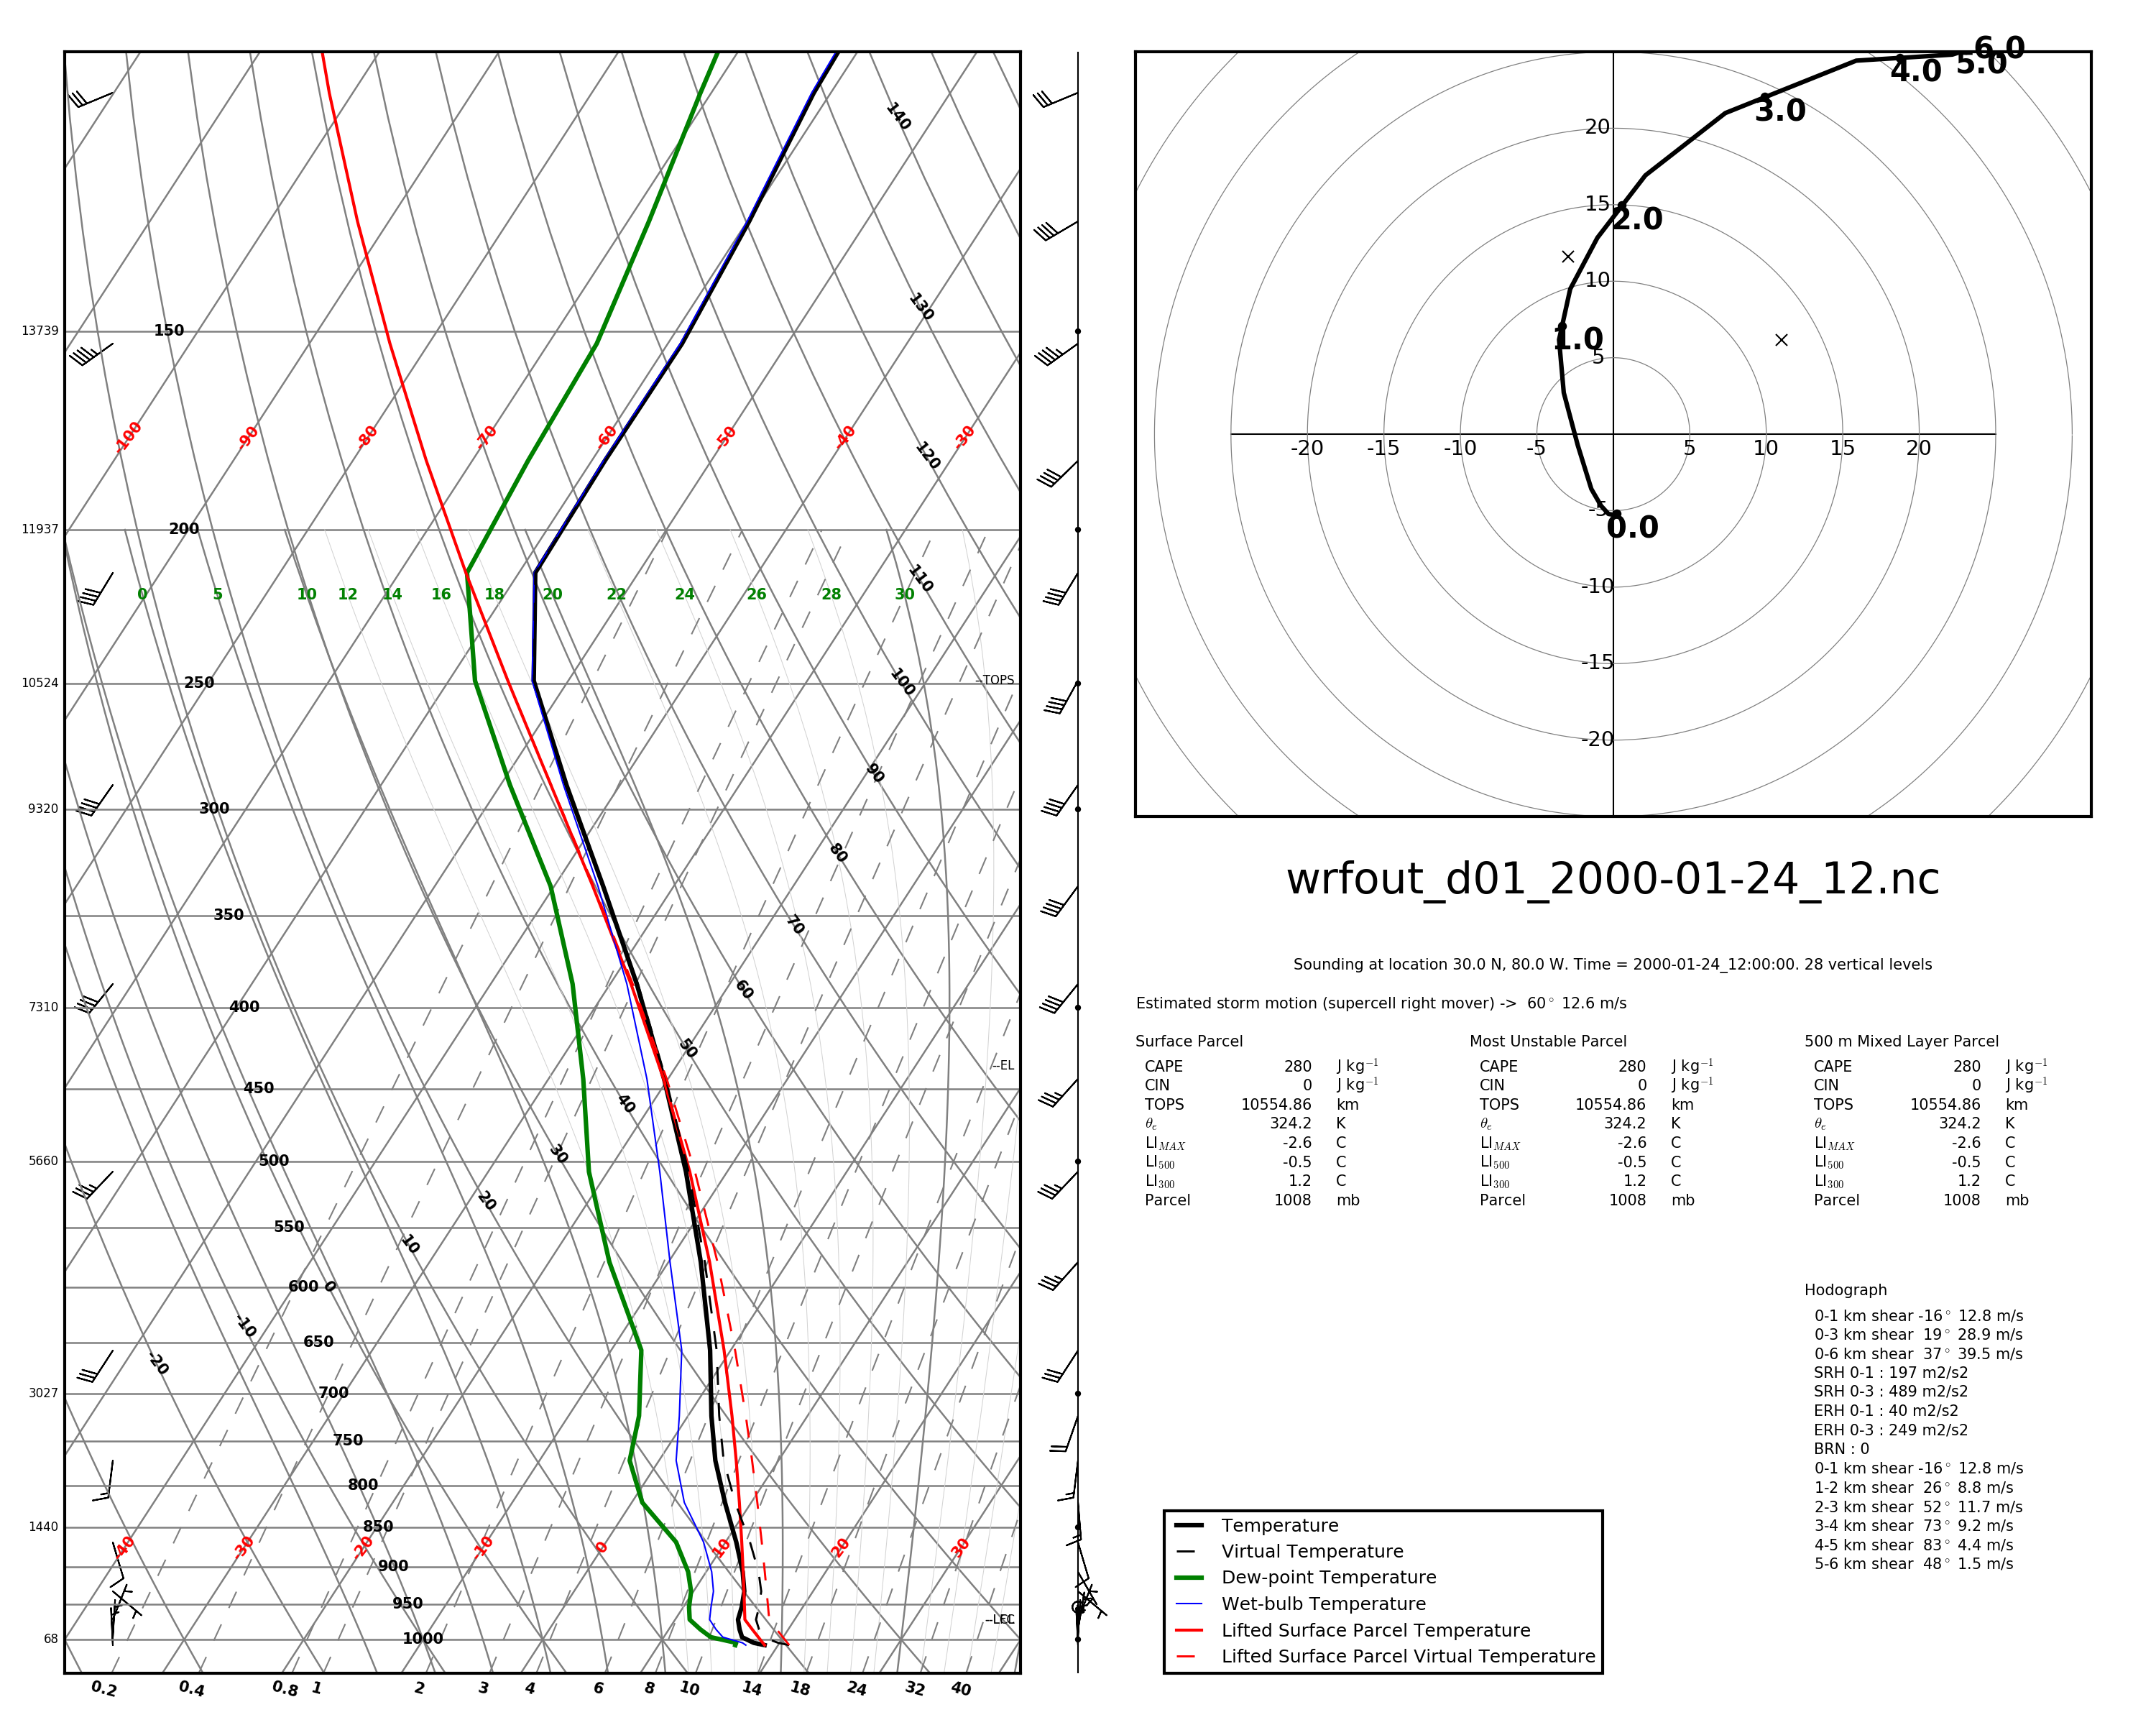
Skew-T / Ln-P plots are simply 2-D plots with a skewed temperature axis and a logarithmic pressure axes (y). Data plotted on this style of plot include temperature, dew point, and various other derived values such as the temperature of a parcel lifted from the surface. The plots produced by these scripts also have a hodograph plotted and a data block with convective storm parameters.
Example plot
Plotting from data
In all of the plotting methods, the plot output type is determined by the extension of the output file provided. You can write any type of file that the matplotlib backend can write.
Tabular
If you have tabular data suitable for WRF or CM1 model initialization, you can plot a skewt of this data with:
$ skewt tabular -f sounding.dat skewt.pdf
The format of the sounding data file is
1 line header that contains: surface pressure (mb) surface theta (K) surface qv (g/kg)
following lines are: height (m) theta (K) qv (g/kg) u (m/s) v (m/s)
See the file testdata/sounding_wrfinit.dat for an example of this file format.
CM1
For CM1 output in native GrADS format, you can plot a skewt from model output with
$ skewt cm1 -p . -d cm1out -x 0 -y 0 skewt-cm1.pdf
In this case, -p is the path to the dataset, -d is the CM1 output_basename, -x and -y are the location of the plot in km and -o is the file to output. The current version (v0.4) of this script only works for CM1 datasets that are output with one file per timestep and will plot whatever timestep the file contains.
CM1 / HDF5
For CM1 output in HDF5 format, you can plot a skewt from model output with:
$ skewt cm1hdf -f model-data.h5 -x 0 -y 0 output.pdf
This currently requires that HDF5 output be un-tiled (though it might work for tiled files, I have not checked). The options are as in the CM1 GrADS version except that there is no -p and -f references a specific HDF5 file. This also assumes one file per timestep and will plot whatever timestep the file contains.
WRF
For WRF output in NetCDF format, you can plot a skewt from model output with:
$ skewt wrf -f wrfou.nc --lat 30 --lon -80 -t 0 skewt.pdf
In this case, -f references a WRF output file, --lat and --lon reference a location within the WRF domain, -t reference a timestep within the WRF output and -o specifies an output files.
University of Wyoming sounding data
From a file:
$ skewt uwyo -f uwyo-data.dat skewt.pdf
From the website for the most recent sounding from a station:
$ skewt uwyoweb --station 72251 skewt.pdf
From Numpy arrays
import numpy as np
import pymeteo.skewt as skewt

# prepare 1D arrays height (z), pressure (p), potential temperature (th),
# water vapor mixing ratio (qv), winds (u and v) all of the same length.

skewt.plot(None, z, th, p, qv, u, v, 'output,pdf')
You can also choose to plot just the sounding, just the hodograph or plot each on on axes that you define. For details see the implementation of pymeteo.skewt.plot() and the pyMeteo documentation.
Release history Release notifications | RSS feed


Download files
Download the file for your platform. If you're not sure which to choose, learn more about installing packages.
Source Distribution
Built Distribution
Filter files by name, interpreter, ABI, and platform.
If you're not sure about the file name format, learn more about wheel file names.
Copy a direct link to the current filters
File details
Details for the file pymeteo-1.1.0.tar.gz.
File metadata
- Download URL: pymeteo-1.1.0.tar.gz
- Upload date:
- Size: 96.0 kB
- Tags: Source
- Uploaded using Trusted Publishing? No
- Uploaded via: twine/6.1.0 CPython/3.13.7
File hashes
| Algorithm | Hash digest | |
|---|---|---|
| SHA256 |
5046740bcfef821d4b5b7be59280047c22b746432c547dc73b32ca096c46a134
|
|
| MD5 |
efeaeadc10df81abb88189bcdcbd2b47
|
|
| BLAKE2b-256 |
587b4fd6a44435065fa9897a8b5de6e2292c6fab6a832466ee4ab396c7687613
|
File details
Details for the file pymeteo-1.1.0-py3-none-any.whl.
File metadata
- Download URL: pymeteo-1.1.0-py3-none-any.whl
- Upload date:
- Size: 97.8 kB
- Tags: Python 3
- Uploaded using Trusted Publishing? No
- Uploaded via: twine/6.1.0 CPython/3.13.7
File hashes
| Algorithm | Hash digest | |
|---|---|---|
| SHA256 |
69b9e4f6442a644e869c0cd7b482e571e4b58b1e8115efd8ab402fd07fda184c
|
|
| MD5 |
d4e385ae41f7c0a80a934c4a317221d7
|
|
| BLAKE2b-256 |
774c7948e0b75a3b9498d75154e913d61c42deff7a730ccca3427be2c1b3272f
|


