
pyTable


pyTable is the library to plot table easily!
(on matplotlib)
installation
$ pip install pytab
How to use?
Example / table_0.py
You can plot a table easily by giving data as a dict object as below.
import pytab as pt


if __name__ == '__main__':
    data = {
        'a': [1.0, 2.1, 3.5, '-', 2.0, 1.0, 2.1, 3.5, 4.0, 2.0, ],
        'b': [5.7, 6.1, 7.2, 8.3, 1.2, 5.7, 6.1, 7.2, 8.3, '-', ],
        }

    # The simplest table
    pt.table(data=data)

    pt.show()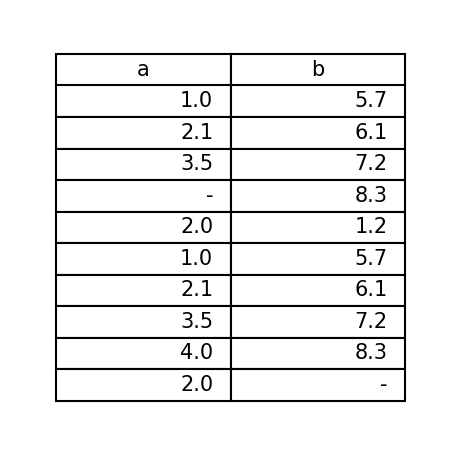
table0
Example / table_1.py
And, you can design a table easily.
import pytab as pt


if __name__ == '__main__':
    data = {
        'a': [1.0, 2.1, 3.5, 4.0, 2.0, 1.0, 2.1, 3.5, 4.0, 2.0, ],
        'b': [5.7, 6.1, 7.2, 8.3, 1.2, 5.7, 6.1, 7.2, 8.3, 1.2, ],
        }

    rows = [str(i) for i in range(len(data['a']))]

    pt.table(data=data,
             rows=rows,  # set numbers as row
             th_c='#aaaaee',  # set table header background-color
             td_c='gray',     # set table data (rows) background-color
             table_type='striped',  # set table type as 'striped'
             )

    pt.show()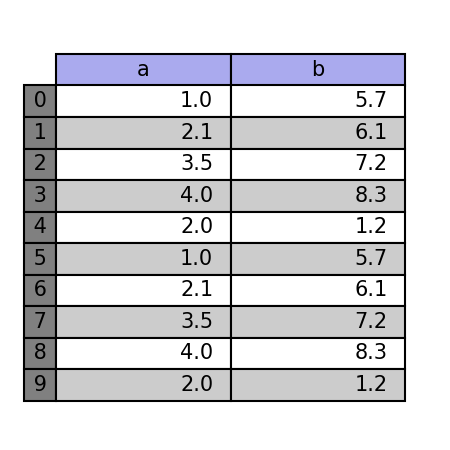
table1
Documentation
[jp] pyTable ドキュメント
LICENSE
MIT
Copyright (c) 2020 HiroshiARAKI All Rights Reserved.
1 maintainer

Metadata
1 maintainer
Release files for pytab 1.0.4
For a detailed explanation of source distributions (sdists) and built distributions (wheels), please see the package formats documentation.
Source distribution (sdist)
| File | Size | Uploaded | |
|---|---|---|---|
| pytab-1.0.4.tar.gz | 5.1 kB | Details |
Release files / pytab-1.0.4.tar.gz
| Download URL | pytab-1.0.4.tar.gz |
|---|---|
| Size | 5.1 kB |
| Tags | Source |
|
SHA-256 checksum How to use checksums |
a9585cc47e1f5454fb644c28ae79ef219caa476207a90f87917e8de68a5d12a0
|
|
BLAKE2b-256 checksum How to use checksums |
586a8af7e7b7f904a279300f98a7ad3a1471ea52dbd2d5a5a1ceb6e99bba2c45
|
| Upload date | |
|
Uploaded using Trusted Publishing? What is trusted publishing? |
No |
| Uploaded via |
Python-urllib/3.8
|














