a lovable data analysis and algorithmic trading library for cryptocurrencies,including tools for deploying and analyzing any strategy

Project description

Pycoin
a lovable data analysis and algorithmic trading library for cryptocurrencies :moneybag:
including tools for deploying any strategy including pattern based strategies, Price Action strategies, Indicator based strategies and also Machine learning based strategies. able to run multi strategy instances on a single bot as a webapp and a lot more...
what can this package do:
- download market historical data for all symbols from almost all exchanges thanks to ccxt :chart_with_upwards_trend:
- visualizing capabilities to easily analyze market using plotly :chart_with_downwards_trend:
- able to perform some useful analysis such as finding market trend according to market past high and lows, finding market important levels (like support and resistance) and more :bar_chart:
- able to define your strategy, backtest it, run it in dry run mode and also in real mode :mag: (soon)
- using telegram bot and webapp to control and monitor your bot :robot: (soon)
- run multiple strategy instances for each user as a single bot. (soon)
[!NOTE] for usage examples please checkout examples folder and open provided notebooks.
Installation
via cloning (recommended)
pip install -e git+https://github.com/hadif1999/pycoin.git#egg="pythoncoin"
if you need extra dependencies such as ploting or AI packages add [extra](name of extra dependency that will be mentioned below) to end of "pythoncoin" (keep using quotes)
example of installing plotting and jupyter dependencies:
pip install -e git+https://github.com/hadif1999/pycoin.git#egg="pythoncoin[jupyter,plot]"
please be careful not to use spaces between extra packages list
available extra packages:
- plot: installs packages related to plotting.
- jupyter: installs packages related to using in jupyter notebook.
- ai: installs packages related to using AI features.
- hdf5: installs packages related to big data features.
- all: installs all available dependencies.
installing from PyPI
standard dependencies
!pip install pythoncoin
installation with extra dependencies
!pip install pythoncoin[plot]
as mentioned earlier you can also use ai, plot, jupyter, hdf5 or all to install needed extra dependencies.
Quick start
after installation you can run below code to download market historical data:
from pycoin.data_gathering import KlineData_Fetcher
import datetime as dt

df = KlineData_Fetcher(symbol="BTC/USDT",
                       timeframe="4h",
                       data_exchange="binance",
                       since = dt.datetime(2020, 1, 1)
                       )
ploting the candlestick data
from pycoin.plotting import Market_Plotter
plots = Market_Plotter(OHLCV_df=df)
# if plot_by_grp is False then it will plot the whole candlestick data
figure = plots.plot_market()
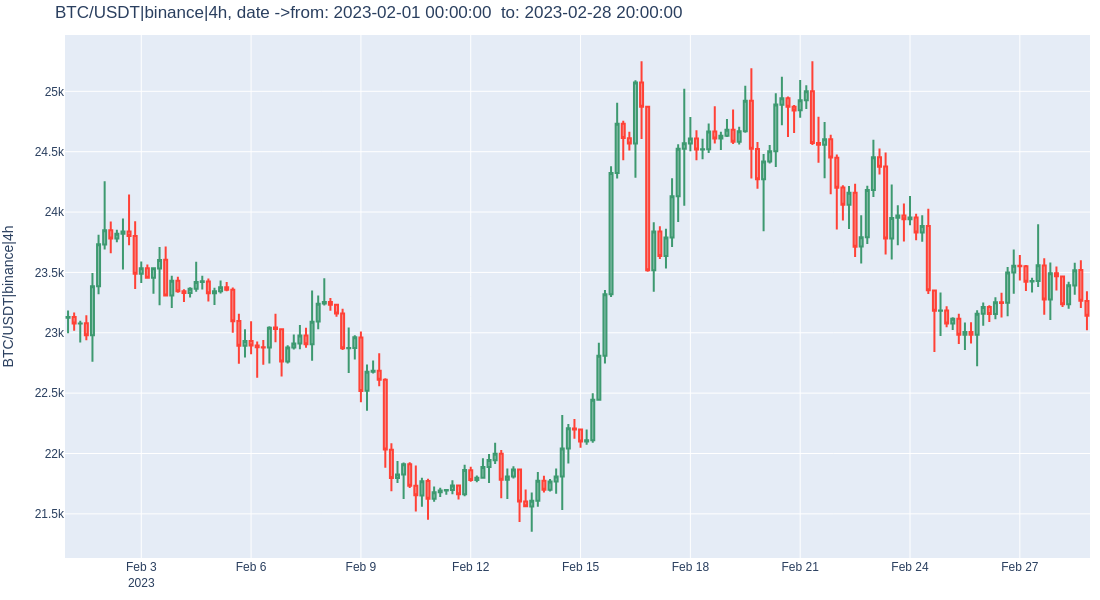
# if plot_by_grp is True you can plot candlestick data by group and plot a specific year, month,etc.
figure = plots.plot_market(plot_by_grp=True, grp={"year":2023, "month":2})
figure.show()
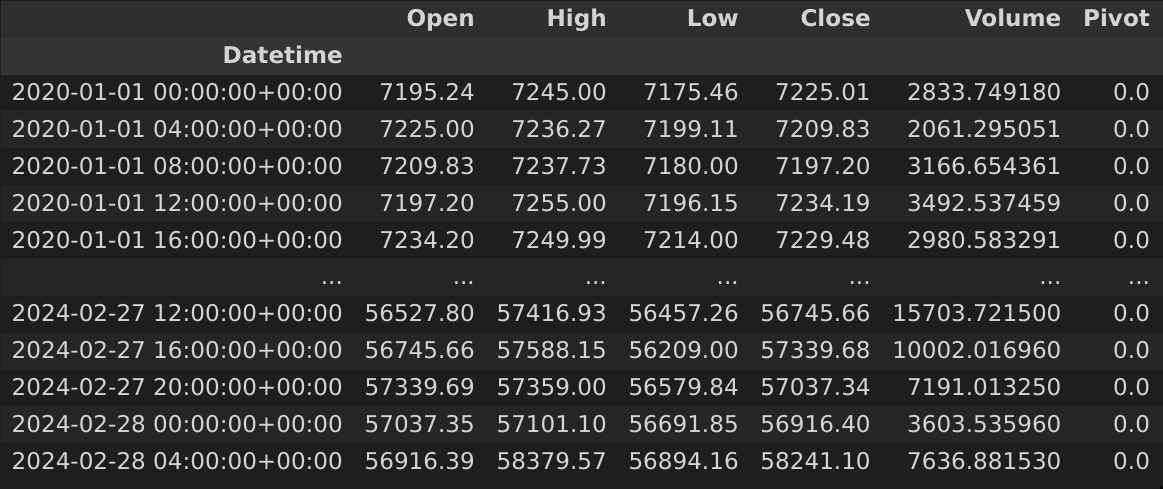
evaluating market high & lows
from pycoin.data_gathering import get_market_High_Lows
df = get_market_High_Lows(df, candle_range = 100)
df
candle_range : range of candles to look for high and lows
ploting market high and lows
plots.plot_high_lows(df, R = 800, y_scale= 0.5)
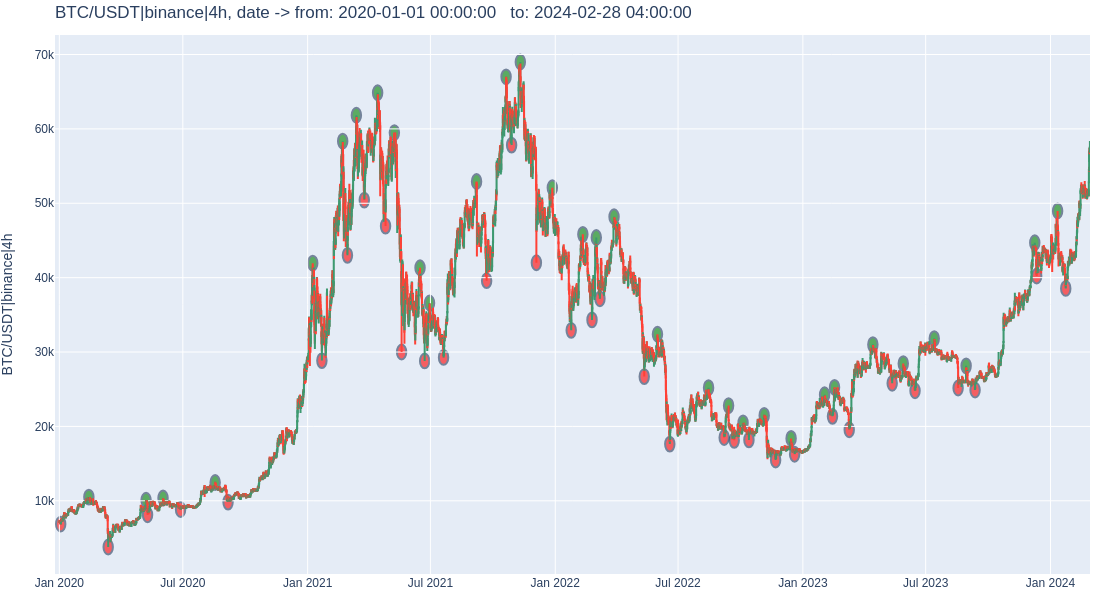
the method above puts a circle for each high and low. R is the radius and y_scale can scale the price in y axis for better visualizing.
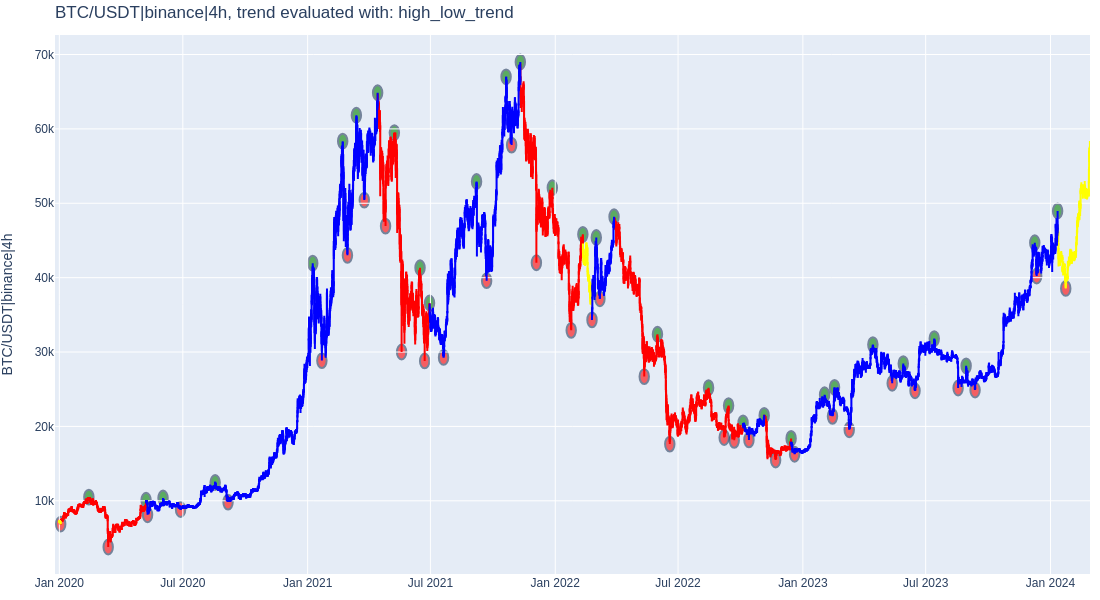
evaluate market trend with high and lows
every trend that is found with any method such as high & lows, SMA,etc. adds a new column that holds the trend label for each row of data, and when you want to plot these trend you should give this column name to draw_trend_highlight method.
# finding trend
from pycoin.data_gathering import Trend_Evaluator
df = Trend_Evaluator.eval_trend_with_high_lows(df, HighLow_range=100)

# ploting trend
plots.draw_trend_highlight("high_low_trend", df,
                           add_high_lows_shapes = True,
                           R = 10000, # circle size of high and lows
                           y_scale = 0.1 # scales y dim of circles
                           )
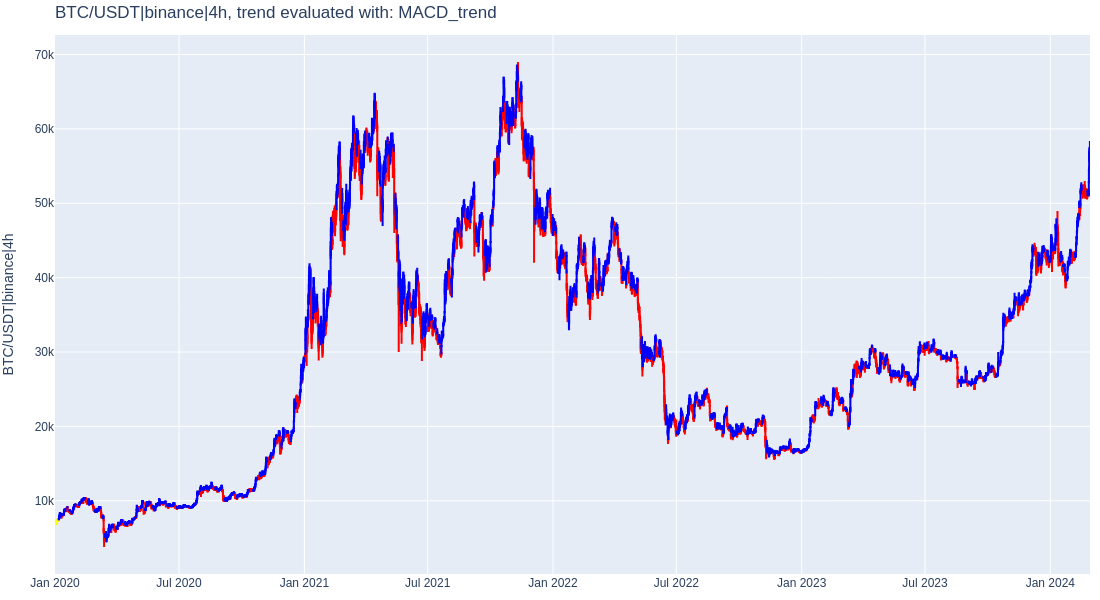
evaluate trend using MACD + Signal
df = Trend_Evaluator.eval_trend_with_MACD(df, drop_MACD_col = True)
plots.draw_trend_highlight("MACD_trend", df)


Download files
Download the file for your platform. If you're not sure which to choose, learn more about installing packages.


