
reeltime
A deterministic record/replay debugger for LLM agents. Record a run once,
then replay it offline, instantly, for free — and see the exact bytes the model
received. Or run tape doctor and find out what makes your agent
irreproducible in the first place, without recording anything.




The same session as text
$ tape run python truncation_bug.py
Q1: is report_00.pdf there?  -> Yes — report_00.pdf is in the listing.
Q2: is invoice.pdf there?    -> No, invoice.pdf is not in the listing.

Q2 is wrong: invoice.pdf IS in the listing.
Run:  tape show last 1 --context --diff 0

note: mock provider, 2 events -- little latency to skip, so replay saves ~1s here.
      examples/m3_replay_speed.py measures ~60x on an 8-turn agent at 400ms/call.

✓ recorded 2 events → .tape/runs/01M0B3V68D0THT474YMFV0R2SQ.jsonl  (1.5s, <$0.0001)

$ tape replay
Q1: is report_00.pdf there?  -> Yes — report_00.pdf is in the listing.
Q2: is invoice.pdf there?    -> No, invoice.pdf is not in the listing.

✓ replayed 2 events in 0.72s  ($0.00)  [2× faster than the recorded run]
  wall clock 0.86s including startup; the recorded run took 1.51s

$ tape show last 1 --context --diff 0
context diff · event 0 → event 1 · gpt-4o-mini
  3 messages, 866 chars  →  3 messages, 353 chars   (+0 messages, -513 chars)

  = [0] system     unchanged · 43 chars
  ~ [1] user       CHANGED · 791 → 280 chars (-511, TRUNCATED (kept the first 280 chars))
        -  report_10.pdf  (50 KB)
        -  report_11.pdf  (51 KB)
        -  report_12.pdf  (52 KB)
        -  report_13.pdf  (53 KB)
        ⋯ 16 more diff lines ⋯
        -  invoice.pdf  (70 KB)
        +  report_10

  ~ [2] user       CHANGED · 32 → 30 chars (-2)
        -Is report_00.pdf in the listing?
        +Is invoice.pdf in the listing?

2 changed · 1 unchanged
The model was never wrong. invoice.pdf had been truncated out of its context
one line before the question that asked about it.
(That demo runs against an embedded mock, so it has almost no latency to skip and replay only saves about a second. The ~60× figure below is measured on a realistic agent paying 400 ms per call.)
The same bug in the viewer — tape ui, local, keyboard-first, no accounts:
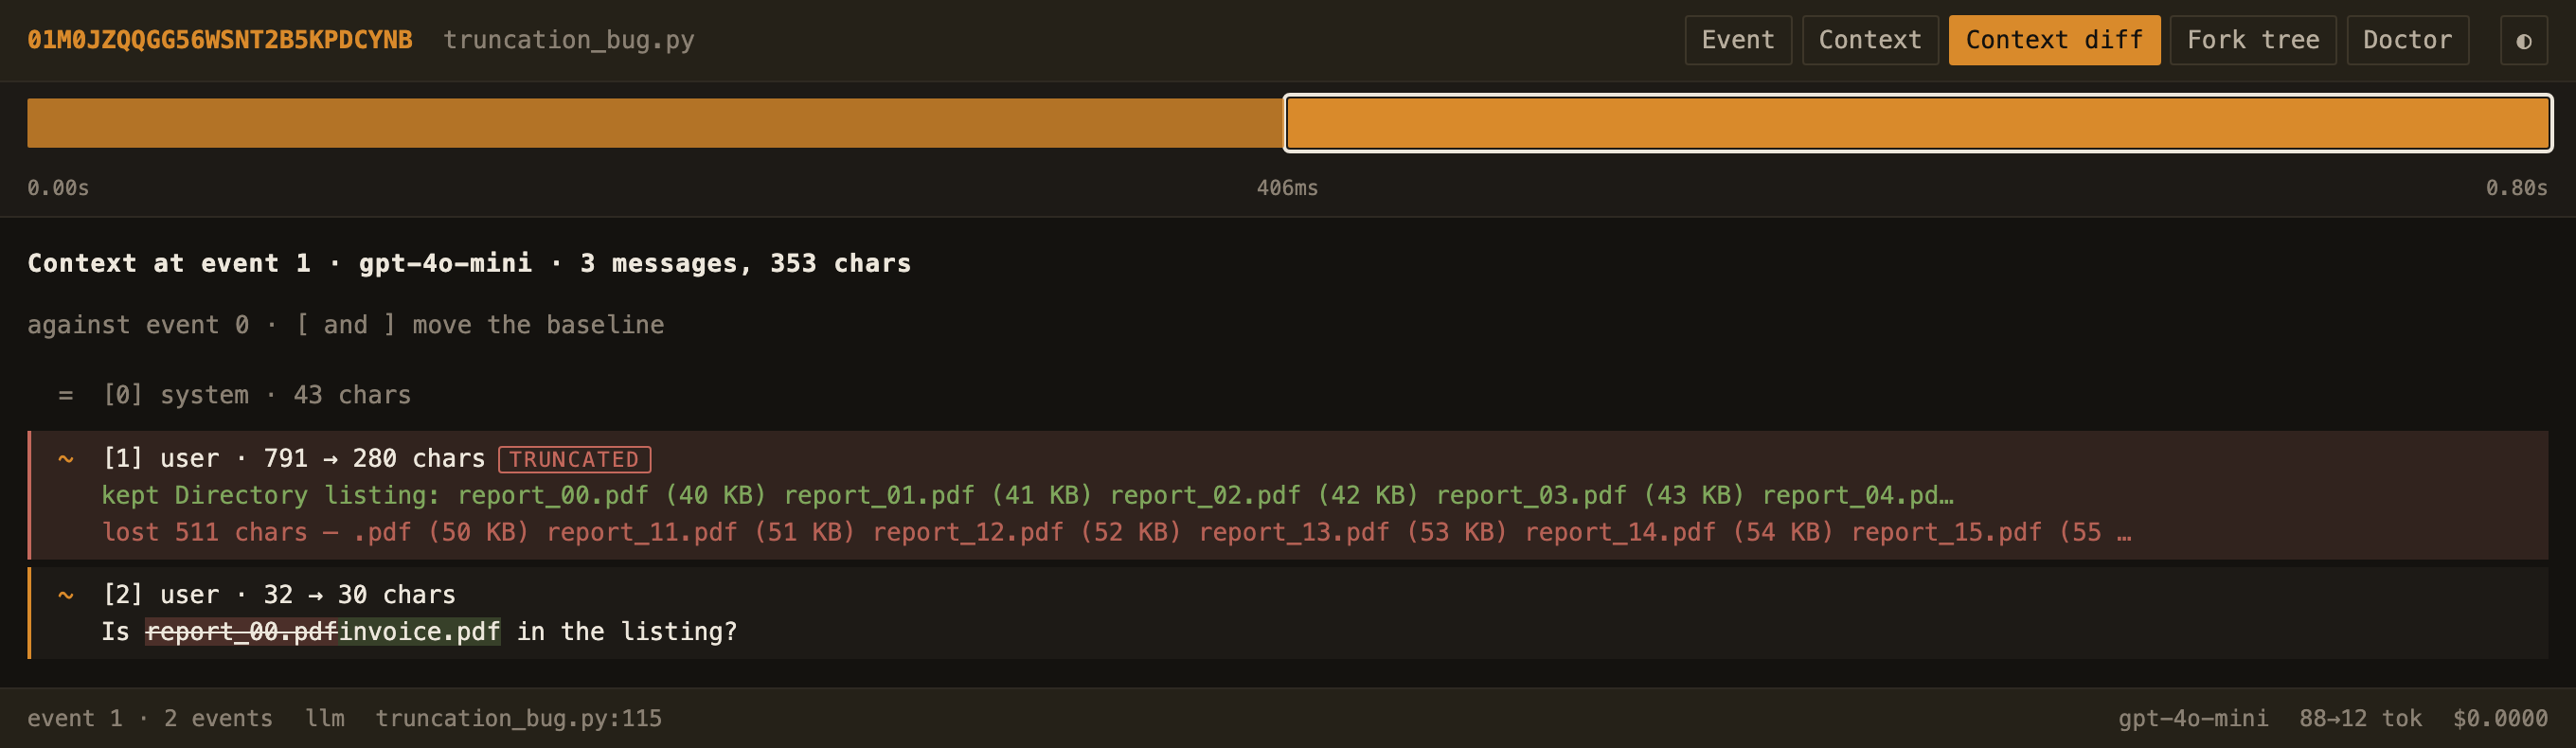
A message that survived but lost most of itself gets its own gutter, with the kept prefix and the dropped tail as separate blocks — an inline diff of "the last 511 characters vanished" is unreadable. Nothing else renders this, because nothing else records it. More on the viewer.
Start here: what is actually nondeterministic about your agent?
You do not need a trace, a replay, or any change to your code to get value out of this. One command runs your agent twice and tells you which boundaries disagreed, on which lines, and what to do about each one:
$ tape doctor python agent.py
~ 3 nondeterminism sources found

  agent.py:88   llm               1 of 1 completion differed (gpt-4o-mini, temperature 0.7)
                                  I will delete b.txt → Let me remove b.txt
  tools.py:12   http              1 of 1 response differed
                                  {"temp": 12} → {"temp": 15}
  agent.py:34   time·datetime.now 1 of 1 read differed
                                  2026-08-18T10:00:01 → 2026-08-18T10:04:55

suggestions:
  llm: set temperature=0 for the closest thing to a reproducible run — though
       most providers still do not promise identical completions, which is the
       reason replay exists
  http: an upstream response changed between runs; stub it or pin the version
        if the agent's behaviour depends on it
  time·datetime.now: inject a clock instead of calling time.time() or
                     datetime.now() in the agent, so a test can hold it still
--fail-on-findings exits 1 when anything is found, so the same command is a
CI gate: this agent is reproducible, and here is the check that says so.
Full details below.
That is the standalone half. The rest of this page is what you get once you start recording.
The problem
Your agent failed at step 14. You re-ran it, and now it fails at step 11. Nothing you can reproduce, so nothing you can fix — only re-roll and hope.
What this does about it
tape doctormeasures your agent's nondeterminism instead of guessing at it, naming each source with the line of your code that produced it. It needs no traces and no replay, and--fail-on-findingsturns it into a CI gate. See above.- Replay is instant, offline, and free. $0.00 and zero network calls — 16 events replay in ~50 ms, which is ~60× faster than the same agent paying 400 ms per call (the benchmark), and the ratio is however much latency you were paying. That is what makes stepping and scrubbing possible at all.
- Streaming is recorded and replayed chunk by chunk, boundaries byte-exact,
with
--realtimeto reinstate the recorded gaps. Every other tool in this space refuses streaming outright. --contextshows the full message array the model received, collapsed where it is long, and diffs it between two calls so an injection or a truncation is impossible to miss. Most agent bugs are context bugs, and nothing else surfaces the exact bytes.- MCP sessions are recorded as MCP, with server, tool, and arguments as fields — tool discovery included, so a server that changed what it offers shows up as a tool set change rather than as a mystery divergence. Replay never starts the server. Nothing else records MCP at all.
- LangChain agents record their graph, not just their POSTs. Chains, tools,
retrievers and agent steps become
chainevents carrying node identity, path, depth and fan-out — so a run that took a different route through the graph reports that, instead of two message arrays differing somewhere. Works for LangGraph andcreate_agenttoo, andtape run --langchainneeds no edit to your script. - Fork a run from any step, with the fix applied.
tape fork <run> --at 13 --patch 'llm.system+="Ask first."'replays the first 13 events — free and identical — then goes live from there. Testing a prompt change costs one step instead of a whole run, and the fork is itself a complete trace, so it replays and forks again. tape diff <a> <b>finds where two runs stopped being the same run. It aligns them by event signature rather than by text, so the headline is the divergence point and what each run did alone afterwards. For LLM steps it reaches into the context, and a changed system prompt shows as the two lines that changed.
Install
pip install reeltime
Nothing is required at runtime: the core is standard library only. httpx,
httpx2, requests and urllib3 are patched if you have them — the last of
those is what puts boto3/Bedrock on tape, since botocore is built on it.
Quickstart
Record a script you have not modified at all:
tape run python agent.py     # records; your code is untouched
tape ls                      # what you have recorded
tape replay <run>            # re-run it offline, free
tape show <run> 14 --context # what the model actually read at step 14
tape doctor python agent.py  # why is this run not reproducible?
tape ui <run>                # scrub it in a local viewer

tape run --langchain python agent.py   # LangChain/LangGraph structure too
tape run needs no import in your code — it injects a sitecustomize on
PYTHONPATH, so recording starts before your agent imports anything.
To scope recording yourself instead:
import reeltime as tape

@tape.tool                                  # local tools become boundaries
def read_file(path: str) -> str:
    return open(path).read()

with tape.session() as run:
    with tape.span("plan"):                 # groups events; replays order-free
        notes = read_file("notes.md")
        client.chat.completions.create(...) # recorded, with tokens and cost

print(run.summary.line())
How it works
An agent is deterministic except at four boundaries. Record what crosses them and everything in between replays exactly.
┌──────────────── your agent, unmodified ────────────────┐
│                                                        │
│   ① LLM calls          ─────┐                          │
│   ② tool / network     ─────┤                          │
│   ③ random / uuid      ─────┤──►  Recorder ──► trace   │
│   ④ clock reads        ─────┘                          │
│                                                        │
└────────────────────────────────────────────────────────┘
Nothing else in the process can differ between two runs. That is the whole trick, and it is why replay costs nothing: there is no model to call, because every answer is already on the tape.
The context view
$ tape show 01M0AX2W 0 --context
event 0 · llm · gpt-4o-mini · examples/truncation_bug.py:97 (main.<locals>.ask)
3 messages · 866 chars of context · 216 in / 12 out tokens · <$0.0001
temperature 0

── [0] system · 43 chars ─────────────────────────────────────────────────────
  Answer only from the listing you are given.

── [1] user · 791 chars ──────────────────────────────────────────────────────
  Directory listing:
    report_00.pdf  (40 KB)
    report_01.pdf  (41 KB)
    report_02.pdf  (42 KB)
    report_03.pdf  (43 KB)
    report_04.pdf  (44 KB)
    report_05.pdf  (45 KB)
  ⋯ elided 550 chars · lines 8-29 of 32 ⋯
    report_28.pdf  (68 KB)
    report_29.pdf  (69 KB)
    invoice.pdf  (70 KB)

── [2] user · 32 chars ───────────────────────────────────────────────────────
  Is report_00.pdf in the listing?

── completion ────────────────────────────────────────────────────────────────
  Yes — report_00.pdf is in the listing.
Long messages collapse from the middle, keeping head and tail, because the
end of a long message is where a truncation shows itself. The marker states
both how many characters were elided and which lines. --full prints
everything.
--context --diff M aligns the two message arrays with a sequence-alignment
pass, so a message injected at the front does not report everything after it as
changed, and labels each difference INJECTED, DROPPED, CHANGED, or
TRUNCATED. Anthropic's top-level system field is hoisted to position 0 —
it is part of what the model read, and it is the field people most often get
wrong.
Replay
tape replay <run>              # re-run the recorded command against the tape
tape replay <run> --to 14      # stop after event 14
tape replay <run> --step       # pause before each event
tape replay <run> --strict     # only exact matches
tape replay <run> --loose      # also match on content hash alone
tape replay <run> --realtime   # re-emit stream chunks with their recorded gaps
A replayed @tape.tool never executes its body, which is what makes replaying
an agent that deletes files or charges cards safe. Recorded exceptions are
raised again — HTTP and tool alike — because a replay in which a failed call
now succeeds is a replay of a different run.
The three-tier matcher
Index matching breaks the moment you edit your code. Content-hash matching breaks the moment you change a prompt by one character — which is exactly the edit you make while debugging. So identity and content are kept separate:
| Tier | Rule | Result |
|---|---|---|
| 1 | same call site, same sequence number there, same content hash | silent |
| 2 | the line moved (enclosing function still matches), or the content differs | matched, reported as drift |
| 3 | call site gone entirely, content hash matches an unconsumed event | matched, warned |
--strict accepts tier 1, the default accepts 1–2, --loose accepts all three.
Tier 2 is the one that matters: it is what lets you tweak a prompt, replay
anyway, and watch what changes downstream.
Nothing ever falls through to a live call. When a call cannot be matched, replay stops and says why each nearby recording was rejected:
no recorded tool event matches this call

  at        agent.py:91  (in Planner.step)
  span      root/plan
  sent      {"args":{"path":"b.txt"},"name":"delete_file"}

  nearest unconsumed events, and why each was rejected:
    #14   tool  agent.py:88                same call site, content differs — would match without --strict
    #22   tool  tools.py:12                same kind and span, different call site

  matching is 'strict'. Drop --strict to allow drifted content, or re-record.
Every drifted or fuzzy match is summarised at the end of the run. A match nobody mentions is silent divergence, which is the one thing this tool must never do.
Fork
Replay to a step, change one thing, and run live from there. The first N events are free and identical, so you are testing exactly one variable instead of re-running the whole agent and hoping the bug recurs.
tape fork <run> --at 13
tape fork <run> --at 13 --patch 'llm.model=claude-sonnet-4-5'
tape fork <run> --at 13 --patch 'llm.system+="Ask before destructive actions."'
tape fork <run> --at 7  --patch 'tool.read_file.result="<empty file>"'
tape fork <run> --at 7  --patch 'tool.read_file.args={"path": "b.txt"}'
tape fork <run> --at 13 --edit          # open $EDITOR on the event first
$ tape fork 01M0BDHF --at 1 --patch 'llm.system+="Use the full listing."'
✓ forked → 01M0BDK0WA531Q  (1 replayed, 2 live, $0.0004)
  parent 01M0BDHF8JK3MT · forked at event 1
  patched llm.system+="Use the full listing."
--at N replays events 0 through N−1. Event N is the first live one, and the
patch applies to it on its way out. That is the one thing worth being pedantic
about: --at 0 runs everything live, --at len(run) replays everything, and
--at 13 means the thirteen events before 13 are free.
A fork writes both halves to its own run, so it is a complete trace — replayable
and forkable again. The parent is never modified. tape ls shows parentage:
RUN             WHEN               EVENTS      DUR     COST  COMMAND
01M0BDK0WA531Q  2026-08-18 14:31        3     0.4s  $0.0004  agent.py  ← 01M0BDHF8JK3MT@1
01M0BDHF8JK3MT  2026-08-18 14:30        3     1.2s  $0.0011  agent.py
The patch grammar
<kind>[.<name>].<field> followed by an operator and a value. Values parse as
JSON when they are JSON, and as a bare string otherwise — so
llm.model=gpt-4o needs no quotes.
| Operator | Meaning |
|---|---|
= |
replace |
+= |
append to a string, add to a number, extend a list |
~= |
regex substitution, written /pattern/replacement/ |
| Kind | Field | Effect |
|---|---|---|
llm |
model |
swap the model on the outgoing request |
llm |
system |
the system prompt, wherever the provider keeps it |
llm |
temperature, top_p, max_tokens, seed |
request parameters |
llm |
response |
substitute the completion; no live call is made |
tool |
args |
call the tool with different arguments; the body still runs |
tool |
result |
substitute the return value; the body does not run |
mcp |
args |
call the MCP tool with different arguments |
mcp |
result |
substitute the MCP result; no call is made |
http |
url |
rewrite the request URL |
http |
body |
replace the request body (JSON) |
http |
body_response |
substitute the response body; no live call is made |
llm.system finds the system prompt whichever way the provider carries it —
Anthropic's top-level system field or OpenAI's first role: system message —
so one expression works against both. Fields that substitute a result stop the
boundary executing at all; everything else rewrites the request and the call
still happens.
body and args are whole documents, so they take = only — += on a JSON
object has no meaning, and accepting it and then ignoring it is how
tool.args spent two releases doing nothing. Every field in that table has a
test asserting it reaches its boundary, and a test asserting the table and the
grammar still agree.
Anything the grammar cannot express is what --edit is for: it opens $EDITOR
on the event at the fork point and uses the request body you save. An empty
buffer or invalid JSON aborts without creating a run.
A fork needs live credentials from event N onward. Those are checked before anything is replayed, so a missing key costs you an error message rather than a replayed prefix and then an error message.
Signed requests (Bedrock / boto3)
A request that was AWS SigV4-signed before reeltime saw it takes result substitution only:
tape fork <run> --at 3 --patch 'llm.response="I could not find that file."'   # ✅
tape fork <run> --at 3 --patch 'llm.model=amazon.titan-text-express-v1'       # ✕ refused
botocore signs, then calls urllib3 — which is where reeltime's seam is — and
the signature covers the URI path and a hash of the body. On Bedrock the model
id is a path segment, not a body field, so llm.model is exactly the case
that would change signed bytes. Rewriting either would produce
SignatureDoesNotMatch: an error about credentials, for what is really an
unsupported patch. So those patches are refused before the fork runs, with a
message naming the reason and pointing at llm.response.
Substituting a result has no such problem, because the request is never sent.
The substituted body is built from the parent event's own recorded response,
so it comes back in that model family's shape — a Titan caller still reads
results[0].outputText, a Claude-on-Bedrock caller still reads
content[0].text, and every field the decoder does not read survives.
Diff
Two runs, aligned by call site rather than by index, so an event inserted near the front does not report everything after it as changed.
$ tape diff 01M0BFPQ 01M0BFPR
diff  A 01M0BFPQCH0BJJH78JWEWK98G2   B 01M0BFPQGVF0QZPV4R9HG1GKGK

step 0   identical
step 1   tool    delete(n=0)  →  ask(n=0)
                 result: deleted 0  →  asked 0
step 2   ⋯ divergent from here (A ended; B: 2 more events)

cost   A $0.00      B $0.00
tokens A 0          B 0
The last line is the one to read first. Alignment and field-level reporting are table stakes; naming the step where two trajectories stop being the same run is the reason to run this at all. Everything above it is detail hung off that answer.
For LLM steps the report reaches into the context, so a changed system prompt shows as the two lines that changed rather than as "the request differs":
step 1   llm     system prompt changed
                 - Answer only from the listing you are given.
                 + Answer only from the listing you are given. Use the full listing.
                 tokens in: 88  →  94
--only llm (repeatable) narrows the comparison to one kind; --json gives the
same structure as data, divergence point included.
Forks are the natural thing to diff: fork a run with one patch, then compare the two and read what that one change did.
MCP sessions
An agent that talks to an MCP server crosses a boundary at every tools/call,
and at every tools/list too. Recorded as opaque HTTP, a run where the server
offered a different tool set is unattributable: the agent simply did something
else and nothing says why. So MCP gets its own event kind.
import reeltime as tape

async with tape.mcp.connect("python", ["server.py"], server="files") as session:
    tools = await session.list_tools()
    result = await session.call_tool("read_file", {"path": "a.txt"})
Both transports: command=/args= for stdio, url= for HTTP — streamable
HTTP by default, SSE with transport="sse". tape.mcp.wrap(session, server=…)
records a session you opened yourself.
$ tape show last
   0  mcp      261ms  agent.py:33   files initialize → example-files 1.0.0
   1  mcp        1ms  agent.py:40   files tools/list → 2 tools: list_files, read_file
   2  mcp        1ms  agent.py:44   files·list_files() → "invoice.pdf\nnotes.txt…
   3  mcp       23ms  agent.py:47   files·read_file("path": "notes.txt") → "buy milk…

$ tape show last 1
mcp · event 1 · files · agent.py:40  (1ms)

  tools/list → 2 tools
    list_files               List the files available on this server.
    read_file                Read one file by name.
      (path: string)
Replay does not start the server. A pure replay spawns no subprocess and
contacts no URL — every call is served from the tape, and one that was never
recorded raises TapeMiss rather than quietly going live. (A fork does start
it: a fork continues for real past its fork point.)
A changed tool set is reported as a changed tool set. Record the same agent against two versions of a server and the diff names the difference, instead of reporting that two payloads differ somewhere:
$ tape diff <a> <b>
step 1   mcp     tool set changed
                 + delete_file
step 4   mcp     only in B: delete_file(path=invoice.pdf)
The second line is the consequence of the first, which is the whole argument
for recording discovery. examples/mcp_agent.py runs this end to end against a
mock server with no credentials and no network.
mcp folds into http for alignment the way llm does, so a session recorded
before this adapter existed still lines up against one recorded since. --only
is not folded: --only mcp means MCP events.
LangChain agents
A LangChain agent is a tree. Intercepting at the transport layer sees only its leaves — two POSTs with a growing message array — and none of the shape that decided them. So a LangChain node gets its own event kind, carrying node identity, the path it sits on, its depth, and its inputs and outputs.
import reeltime as tape

tape.langchain.install()      # before the first chain runs
agent.invoke({"messages": [...]})
or, without editing the script at all:
$ tape run --langchain python agent.py
tape.langchain.handler() returns a callback handler if you would rather scope
it: chain.invoke(x, config={"callbacks": [handler]}). It works for LangGraph
and for langchain.agents.create_agent too — both route through the same
callbacks.
$ tape show last
   0  llm        1ms  agent.py:41   gpt-4o-mini 40→12
   1  chain     13ms  agent.py:41     model → ""  (1 child)
   2  chain      0ms  agent.py:41       word_count [tool] → "9"
   3  chain      1ms  agent.py:41     tools → "9"  (1 child)
   4  llm        0ms  agent.py:41   gpt-4o-mini 120→12 Counted 9 words.
   5  chain      2ms  agent.py:41     model → "Counted 9 words."  (1 child)
   6  chain     17ms  agent.py:41   LangGraph → "Counted 9 words."  (3 children)

$ tape show last 2
chain · event 2 · langchain · agent.py:41  (0ms)

  node     word_count
  type     tool
  path     LangGraph/tools/word_count   (depth 2)
  inputs   {"text": "the quick brown fox jumps over the lazy dog"}
  outputs  {"content": "9", "type": "tool", …}
A chain node is structure, not a boundary. A callback handler is an observer: it is told a node started, it cannot stop the node from running. If a node opened a recording boundary the model call inside it would be suppressed at record time and would then go live on replay — the one thing this tool must never do. So chain events nest around other events rather than standing in for them.
The corollary is what keeps the count honest: the adapter does not record LLM
nodes. on_chat_model_start fires for the same crossing the transport shim
already records with the wire bytes, the token counts and the streaming chunks,
so recording it again would be two events for one boundary. Every other node —
chains, tools, retrievers, prompts, parsers, agent steps — becomes an event.
One rule, because a rule with exceptions is one people get wrong.
A LangChain tool node that makes an HTTP call is therefore two events, and
deliberately: one chain event for the node and one http event for the
crossing inside it. They are different things at different levels. If you want
the tool's result held still on replay instead, wrap the function in
@tape.tool — then the body does not run at all.
A changed graph is reported as a changed graph. Give the agent one more tool and it goes round the loop again; the diff names that as structure rather than as two message arrays that differ somewhere:
$ tape diff <a> <b>
step 0–4  identical (5 events)
step 6   chain   only in B: reverse
step 7   chain   only in B: tools
step 10  chain   chain fan-out changed
                 chain fan-out changed: 3 child nodes  →  5 child nodes
examples/langchain_agent.py runs that end to end against an embedded mock
provider — no API key and no network.
Replay re-runs the chain for real, with its model calls served from the
tape, and each node consumes its recorded event: a chain whose shape changed
reports drift rather than passing unnoticed. tape replay turns the adapter on
by itself when the tape has chain events in it, so you do not have to remember
which run was recorded with what.
A node is identified by where it sits — its path through the run tree, its
depth, and which branch of a sequence or map it is — never by its inputs. A
node's inputs are a consequence of the model calls above it, which the tape
already holds still; hashing them would report drift on every node downstream
of a prompt tweak and bury the one place the run actually changed. LangChain's
per-run message ids are stripped for the same reason: they are the only part of
a node payload that differs between two identical runs, so leaving them in
would make tape diff report noise at every step.
chain folds into http for diff alignment the way llm and mcp do, so a
run recorded before this adapter existed still lines up against one recorded
since. It is deliberately not folded for replay matching: a wrong pairing in
a diff costs a confusing line, while a wrong bucket in the matcher would serve
an HTTP request a chain node's payload.
Supported versions
| Tested against | langchain-core 0.3 and 1.5, both in CI |
| Declared range | >=0.3,<2 |
| Also covered | langchain, langgraph, langchain-openai — all route through langchain-core's callbacks |
LangChain's internals move fast, and the callback contract is not promised
across a major version. An untested version is refused with the range it
needs, rather than recorded and hoped for — a trace that looks right and
replays wrong is worse than no trace. Override with
tape.langchain.install(allow_unsupported=True) if you want to try it anyway.
The floor is a CI job, not a claim: it pins langchain-core to 0.3 and runs the
adapter's suite against it. It has already earned its place — 0.3 spells a
message id run--… and 1.x spells it lc_run--…, and that job is what found
it.
There are no --patch fields for chain, and there will not be: a callback
handler cannot change what a chain does, so a field that parsed and reported
itself as applied would change nothing. That is the exact failure tool.args
shipped with for two releases. Patch the llm boundary inside the node instead.
Doctor
tape doctor answers a question you have before you have any traces: what
about this agent is actually nondeterministic? It runs the command twice,
compares the traces, and reports each boundary where the two runs got different
answers — with the line of your code that crossed it.
$ tape doctor python agent.py
running `python agent.py` 2 times — real runs, real calls, real cost
  run 1 of 2…
  run 2 of 2…

doctor  2 runs of the same command  (01M0C0S6TZ1VA0, 01M0C0S6ZRKEEH)

~ 3 nondeterminism sources found

  agent.py:88   llm               1 of 1 completion differed (gpt-4o-mini, temperature 0.7)
                                  I will delete b.txt → Let me remove b.txt
  tools.py:12   http              1 of 1 response differed
                                  {"temp": 12} → {"temp": 15}
  agent.py:34   time·datetime.now 1 of 1 read differed
                                  2026-08-18T10:00:01 → 2026-08-18T10:04:55

suggestions:
  llm: set temperature=0 for the closest thing to a reproducible run — though
       most providers still do not promise identical completions, which is the
       reason replay exists
  http: an upstream response changed between runs; stub it or pin the version
        if the agent's behaviour depends on it
  time·datetime.now: inject a clock instead of calling time.time() or
                     datetime.now() in the agent, so a test can hold it still
A finding is a call site, not an event. An agent in a loop reads the clock forty times; forty findings would bury the one that matters, so they are grouped and counted.
A path split is reported separately. Once two runs stop making the same calls, everything after is incomparable rather than different — so the step where they split gets its own line, naming what each run called instead:
  ⋯ the runs stopped making the same calls at step 1
     run 1 called tool·path_a at split.py:19; run 2 called tool·path_b at split.py:21
     Everything after that is incomparable, not divergent.
     Fix the sources above and the split usually goes with them.
--runs N looks harder (a source that shows up one time in three needs more
than two runs to catch). --json gives the report as data. --fail-on-findings
exits 1 when anything is found, which makes it a CI gate: this agent is
reproducible, and here is the check that says so.
The runs are kept, so tape diff and tape show work on them afterwards.
Doctor is not free — it runs your agent for real, twice — and it says so before
it starts.
The viewer
tape ui              # the newest run, with the runs overlay up
tape ui 01M0BDK0     # straight into that run
Serves 127.0.0.1:7654. Local only — no accounts, no telemetry, no
external requests, and the page loads nothing remote, so it works offline. The
bind address is not configurable, because a trace is redacted on a best-effort
basis and "unreachable from the network" is doing real work there.
It is a viewer for the things nothing else can show, not a dashboard. There are no cost charts or latency percentiles — LangSmith and Braintrust do that, with teams behind them. What is here instead:
- The context view and context diff, with truncation called out. A message that survived but lost most of itself gets its kept prefix and its dropped tail as separate blocks — an inline diff of "the last 500 characters vanished" is unreadable, and this is the bug the demo is built around.
- The fork tree, with lineage, fork points, and each fork's patch expressions.
- The divergence point between two runs, before any per-field detail.
- The chain tree for LangChain and LangGraph runs, with the HTTP and LLM events nested inside the node they happened in.
- Doctor findings grouped by call site, recomputed from stored runs.
Keyboard-first: ←/→ scrub the timeline, c and d switch to context and
context-diff, [/] move the diff baseline, t opens the fork tree, o the
runs overlay, y copies the equivalent tape … command, ? lists the rest.
Read-only, and it never runs your agent. tape fork and tape doctor both
execute your code with live credentials and real cost; a viewer is exactly
where somebody clicks by accident. The UI shows you the command instead.
Timeline blocks are proportional to duration over a 3px floor — without the floor a 1 ms tool call beside a 1400 ms model call is invisible, which measured out as 38% of blocks unreadable at only 50 events. Past roughly 240 blocks (computed from the window width) they bucket. Read exact durations off the status bar; the strip is a map.
Why interception is at the transport layer
On 2026-08-18 the OpenAI Python SDK (3.2.0) is built on httpx2 2.10, while
the Anthropic SDK (0.122.0) is still on httpx 0.28. reeltime intercepts at
Client._transport_for_url — httpx's own documented extension point — so
supporting that split cost one constructor argument, because both libraries
kept the same hook.
An interceptor that patched the SDKs instead would have needed a rewrite for
that migration, and another one at the next. Nothing in the recording path
knows a provider exists; model, tokens, and cost are added afterwards by pure
functions over the recorded bytes (core/decoders/).
Adding a provider is one module and one row in a pricing table, with nothing
patched.
The same argument is why Bedrock works. botocore is not on httpx at all —
it is on urllib3, below every other shim — so a Bedrock agent used to record
nothing: no event, no error, and a replay that quietly went to the real API. The fix was another seam, not another adapter:
HTTPConnectionPool.urlopen, which is public, documented, and sits under every
AWS SDK without knowing any of them exist. requests is built on urllib3 too,
and a requests call still records as one event rather than two, because
the outermost-boundary rule from M1 already covered it.
Bedrock's streaming is not SSE but application/vnd.amazon.eventstream, a
binary framing with a length prelude, typed headers and two CRC32s per message.
It is recorded frame for frame — one recorded chunk per message, not one
coalesced blob — and the test that proves it hands the recorded bytes back to
botocore's own parser, which validates both checksums and rejects the whole
stream if a byte is out.
Numbers
Measured, not estimated. python examples/overhead.py produces every figure
below; python examples/m3_replay_speed.py produces the replay ratio. Median
of 7 batches on an M-series Mac, Python 3.13, against a loopback mock — so the
boundary itself is nearly free and the absolute overhead is not hidden inside
network latency.
Added per recorded boundary crossing:
| Seam | Added per event |
|---|---|
httpx, httpx2, requests |
~0.2 ms |
urllib3 (so boto3/Bedrock) |
~0.15 ms |
MCP tools/call |
~70 µs |
LangChain chain node |
~60 µs |
@tape.tool call |
~25 µs |
ambient read (random, uuid, clock) |
~15 µs |
Plus ~3 ms once per run for install() and teardown — patching the shims
and writing the header and footer. On a short run that fixed cost is most of
what recording costs you.
On disk: ~1.4 KB per LLM event with a 240-character prompt, ~230 bytes per
ambient read. Payloads over 8 KB are content-addressed into .tape/blobs/ and
deduplicate across turns, so a long system prompt repeated over twenty turns is
stored once.
Replay: the 8-turn agent in examples/m3_replay_speed.py replays its 16
events in ~50 ms, and that figure barely moves with what the original calls
cost — replay does no network I/O, so it is bounded by local work alone. At
400 ms per call that is ~60× faster; against a slower model, or an agent
that paid for retries, the ratio is however much latency you were paying.
Why these are lower than the figures published before 1.0
The pre-1.0 README quoted ~2 ms per HTTP event and 20–30 µs per ambient read.
Those numbers predated MCP, tape doctor, LangChain and urllib3, and were
never re-measured as seams were added — which is how a README ends up
advertising Bedrock support next to figures taken before Bedrock existed.
They were also derived unreliably. The per-event overhead was computed by
differencing two single runs of a benchmark dominated by 3.2 s of simulated
latency and dividing by the event count. Run four times, that method reports
between 3.6 ms and 7.5 ms per event for identical work — it was measuring
jitter. examples/m3_replay_speed.py no longer reports a per-event figure and
says why; examples/overhead.py measures each seam directly, off versus on, as
a median over repeated batches.
Trace format stability
A trace is a portable artifact, and 1.0 makes that a commitment. The format
is JSONL with a "v" schema version that has been 1 since the first release
and will not change inside 1.x; a bump would be a breaking change requiring a
major version and a migration path, not a quiet increment. Readers ignore
fields they do not recognise and keep events whose kind they have never heard
of, so a trace written by a newer reeltime still opens in an older one — losing
an event would be worse than failing to interpret it, because the count is what
tells you the trace is complete. Enrichment runs the other way too: decoders are
pure functions over recorded bytes, so a provider decoder written today reads a
trace recorded a year ago, which is what tape reindex is built on. Old
traces always replay — matching is by call site and content hash, neither of
which is version-specific, and the one thing that will stop a replay is your
code changing, which raises TapeMiss by design rather than drifting. The
guarantee is tested rather than asserted:
tests/test_trace_compat.py runs against a trace
recorded by 0.1.0, checked in unmodified, and still finds the truncation bug
in it. What is not promised: the exact bytes of enrichment fields (tokens,
cost_usd) may improve as decoders and pricing data do, and .tape/blobs/ is
an implementation detail addressed by content hash rather than a stable layout.
What this can't replay
Being precise about the boundary is the point.
-
External state mutation. If the agent deleted a file, replay does not put it back. Replay reproduces the decisions, not the world. Run replays in a scratch directory or a container.
-
The agent's own
time.sleep. Replay skips network latency, not code that deliberately waits. An agent that sleeps 30 s still sleeps 30 s. -
datetime.now(), unless you opt in.datetimeis a C type, so seeingnow()means replacing the module attribute with a subclass — and pydantic v2 dispatches on type identity, so doing that makes the real datetime class unrecognisable to it and breaks any library that imported it first. The Anthropic SDK stops working entirely. Enable withpatch=("random", "uuid", "time", "datetime")if your stack is not pydantic v2;time.time()is patched either way and covers most clock reads. -
True thread races. Concurrent calls in the same span replay in recorded order. Put concurrent work in separate
tape.span()s and the order stops mattering; a genuine data race between threads is not reproduced. -
JSON body whitespace. A parsed JSON body is stored as JSON, not as the original bytes. Keys and values survive; formatting does not. Keeping the exact bytes meant keeping a base64 copy that redaction could not scrub, which is a bad trade for whitespace no parser can see.
-
Binary bodies are stored as base64 and cannot be scanned for secrets. Text and JSON bodies are scrubbed in full.
-
random.Random()instances,SystemRandom, andnumpy.random.default_rng(). Only the module-level functions are patched; an explicitly constructed generator is an object you can seed yourself. -
C-extension nondeterminism. Anything reading the clock or entropy below the Python layer is invisible.
-
aiohttp— guarded, not silently unsupported. Still not intercepted, but as of 0.5.0 a replay that reaches an aiohttp request raises instead of quietly calling out to the network, and a recording that reaches one warns once. Wrap the call in a@tape.toolfunction and reeltime records its result — which is the boundary replay actually needs — and the guard steps aside.Why it is not intercepted, since that is the interesting half: httpx publishes
BaseTransport.handle_request(Request) -> Responseand promises it, which is why the httpx shim is small and survives SDK churn. aiohttp's only public hook isTraceConfig, which is observe-only — it can record and can never replay, the worst possible half — and its real seam is the privateClientSession._request(33 parameters). Replay would mean fabricating aClientResponseover aiohttp's private connection contract; itsStreamReadercallsprotocol.resume_reading(resume_parser=…), a keyword in no public interface. That was prototyped and it works: two fake objects and eight private attributes, all needing re-verification on every aiohttp release, to cover a stack no LLM SDK reeltime targets is built on. So the cost went into the guard instead, which is the part that was actually dangerous. -
A reported cost is a base-rate estimate, and it under-reports.
cost_usdis a lookup inpricing.pyagainst the model id in the request, and a trace records a request, not a bill. Three things it cannot see, all of which mean the real figure is higher, never lower:- Region. Bedrock rows are US rates. The same
amazon.nova-liteis $0.06/$0.24 per 1M inus-east-1andus-west-2and $0.078/$0.312 ineu-central-1— about 30% more. The URL names a region only when the endpoint is regional, and an inference profile hides it entirely. - Latency-optimised inference. Bedrock bills
amazon.nova-proat $1.00/$4.00 in latency-optimised mode against $0.80/$3.20 standard — under the same model id. Nothing in the recorded request distinguishes them. - Batch, prompt caching, fast mode, and the US data-residency multiplier are likewise not modelled. Batch is half price and caching is cheaper still, so a cached or batched run is over-reported instead — the one direction that errs the other way.
A model with no row reports
cost_usd: null, never a guess — including Claude-on-Bedrock from 3.5 Sonnet on, and Nova 2.0, whose rates depend on a cross-region routing tier the request does not record. Token counts still populate. Treat the number as an order of magnitude for one run, not as accounting. - Region. Bedrock rows are US rates. The same
-
Forking a signed request rewrites nothing. A Bedrock call is signed by botocore before reeltime's seam sees it, and AWS SigV4 covers the URL and a hash of the body — so
--patch llm.model=…,llm.system,http.urlandhttp.bodyare refused on such an event rather than sent and rejected as a bad signature.--patch llm.response=…works normally: substituting a completion sends nothing, so there is nothing to invalidate. See The patch grammar. -
Raw sockets,
urllib, gRPC and WebSockets. Not intercepted, and without a guard. The OpenAI Realtime API is a WebSocket, which is not a request/response boundary at all.@tape.toolis the supported way to put a boundary around them today.
How this compares
| reeltime | agenttape | VCR.py | LangSmith / Braintrust | |
|---|---|---|---|---|
| Job | local debugger | test fixtures | HTTP fixtures | hosted observability & eval |
| Replay offline | ✅ | ✅ | ✅ | ✕ |
| Survives an edited prompt | ✅ tier 2 + drift report | ✕ hard fail | ✕ | n/a |
| Streaming record/replay | ✅ chunk-exact | ✕ refused | partial | n/a |
| Full context inspection | ✅ --context, --diff |
inspect / timeline / HTML viewer | ✕ | ✅ in the UI |
| MCP sessions as first-class events | ✅ both transports, tool-set diff | ✕ (an mcp extra with no code behind it) |
✕ | ✕ |
| LangChain graph structure as events | ✅ node, path, depth, fan-out; graph diff | ✕ | ✕ | ✅ in the UI |
| Keeps the trace when the run crashes | ✅ flushed per event | ✕ discards it | n/a | ✅ |
| Ambient nondeterminism | recorded, per call site | frozen (seeded, pinned clock) | ✕ | ✕ |
Step controls (--to, --step) |
✅ | ✕ | ✕ | ✕ |
| Reports what is actually nondeterministic | ✅ tape doctor, with call sites |
✕ | ✕ | ✕ |
| pytest integration | ✕ | ✅ | ✅ | partial |
| Hand-editable fixture files | JSONL + blobs | ✅ readable YAML | ✅ YAML | n/a |
| Recorded exceptions re-raised | ✅ | ✅ | partial | n/a |
AgentTape is the closest thing to this and it is a good project — a shipped CLI, an HTML viewer, an alignment-based diff, a pytest plugin, and hand-editable YAML cassettes. It is aimed at a different job: it builds test fixtures, so it deliberately discards a recording when the run raises, fails hard when a prompt changes, and freezes the clock and RNG rather than recording them. Those are the right calls for a fixture library and the wrong ones for a debugger. If you want offline agent tests in CI, use it. If you want to understand why one run failed, use this. Full teardown, including what it does better: COMPETITIVE.md.
LangSmith and Braintrust are hosted observability and evaluation platforms. Different job again: they show you aggregate behaviour across many runs; this reproduces one run byte for byte on your laptop.
Design notes
Redaction is mandatory, not optional. Traces are meant to be pasted into
issues, so every event is scrubbed before it reaches disk — sensitive headers
dropped by name, key-shaped values replaced (sk-, sk-ant-, ghp_, AWS,
JWT, …), blobs included. Add your own with
tape.redact(r"ACME-[A-Z0-9]{24}"); the end-of-run summary reports what was
caught. The header's environment snapshot is an allowlist of
configuration-shaped variables, never the whole environment.
Traces survive the crash you are debugging. Every event is flushed as it is written, so a run that dies leaves everything up to the moment it died. A missing footer line is precisely how you know it did not exit cleanly.
The outermost boundary is the one recorded. An HTTP call inside a
@tape.tool body does not produce a second event, and neither do random draws
made there. On replay that body never runs, so anything recorded inside it could
never be matched.
Only your own code's ambient reads are recorded. asyncio reads
time.monotonic() every loop iteration and httpx reads perf_counter() twice
per request. The same filter applies on replay, so those stay live in both
directions — consistent, and never a spurious miss.
Configuration
Explicit arguments beat environment variables, which beat the nearest
.tapeconfig.
tape.install(
    tape_dir=".tape",            # or $TAPE_DIR
    blob_threshold=8192,         # or $REELTIME_BLOB_THRESHOLD
    patch=("random", "uuid", "time", "numpy"),   # add "datetime" to opt in
    http=True,                   # or $REELTIME_HTTP
    decode=True,                 # provider decoders; $REELTIME_DECODE
    record_library_ambient=False,
    redact=[r"ACME-[A-Z0-9]{24}"],
)
{ "blob_threshold": 16384, "redact": ["ACME-[A-Z0-9]{24}"] }
Examples
Runnable agents, all covered by the test suite — see examples/.
The two SDK examples import nothing from reeltime, which is the zero-edit claim
made concrete. mcp_agent.py, langchain_agent.py and bedrock_agent.py need
no API key and no network: they drive the mock MCP server next to them, an
embedded mock provider, and a mock Bedrock endpoint respectively — the last of
those needs no AWS account either.
Roadmap
reeltime is 1.0 and feature-complete. Everything the build spec set
out to do is built and released. M13 and M14 below are two internal gaps —
both recorded with the measurements behind them in
STATUS.md, neither scheduled, and neither affecting anyone who
is not forking a requests- or urllib3-recorded event.
| M | Scope | Status |
|---|---|---|
| 1 | Trace format, blob store, recorder, ambient patches | ✅ |
| 2 | httpx shim, provider decoders, @tape.tool, streaming, run/ls/show |
✅ |
| 3 | Player, three-tier matcher, TapeMiss, tape replay |
✅ |
| 4 | --context, tape reindex, examples, v0.1.0 |
✅ |
| 5 | tape fork <run> --at N --patch …, v0.2.0 |
✅ |
| 6 | tape diff, divergence-point reporting, v0.3.0 |
✅ |
| 5.5 | MCP adapter — mcp events, both transports, tool-set diff |
✅ |
| 7 | tape doctor — find a run's nondeterminism sources, v0.4.0 |
✅ |
| 9 | LangChain adapter — chain events, graph diff, the aiohttp guard, v0.5.0 |
✅ |
| 10 | urllib3 interception — Bedrock/boto3 record and replay |
✅ |
| 11 | tape ui — a local viewer |
✅ |
| 12 | Overhead re-measured across every seam, v1.0 | ✅ |
| 13 | Fork patches at the requests and urllib3 seams |
open |
| 14 | Re-runnable Bedrock pricing check against the AWS Price List API | open |
There is no docs site, and that is a decision. For a tool this size the README is better: one page, searchable, versioned with the code, and rendered by both GitHub and PyPI. A docs site would add a build, a host, and a second place for a claim to go stale.
MCP shipped early on purpose: no other record/replay tool captures MCP sessions, and a server that exposes a different tool set between runs is exactly the kind of thing that changes an agent's behaviour invisibly. See MCP sessions.
Development
git clone https://github.com/vedanth2406/reeltime
cd reeltime
pip install -e ".[dev]"
pytest                                  # 882 tests
pytest --cov --cov-report=term-missing  # core/ is at 95%
python examples/m3_replay_speed.py      # the benchmark above
Verified on Python 3.9 through 3.13.
Prior art
tapedeck and agenttape were both taken on PyPI, so the package is
reeltime. The CLI is tape. See How this compares for
what already exists in this space and why this is a different tool.
License
MIT — see LICENSE.
1 maintainer

Metadata
1 maintainer
Release files for reeltime 1.0.0
For a detailed explanation of source distributions (sdists) and built distributions (wheels), please see the package formats documentation.
Source distribution (sdist)
| File | Size | Uploaded | |
|---|---|---|---|
| reeltime-1.0.0.tar.gz | 774.2 kB | Details |
Built distribution (wheel)
| File | Interpreter | ABI | Platform | Reset |
|---|---|---|---|---|
| reeltime-1.0.0-py3-none-any.whl | Python 3 | none | any | Details |
Total release size: 971.9 kB
Release files / reeltime-1.0.0.tar.gz
| Download URL | reeltime-1.0.0.tar.gz |
|---|---|
| Size | 774.2 kB |
| Tags | Source |
|
SHA-256 checksum How to use checksums |
8f24ca70259de9c981c35139e41bcb978856a4ec6f65f97329b553c655cb2526
|
|
BLAKE2b-256 checksum How to use checksums |
44fbad5a7bd722101c753af85c6d10800ee786d9ed212d40bca502d5e88d86bb
|
| Upload date | |
|
Uploaded using Trusted Publishing? What is trusted publishing? |
No |
| Uploaded via |
twine/7.0.0 CPython/3.13.13
|
Release files / reeltime-1.0.0-py3-none-any.whl
| Download URL | reeltime-1.0.0-py3-none-any.whl |
|---|---|
| Size | 197.7 kB |
| Tags | Python 3 |
|
SHA-256 checksum How to use checksums |
cd3899164619d762396bc9a95b84891b4c59aac121fbc22d1822cb08e76b6cfa
|
|
BLAKE2b-256 checksum How to use checksums |
e6c4010475fcf023612bf850a10c8fa89657d5d710305c237720bcf1b8798235
|
| Upload date | |
|
Uploaded using Trusted Publishing? What is trusted publishing? |
No |
| Uploaded via |
twine/7.0.0 CPython/3.13.13
|














