



rliable is an open-source Python library for reliable evaluation, even with a handful
of runs, on reinforcement learning and machine learnings benchmarks.
| Desideratum | Current evaluation approach | Our Recommendation |
|---|---|---|
| Uncertainty in aggregate performance | Point estimates:
|
Interval estimates using stratified bootstrap confidence intervals (CIs) |
| Performance variability across tasks and runs | Tables with task mean scores:
|
Score distributions (performance profiles):
|
| Aggregate metrics for summarizing benchmark performance | Mean:
|
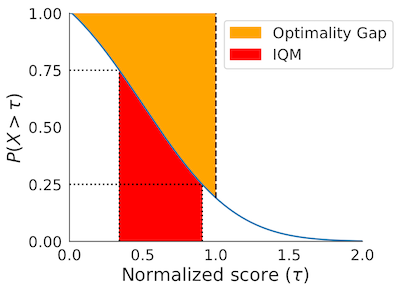
Interquartile Mean (IQM) across all runs:
|
rliable provides support for:
- Stratified Bootstrap Confidence Intervals (CIs)
- Performance Profiles (with plotting functions)
- Aggregate metrics
- Interquartile Mean (IQM) across all runs
- Optimality Gap
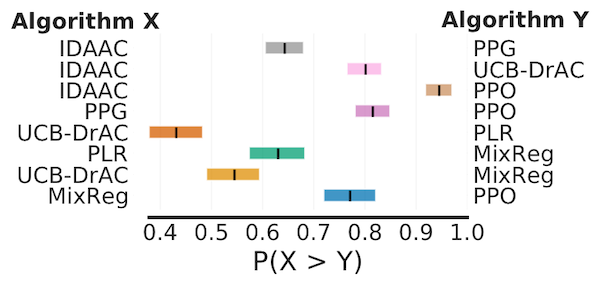
- Probability of Improvement
Interactive colab
We provide a colab at bit.ly/statistical_precipice_colab, which shows how to use the library with examples of published algorithms on widely used benchmarks including Atari 100k, ALE, DM Control and Procgen.
Data for individual runs on Atari 100k, ALE, DM Control and Procgen
You can access the data for individual runs using the public GCP bucket here (you might need to sign in with your gmail account to use Gcloud) : https://console.cloud.google.com/storage/browser/rl-benchmark-data. The interactive colab above also allows you to access the data programatically.
Paper
For more details, refer to the accompanying NeurIPS 2021 paper (Outstanding Paper Award): Deep Reinforcement Learning at the Edge of the Statistical Precipice.
Installation
To install rliable, run:
pip install -U rliable
To install latest version of rliable as a package, run:
pip install git+https://github.com/google-research/rliable
To import rliable, we suggest:
from rliable import library as rly
from rliable import metrics
from rliable import plot_utils
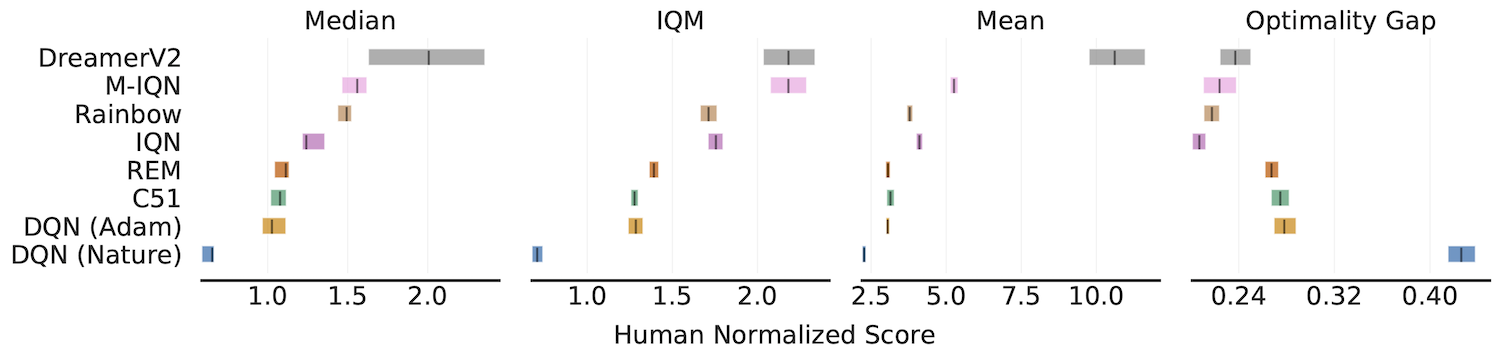
Aggregate metrics with 95% Stratified Bootstrap CIs
IQM, Optimality Gap, Median, Mean
algorithms = ['DQN (Nature)', 'DQN (Adam)', 'C51', 'REM', 'Rainbow',
              'IQN', 'M-IQN', 'DreamerV2']
# Load ALE scores as a dictionary mapping algorithms to their human normalized
# score matrices, each of which is of size `(num_runs x num_games)`.
atari_200m_normalized_score_dict = ...
aggregate_func = lambda x: np.array([
  metrics.aggregate_median(x),
  metrics.aggregate_iqm(x),
  metrics.aggregate_mean(x),
  metrics.aggregate_optimality_gap(x)])
aggregate_scores, aggregate_score_cis = rly.get_interval_estimates(
  atari_200m_normalized_score_dict, aggregate_func, reps=50000)
fig, axes = plot_utils.plot_interval_estimates(
  aggregate_scores, aggregate_score_cis,
  metric_names=['Median', 'IQM', 'Mean', 'Optimality Gap'],
  algorithms=algorithms, xlabel='Human Normalized Score')
Probability of Improvement
# Load ProcGen scores as a dictionary containing pairs of normalized score
# matrices for pairs of algorithms we want to compare
procgen_algorithm_pairs = {.. , 'x,y': (score_x, score_y), ..}
average_probabilities, average_prob_cis = rly.get_interval_estimates(
  procgen_algorithm_pairs, metrics.probability_of_improvement, reps=2000)
plot_utils.plot_probability_of_improvement(average_probabilities, average_prob_cis)
Sample Efficiency Curve
algorithms = ['DQN (Nature)', 'DQN (Adam)', 'C51', 'REM', 'Rainbow',
              'IQN', 'M-IQN', 'DreamerV2']
# Load ALE scores as a dictionary mapping algorithms to their human normalized
# score matrices across all 200 million frames, each of which is of size
# `(num_runs x num_games x 200)` where scores are recorded every million frame.
ale_all_frames_scores_dict = ...
frames = np.array([1, 10, 25, 50, 75, 100, 125, 150, 175, 200]) - 1
ale_frames_scores_dict = {algorithm: score[:, :, frames] for algorithm, score
                          in ale_all_frames_scores_dict.items()}
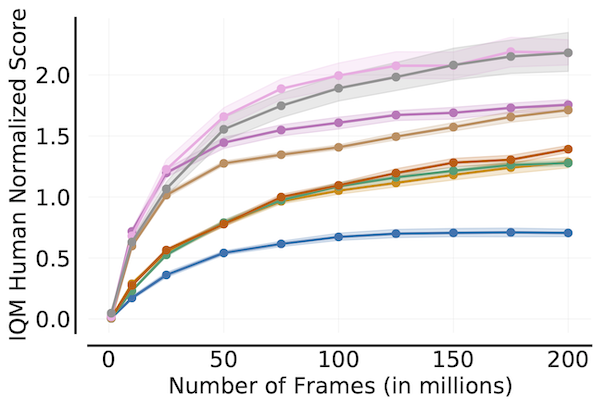
iqm = lambda scores: np.array([metrics.aggregate_iqm(scores[..., frame])
                               for frame in range(scores.shape[-1])])
iqm_scores, iqm_cis = rly.get_interval_estimates(
  ale_frames_scores_dict, iqm, reps=50000)
plot_utils.plot_sample_efficiency_curve(
    frames+1, iqm_scores, iqm_cis, algorithms=algorithms,
    xlabel=r'Number of Frames (in millions)',
    ylabel='IQM Human Normalized Score')

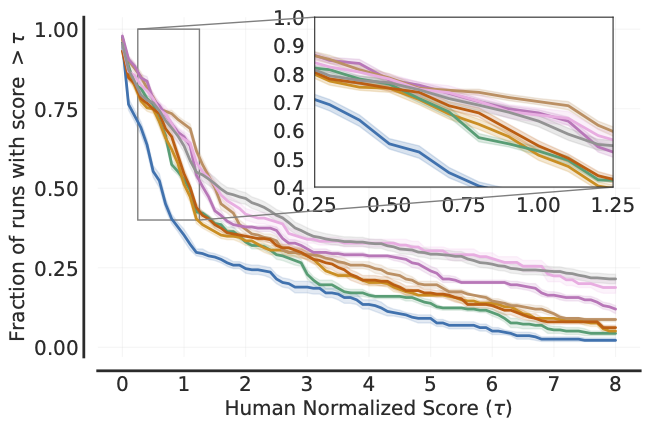
Performance Profiles
# Load ALE scores as a dictionary mapping algorithms to their human normalized
# score matrices, each of which is of size `(num_runs x num_games)`.
atari_200m_normalized_score_dict = ...
# Human normalized score thresholds
atari_200m_thresholds = np.linspace(0.0, 8.0, 81)
score_distributions, score_distributions_cis = rly.create_performance_profile(
    atari_200m_normalized_score_dict, atari_200m_thresholds)
# Plot score distributions
fig, ax = plt.subplots(ncols=1, figsize=(7, 5))
plot_utils.plot_performance_profiles(
  score_distributions, atari_200m_thresholds,
  performance_profile_cis=score_distributions_cis,
  colors=dict(zip(algorithms, sns.color_palette('colorblind'))),
  xlabel=r'Human Normalized Score $(\tau)$',
  ax=ax)
The above profile can also be plotted with non-linear scaling as follows:
plot_utils.plot_performance_profiles(
  perf_prof_atari_200m, atari_200m_tau,
  performance_profile_cis=perf_prof_atari_200m_cis,
  use_non_linear_scaling=True,
  xticks = [0.0, 0.5, 1.0, 2.0, 4.0, 8.0]
  colors=dict(zip(algorithms, sns.color_palette('colorblind'))),
  xlabel=r'Human Normalized Score $(\tau)$',
  ax=ax)
Dependencies
The code was tested under Python>=3.7 and uses these packages:
- arch == 5.3.0
- scipy >= 1.7.0
- numpy >= 0.9.0
- absl-py >= 1.16.4
- seaborn >= 0.11.2
Citing
If you find this open source release useful, please reference in your paper:
@article{agarwal2021deep,
  title={Deep Reinforcement Learning at the Edge of the Statistical Precipice},
  author={Agarwal, Rishabh and Schwarzer, Max and Castro, Pablo Samuel
          and Courville, Aaron and Bellemare, Marc G},
  journal={Advances in Neural Information Processing Systems},
  year={2021}
}
Disclaimer: This is not an official Google product.
1 maintainer

Metadata
1 maintainer
Release files for rliable-fork 1.2.0
For a detailed explanation of source distributions (sdists) and built distributions (wheels), please see the package formats documentation.
Source distribution (sdist)
| File | Size | Uploaded | |
|---|---|---|---|
| rliable_fork-1.2.0.tar.gz | 21.2 kB | Details |
Release files / rliable_fork-1.2.0.tar.gz
| Download URL | rliable_fork-1.2.0.tar.gz |
|---|---|
| Size | 21.2 kB |
| Tags | Source |
|
SHA-256 checksum How to use checksums |
ac5ada251413835a36562765555e07e7fc1fbe08c4d258d8dde4248c8ce7c3a8
|
|
BLAKE2b-256 checksum How to use checksums |
7c0e57c490cddfca8a65e3b0508974b5007dc33f0efd3e130b297aacc863e3a4
|
| Upload date | |
|
Uploaded using Trusted Publishing? What is trusted publishing? |
No |
| Uploaded via |
twine/5.1.1 CPython/3.11.4
|













