Open-source SAE visualizer, based on Anthropic's published visualizer.
Project description
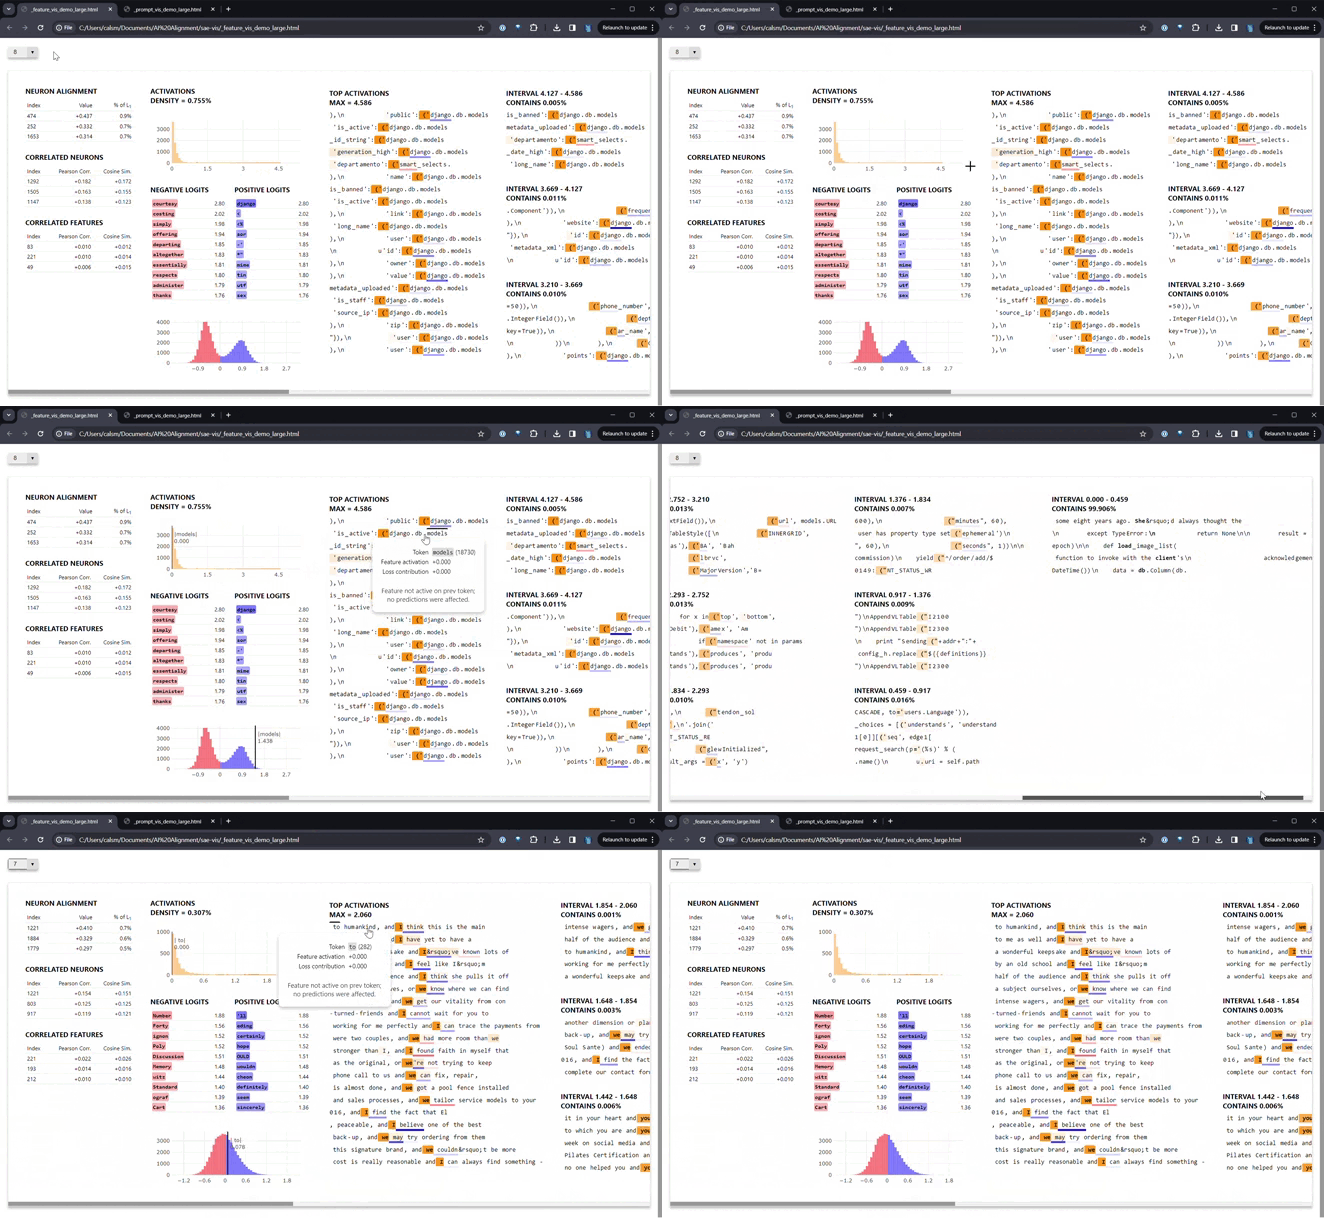
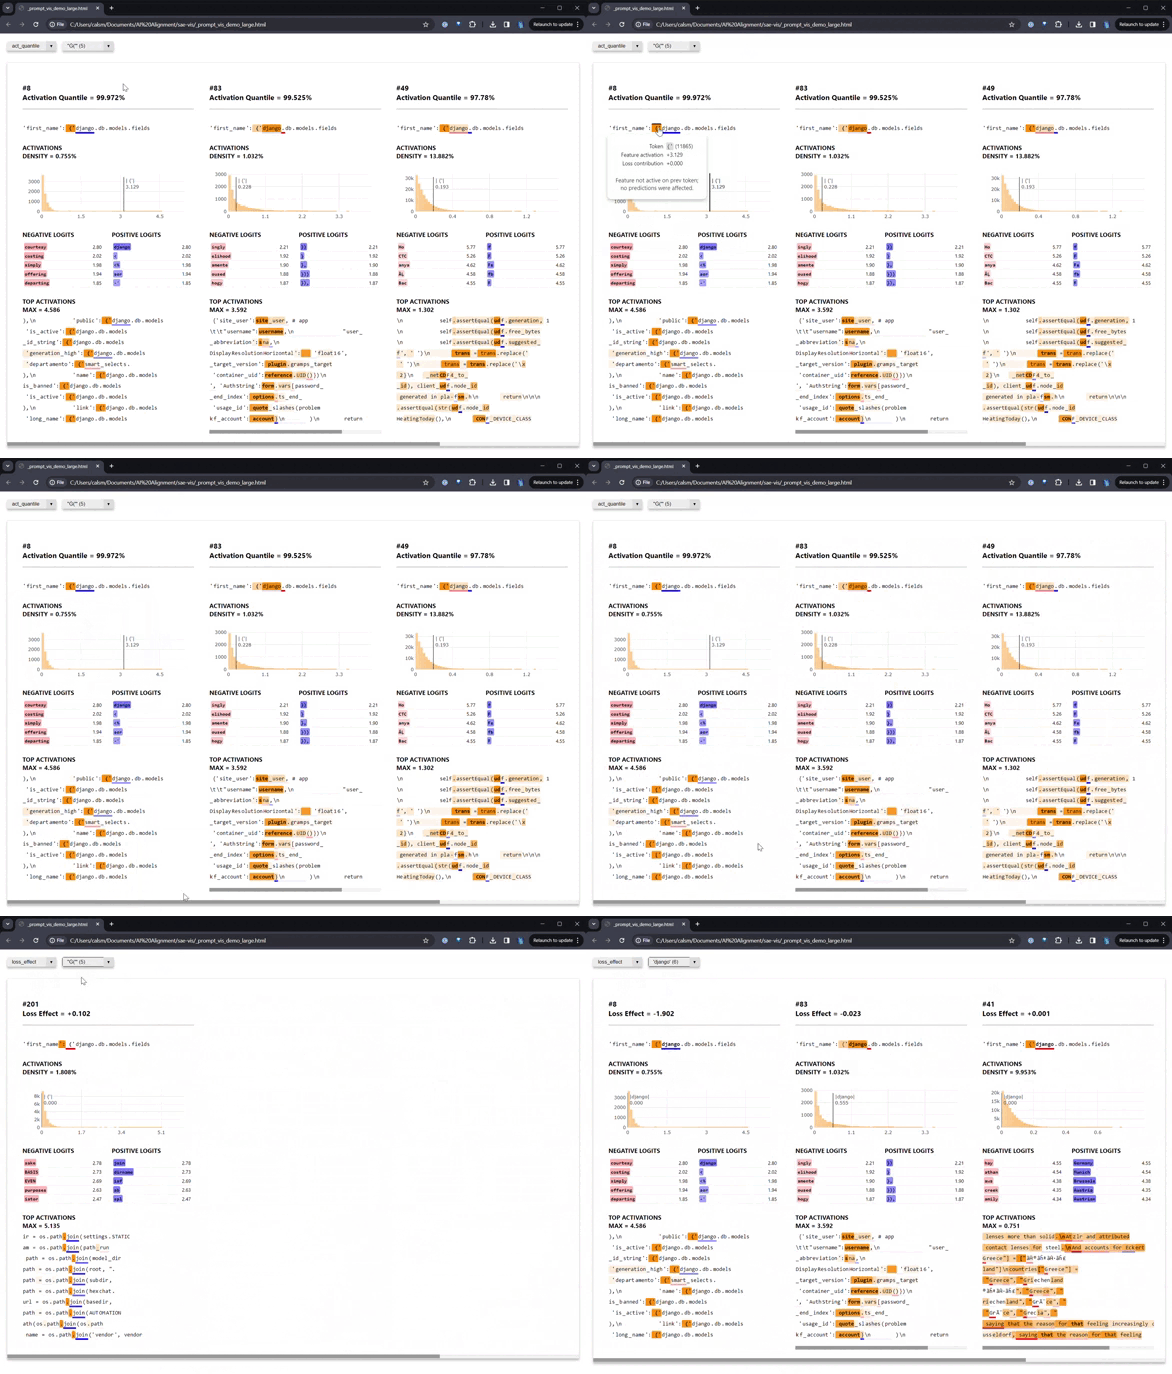
This codebase was designed to replicate Anthropic's sparse autoencoder visualisations, which you can see here. The codebase provides 2 different views: a feature-centric view (which is like the one in the link, i.e. we look at one particular feature and see things like which tokens fire strongest on that feature) and a prompt-centric view (where we look at once particular prompt and see which features fire strongest on that prompt according to a variety of different metrics).
Install with pip install sae-vis. Link to PyPI page here.
Features & Links
Important note - this repo was significantly restructured in March 2024 (we'll remove this message at the end of April). The recent changes include:
- The ability to view multiple features on the same page (rather than just one feature at a time)
- D3-backed visualisations (which can do things like add lines to histograms as you hover over tokens)
- More freedom to customize exactly what the visualisation looks like (we provide full cutomizability, rather than just being able to change certain parameters)
Here is a link to a Google Drive folder containing 3 files:
- User Guide, which covers the basics of how to use the repo (the core essentials haven't changed much from the previous version, but there are significantly more features)
- Dev Guide, which we recommend for anyone who wants to understand how the repo works (and make edits to it)
- Demo, which is a Colab notebook that gives a few examples
In the demo Colab, we show the two different types of vis which are supported by this library:
- Feature-centric vis, where you look at a single feature and see e.g. which sequences in a large dataset this feature fires strongest on.

- Prompt-centric vis, where you input a custom prompt and see which features score highest on that prompt, according to a variety of possible metrics.

Citing this work
To cite this work, you can use this bibtex citation:
@misc{sae_vis,
    title  = {{SAE Visualizer}},
    author = {Callum McDougall},
    howpublished    = {\url{https://github.com/callummcdougall/sae_vis}},
    year   = {2024}
}
Contributing
This project is uses Poetry for dependency management. After cloning the repo, install dependencies with poetry install.
This project uses Ruff for formatting and linting, and Pyright for type-checking. If you submit a PR, make sure that your code passes all checks. You can run all check with make check-all.
Version history (recording started at 0.2.9)
0.2.9- added table for pairwise feature correlations (not just encoder-B correlations)0.2.10- fix some anomalous characters0.2.11- update PyPI with longer description0.2.12- fix height parameter of config, add videos to PyPI description0.2.13- add to dependencies, and fix SAELens section0.2.14- fix mistake in dependencies0.2.15- refactor to support eventual scatterplot-based feature browser, fix’HTML0.2.16- allow disabling buffer in feature generation, fix demo notebook, fix sae-lens compatibility & type checking0.2.17- use main branch ofsae-lens
Project details
Release history Release notifications | RSS feed
Download files
Download the file for your platform. If you're not sure which to choose, learn more about installing packages.


