
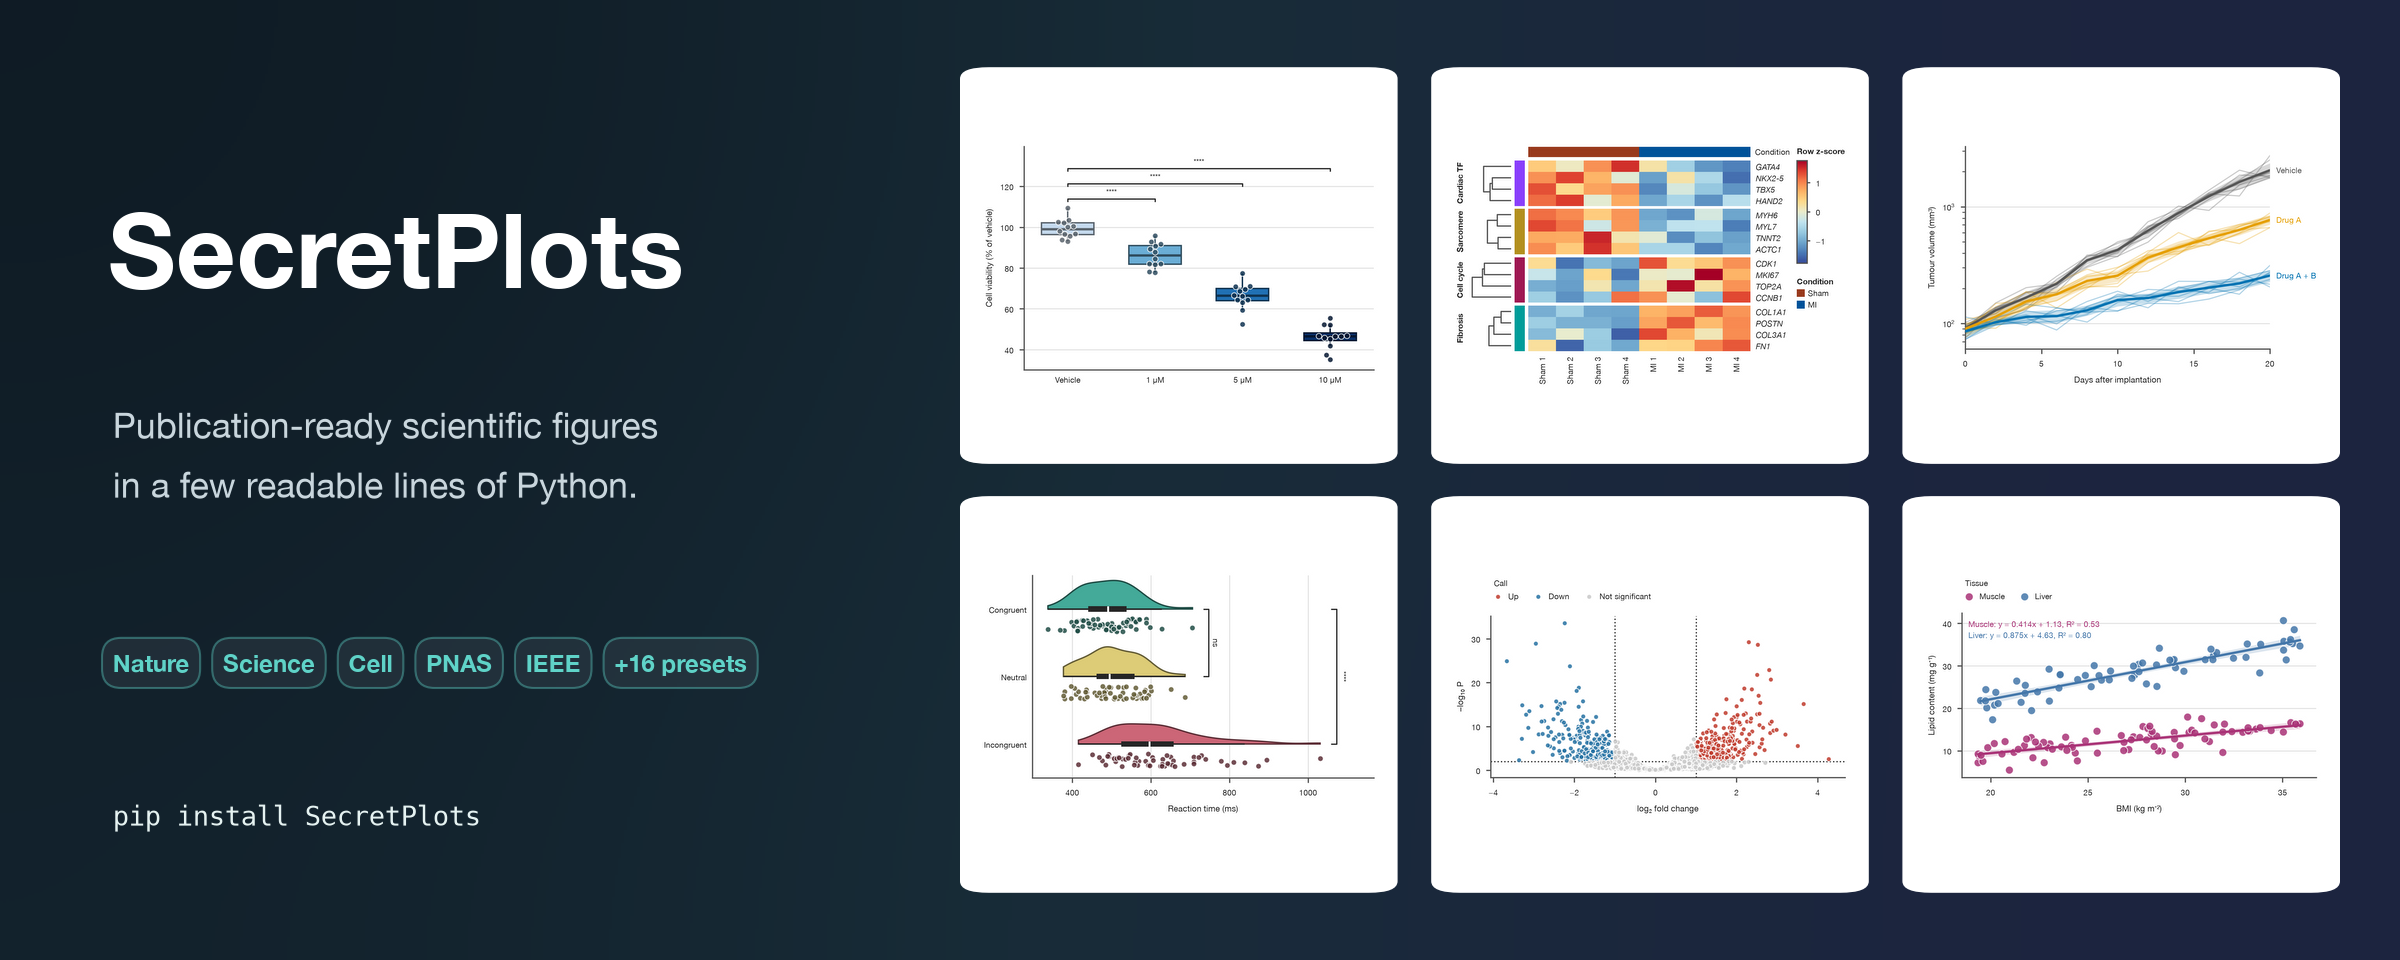
SecretPlots
Publication-ready scientific figures in a few readable lines of Python.
Journal presets · statistics built in · colour-blind-safe palettes · fonts embedded




Documentation · Gallery · Journal-ready figures · Changelog · Report a bug
Same calls, better figure
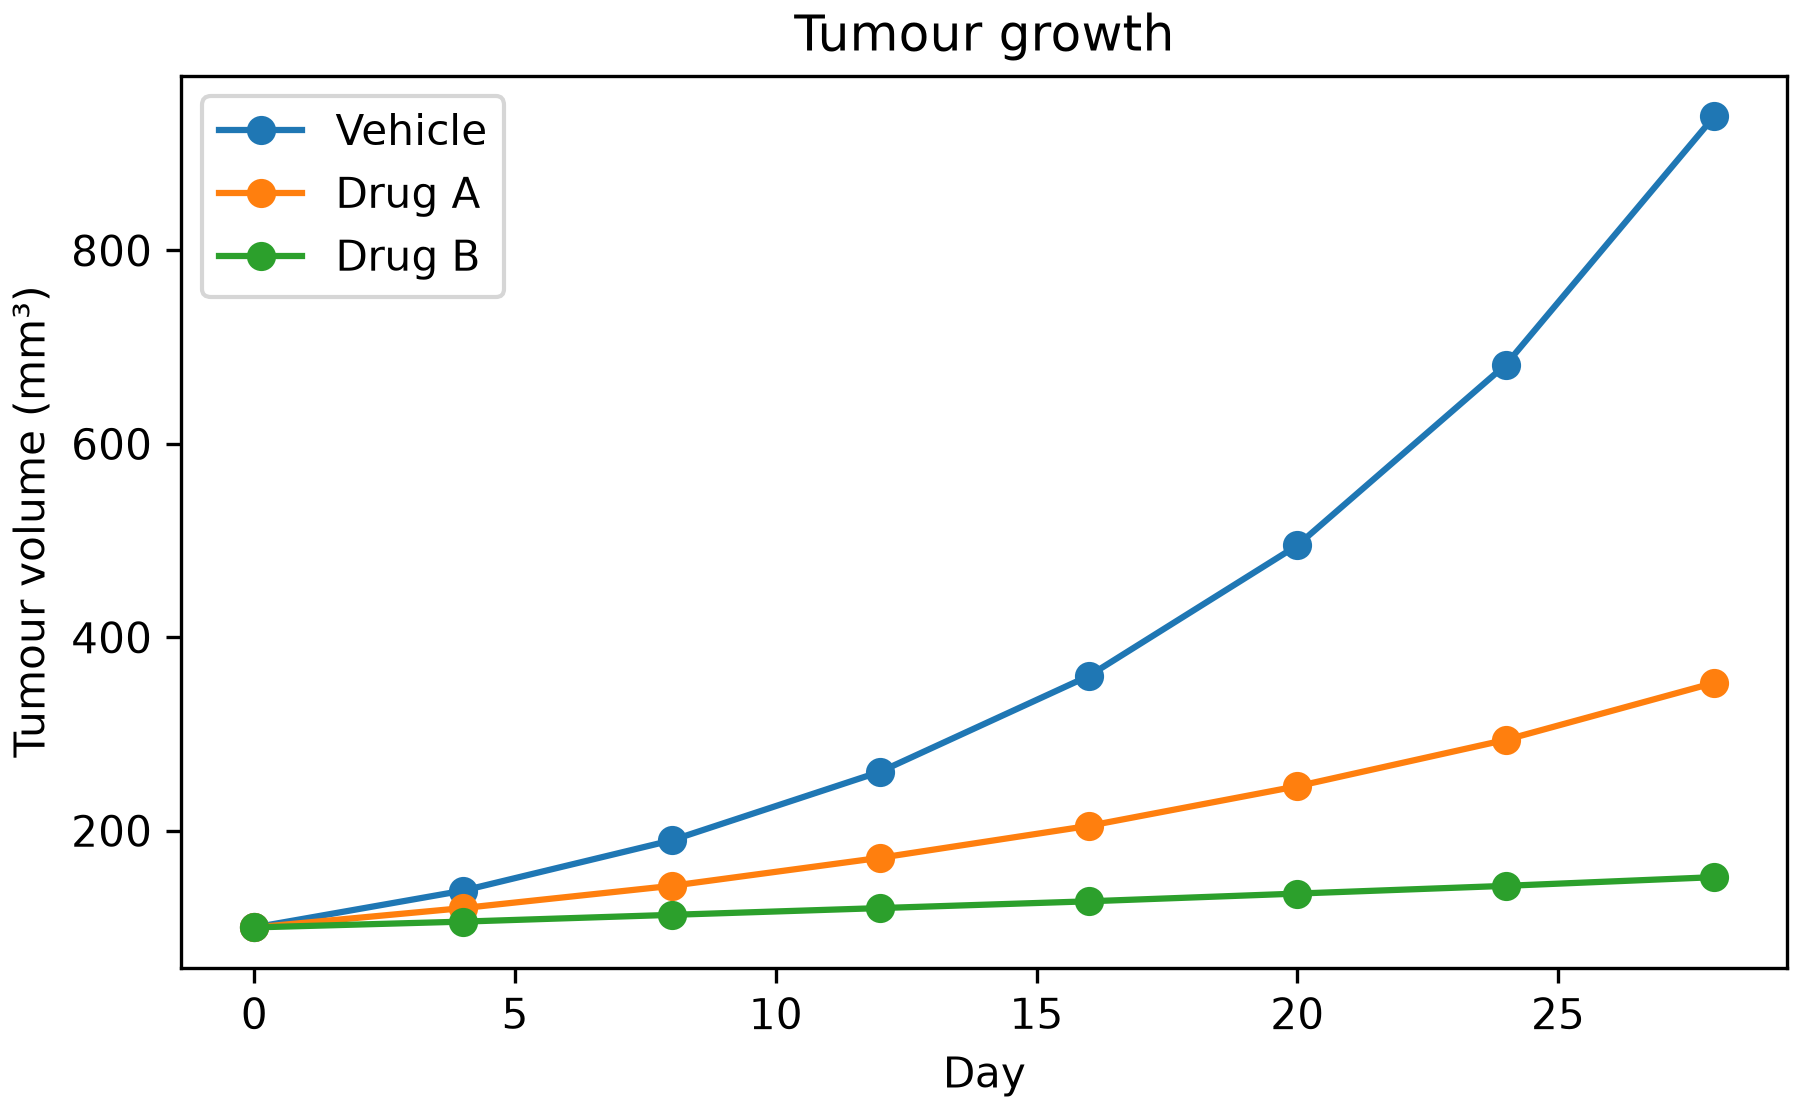
If you can write matplotlib, you can write SecretPlots. Same data, same figure size, no styling code on either side:
| matplotlib | SecretPlots |
|---|---|
import matplotlib.pyplot as plt

fig, ax = plt.subplots(figsize=(6, 3.7),
                       layout="constrained")
for arm, g in tumours.groupby("arm", sort=False):
    ax.plot(g["day"], g["volume"],
            marker="o", label=arm)
ax.set(xlabel="Day",
       ylabel="Tumour volume (mm³)",
       title="Tumour growth")
ax.legend()
|
import SecretPlots as sp

(
    sp.plot(tumours, x="day", y="volume",
            hue="arm")
    .markers()
    .labels(x="Day",
            y="Tumour volume (mm³)",
            title="Tumour growth")
)
|
 |
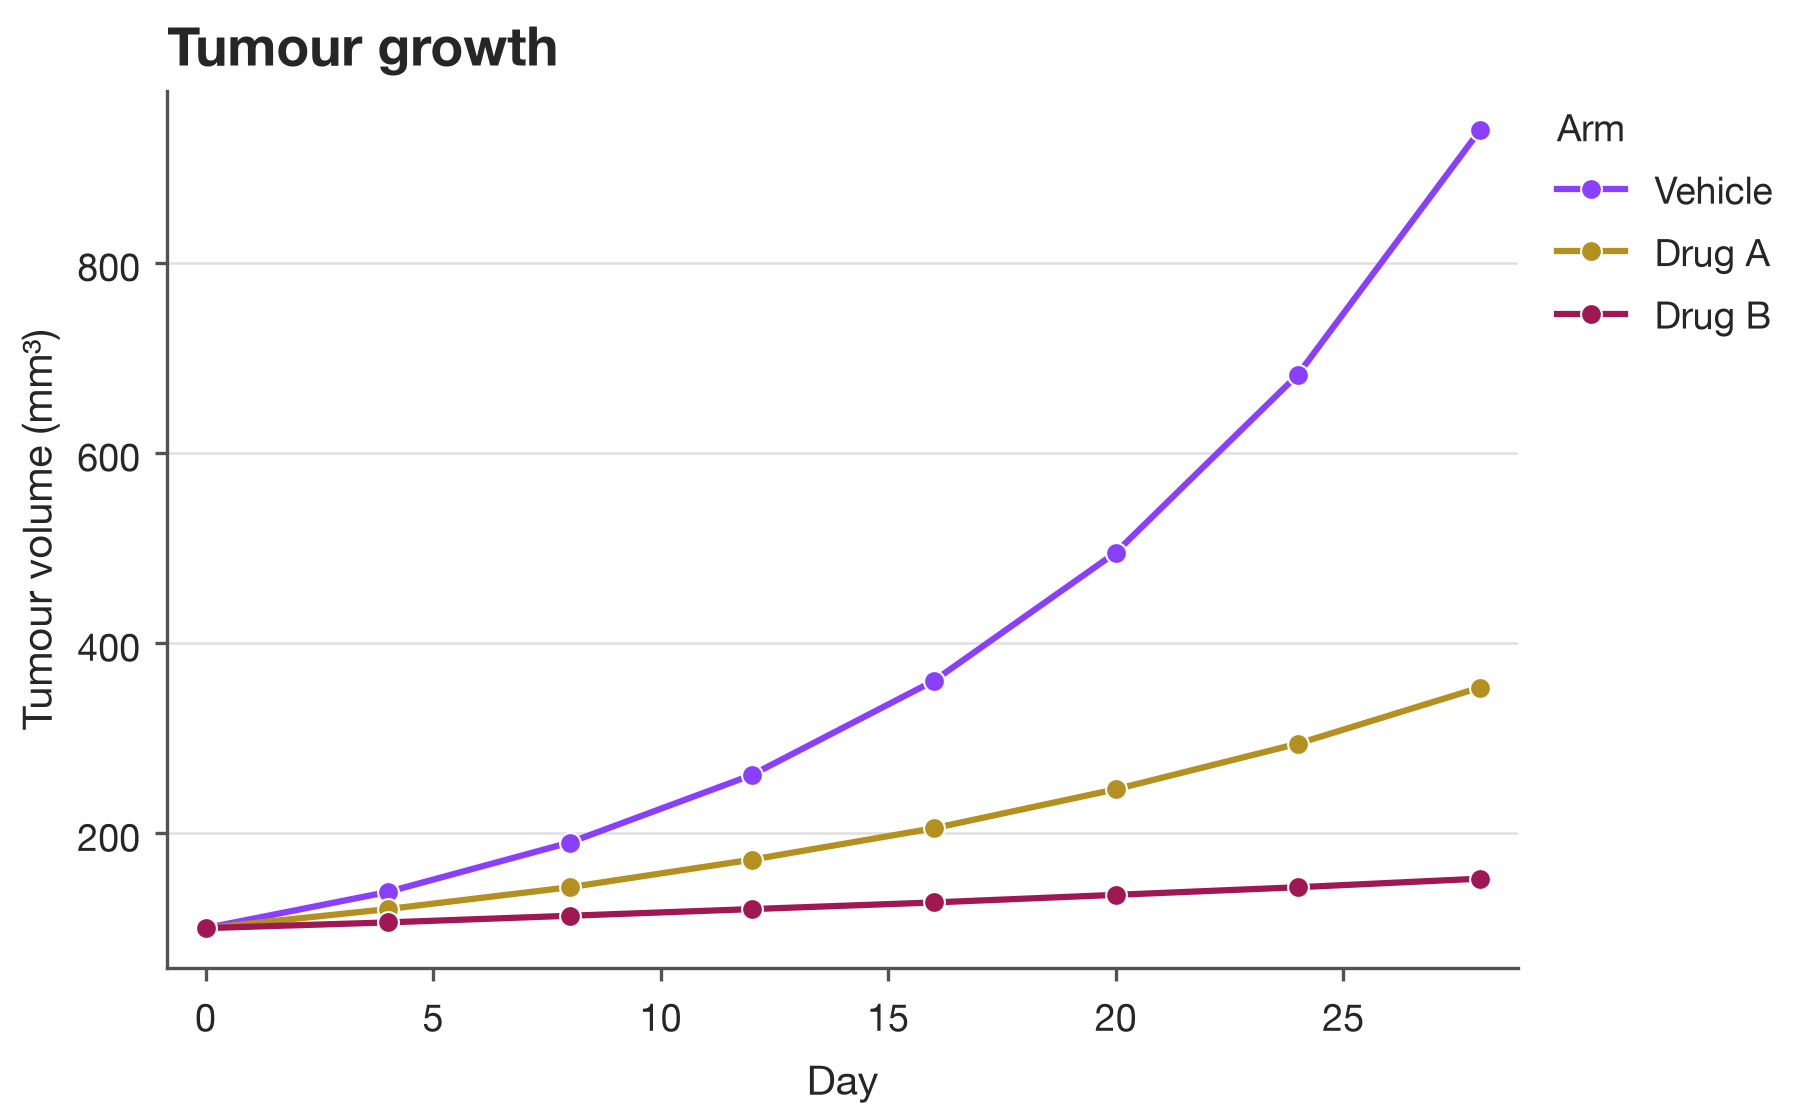 |
You get a colour-blind-safe palette, a quiet grid, a titled legend outside the
data and readable type without touching rcParams. From there, one more step
labels the lines directly (.endlabels()), one argument summarises replicate
animals with confidence bands (error="ci"), and one line makes it a journal
figure.
From table to journal figure
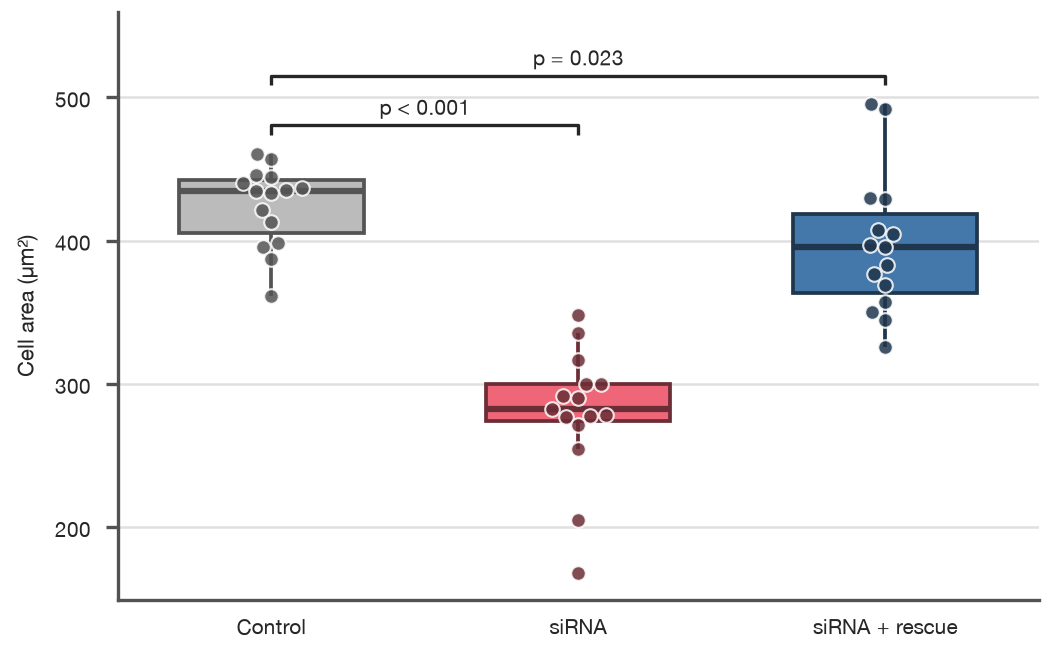
import SecretPlots as sp

sp.use(preset="nature")                         # 89 mm column, 5–7 pt text, 300 dpi

(
    sp.box(cells, x="treatment", y="area")
    .points()                                   # show every cell
    .compare(ref="Control", correction="holm")  # significance brackets
    .colors({"Control": "#BBBBBB", "siRNA": "#EE6677", "siRNA + rescue": "#4477AA"})
    .labels(x="", y="Cell area (µm²)")
    .save("figure1.pdf")                        # fonts embedded, ready to upload
)
Why SecretPlots?
- Journal presets. Nature, Science, Cell, PNAS, AHA, Elsevier, Springer, IEEE, ACM and NeurIPS presets set column widths, font limits, dpi and file formats from each publisher's author guidelines.
- Statistics where you need them. Significance brackets with Holm or
Bonferroni correction, confidence bands, percentile intervals of the
observations, linear fits with R², KDEs and hierarchical clustering. Most
plots return their computed numbers as tables (
.source_data(),.test_results()). - Every observation visible. Points over boxes, individual trajectories under means, rainclouds and rugs, the patterns reviewers ask for with small samples.
- Colour-blind safe. Palettes and colormaps come from
SecretColors. Unsafe maps are
flagged, and a
print-bwtheme renders the figure in greys. - Readable, chainable API. One constructor plus small steps.
plot.arguments()lists what the constructor takes,plot.options()every step, andplot.options("legend")explains one. - Honest defaults. Missing data raises instead of being silently dropped.
Font and palette fallbacks are reported, and
plot.explain("font_size")says where any style value came from.
Installation
pip install SecretPlots # or: uv add SecretPlots
Requires Python 3.12+. Depends only on matplotlib, numpy, pandas and SecretColors.
Version 3 is a ground-up rewrite and is not compatible with the 0.1.x
releases; pin SecretPlots<1 if you depend on the old API.
Gallery
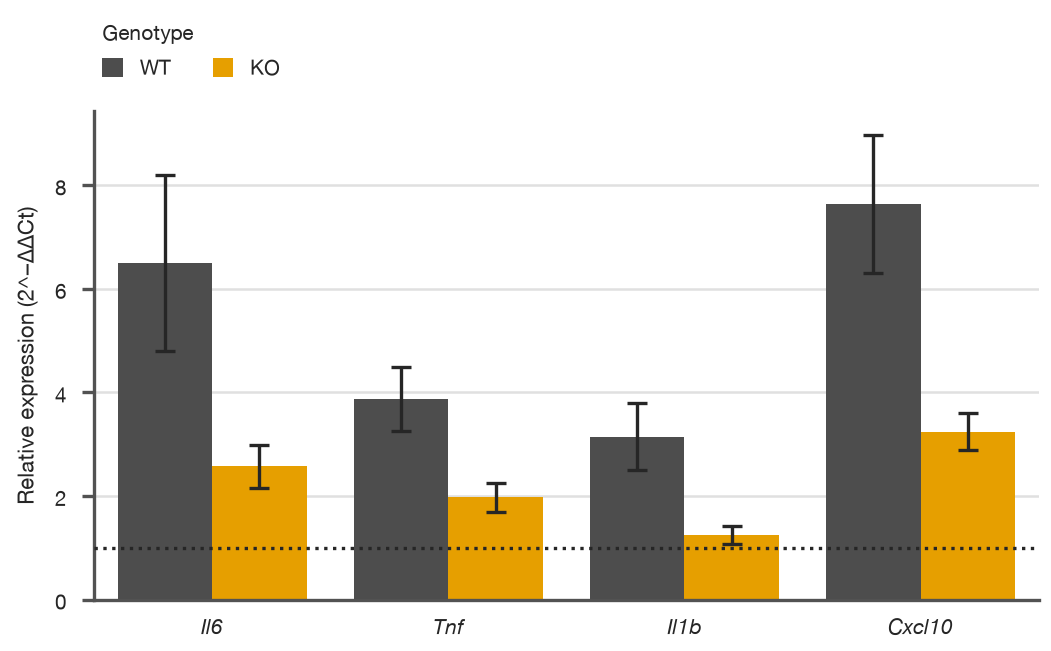
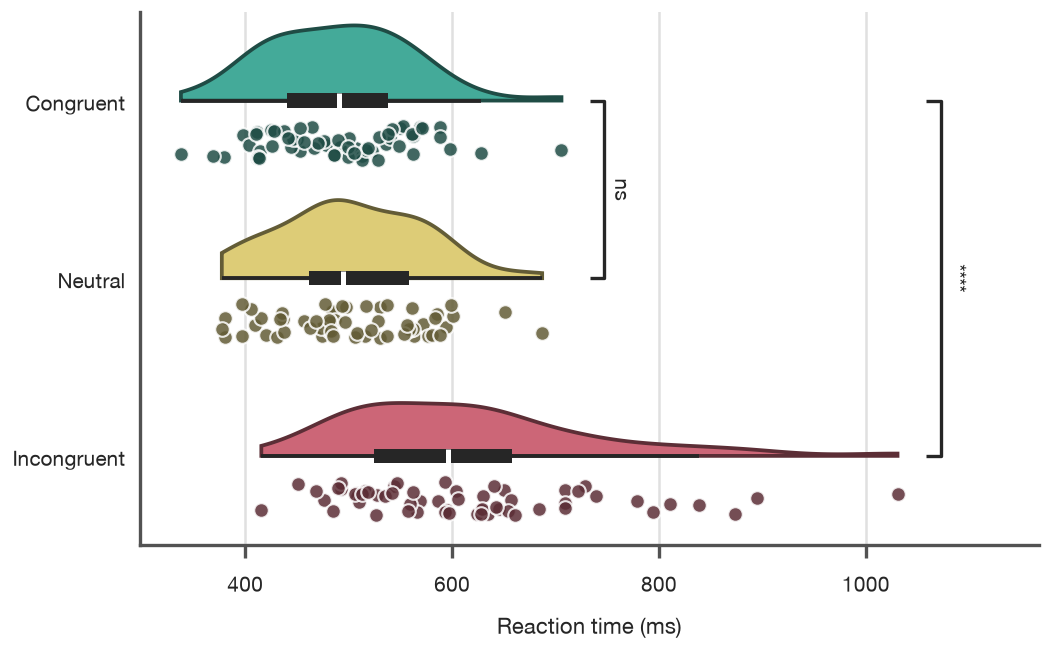
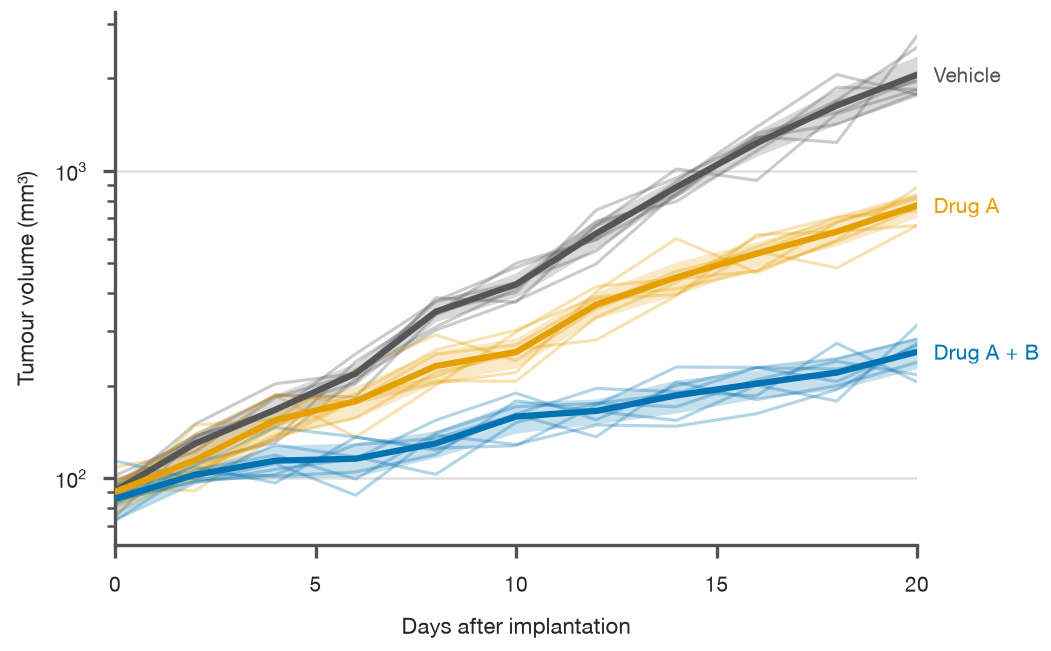
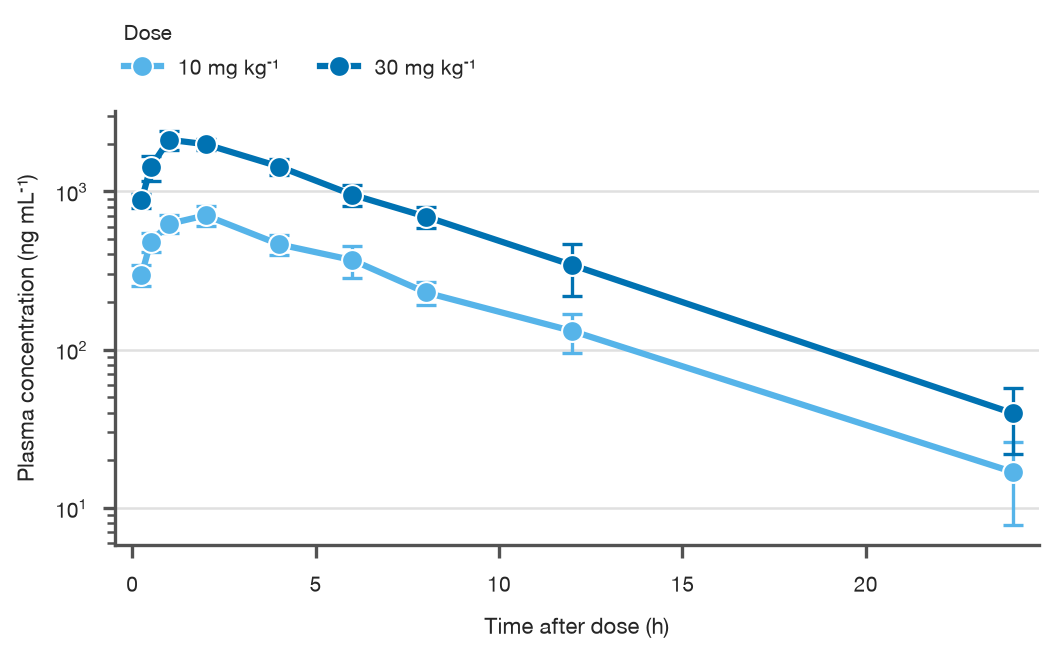
Every image below is unretouched SecretPlots output at Nature single-column size. The gallery has the complete, runnable code for each.
Compare groups and conditions
 |
 |
sp.bar(qpcr, x="gene", y="fold", hue="genotype", error="sd").refline(1, linestyle=":").ticklabels(italic=True)
sp.raincloud(stroop, x="condition", y="rt").compare(ref="Congruent", format="stars")
Follow change over time
 |
 |
sp.line(tumours, x="day", y="volume", hue="arm", units="mouse", error="ci").endlabels().log("y")
sp.line(pk, x="hours", y="conc", hue="dose", error="sd").errorbars("bars").markers().log("y")
Find the pattern in a matrix
 |
 |
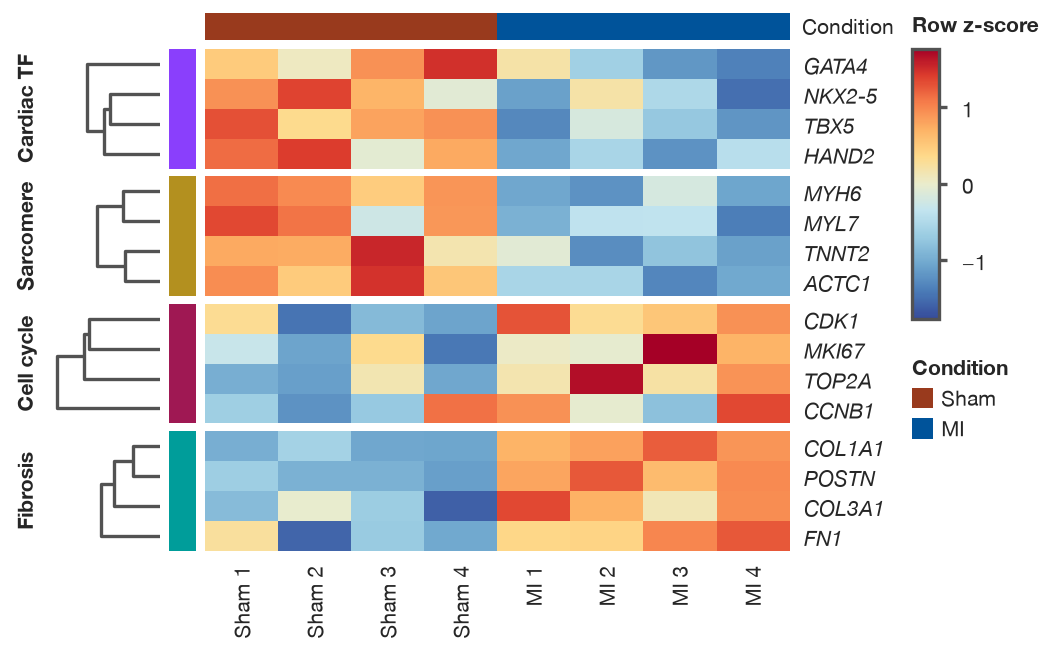
sp.heatmap(expression).scale("row").groups(rows="pathway").cluster(cols=False).tracks(cols={"Condition": condition})
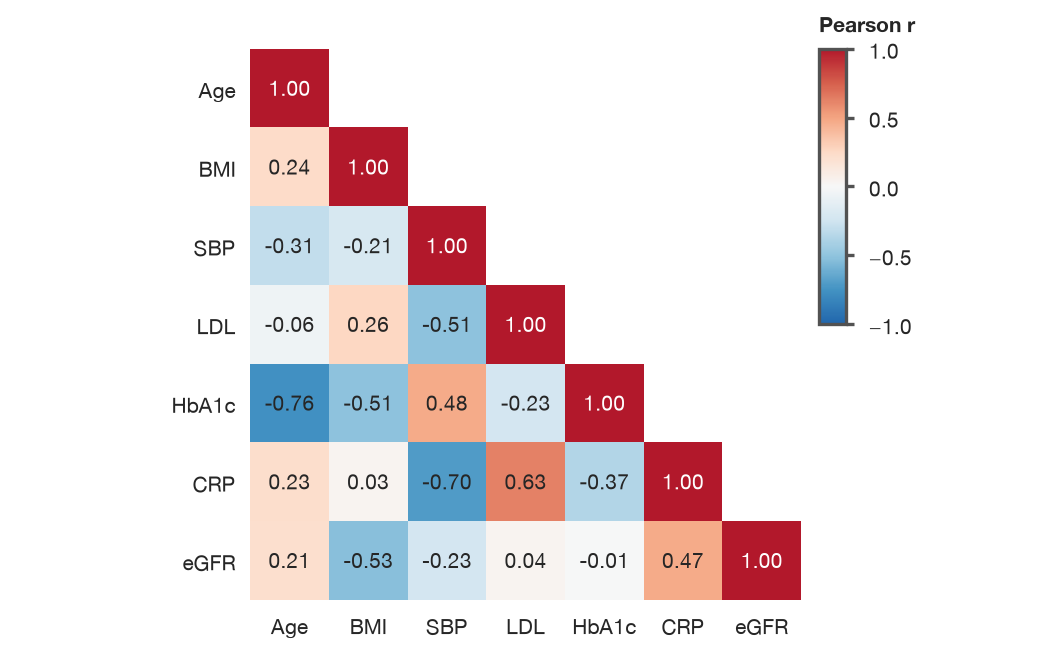
sp.heatmap(cohort.corr(), square=True).mask("upper").cmap("tol_bu_rd", center=0).values(".2f")
Relationships and distributions
 |
 |
 |
 |
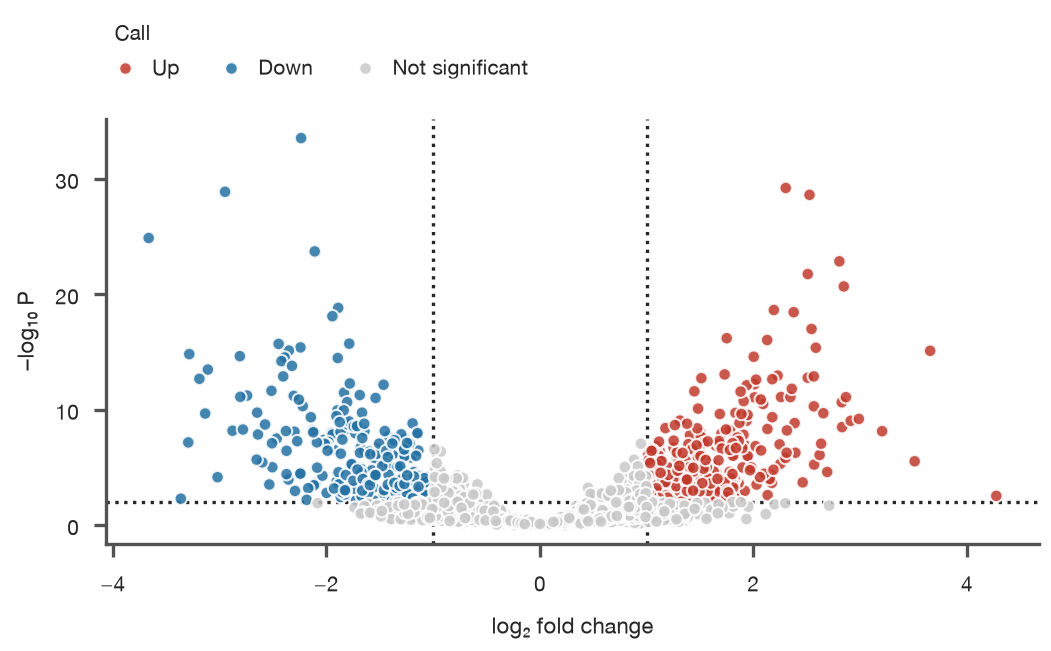
sp.scatter(genes, x="lfc", y="log_p", hue="call").refline(-1, 1, axis="x").refline(2, axis="y")
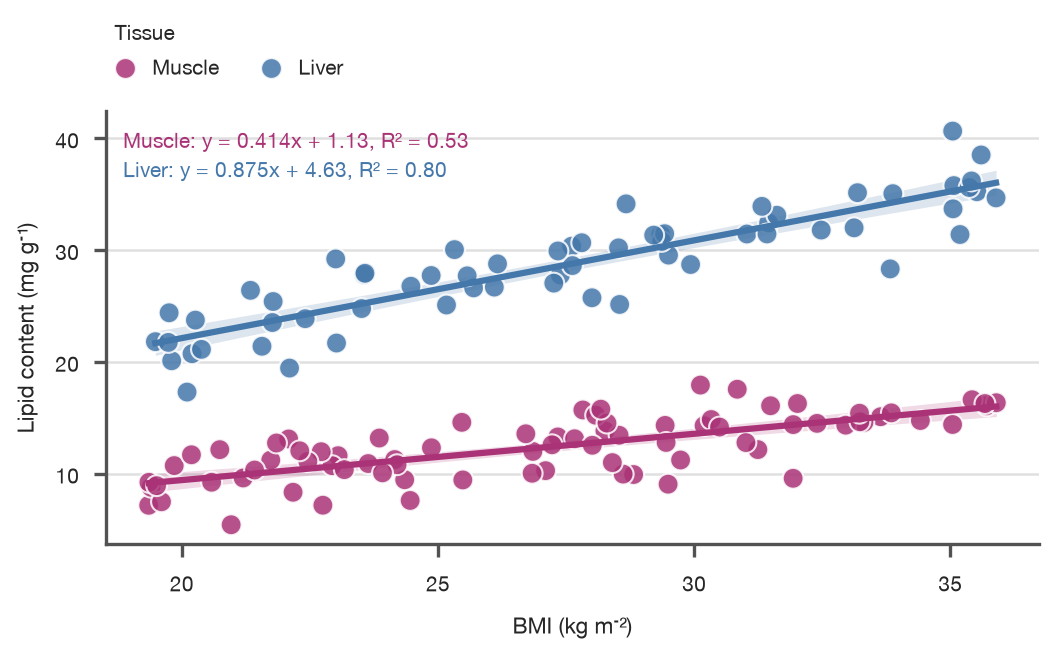
sp.scatter(biopsies, x="bmi", y="lipid", hue="tissue").fit("linear", stats=True)
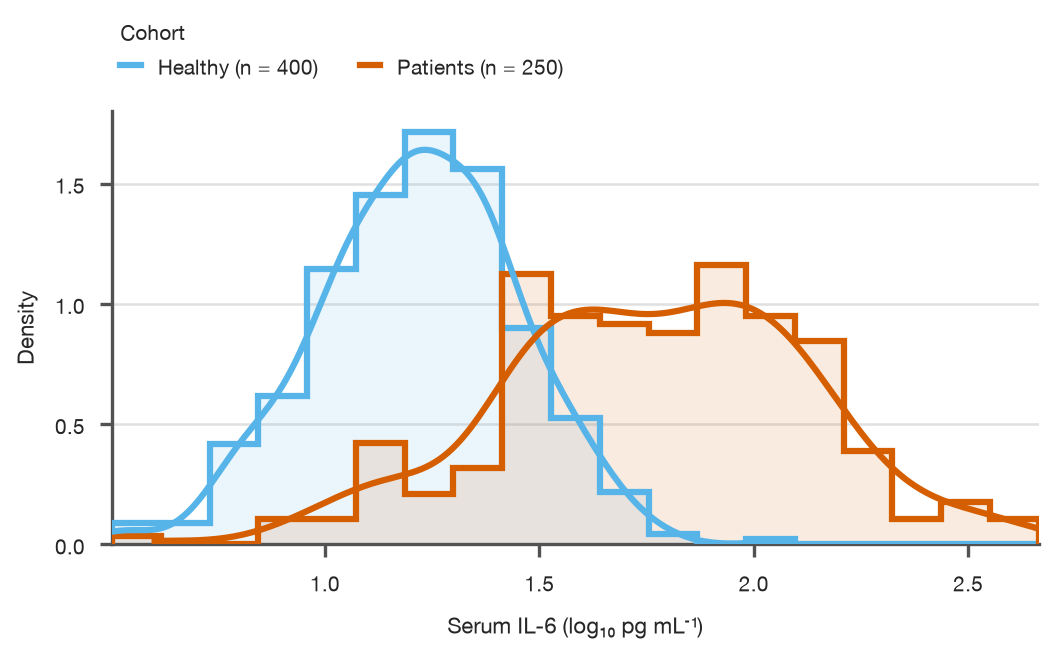
sp.histogram(serum, x="level", hue="cohort", stat="density").kde().show_n()
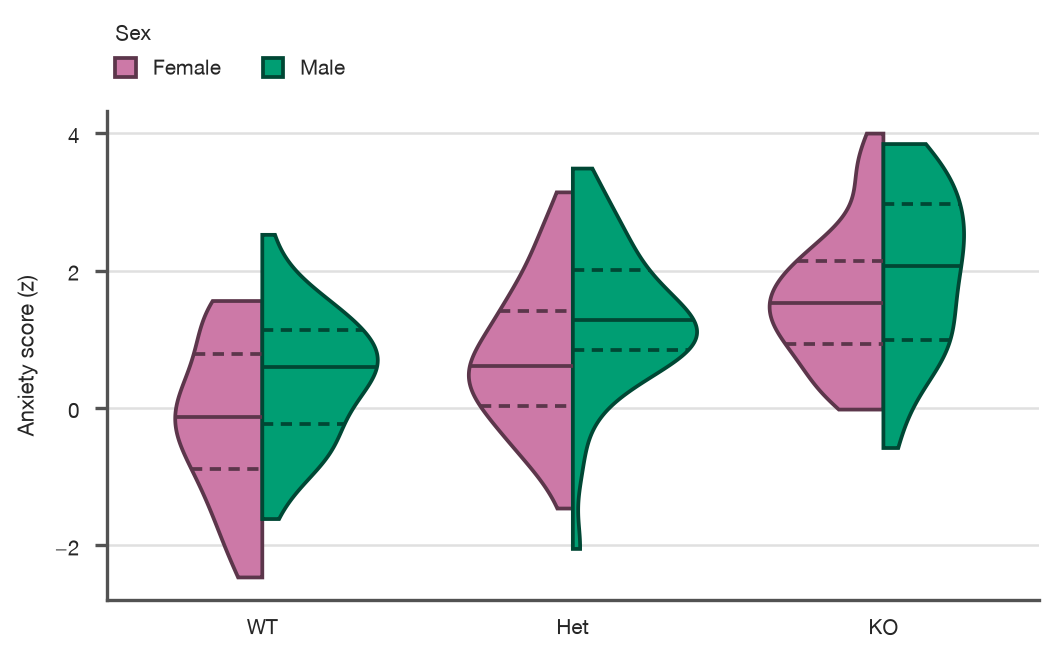
sp.violin(behaviour, x="genotype", y="score", hue="sex", split=True, inner="quartiles")
Clinical results
 |
 |
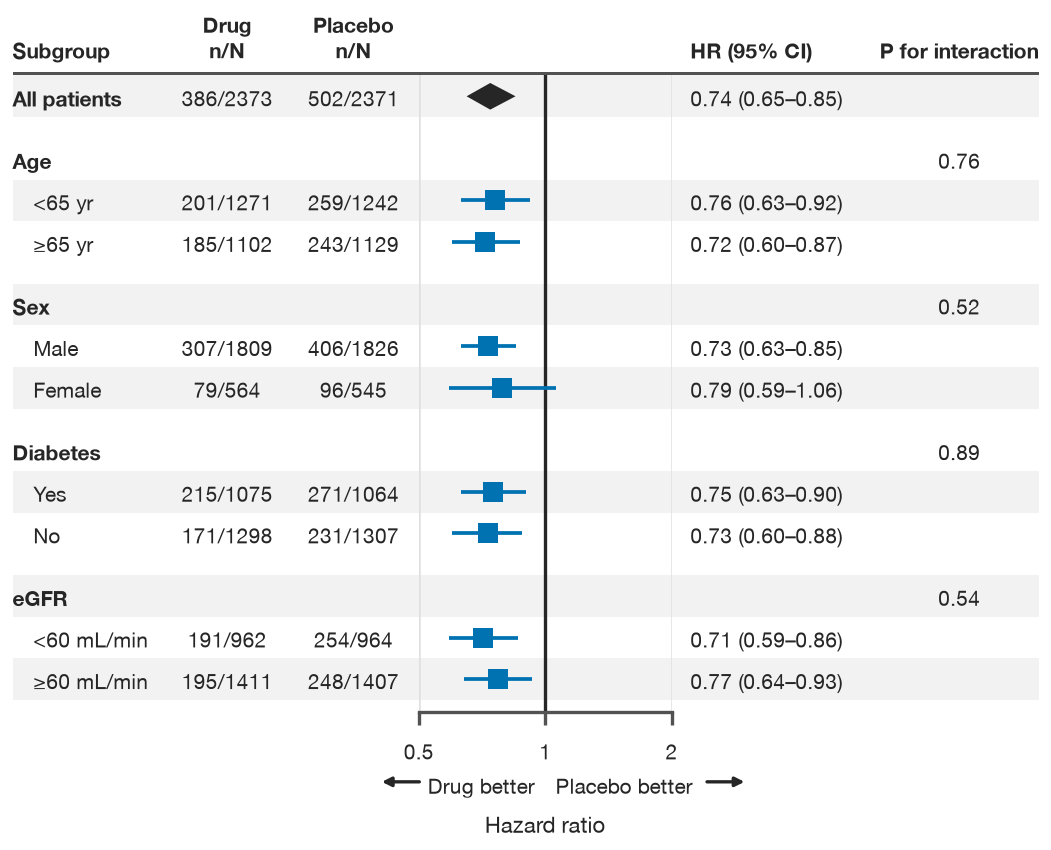
sp.forest(trial, label="subgroup", estimate="hr", lower="lower", upper="upper", group="variable").summary("All patients").table(left={"Drug": "drug"})
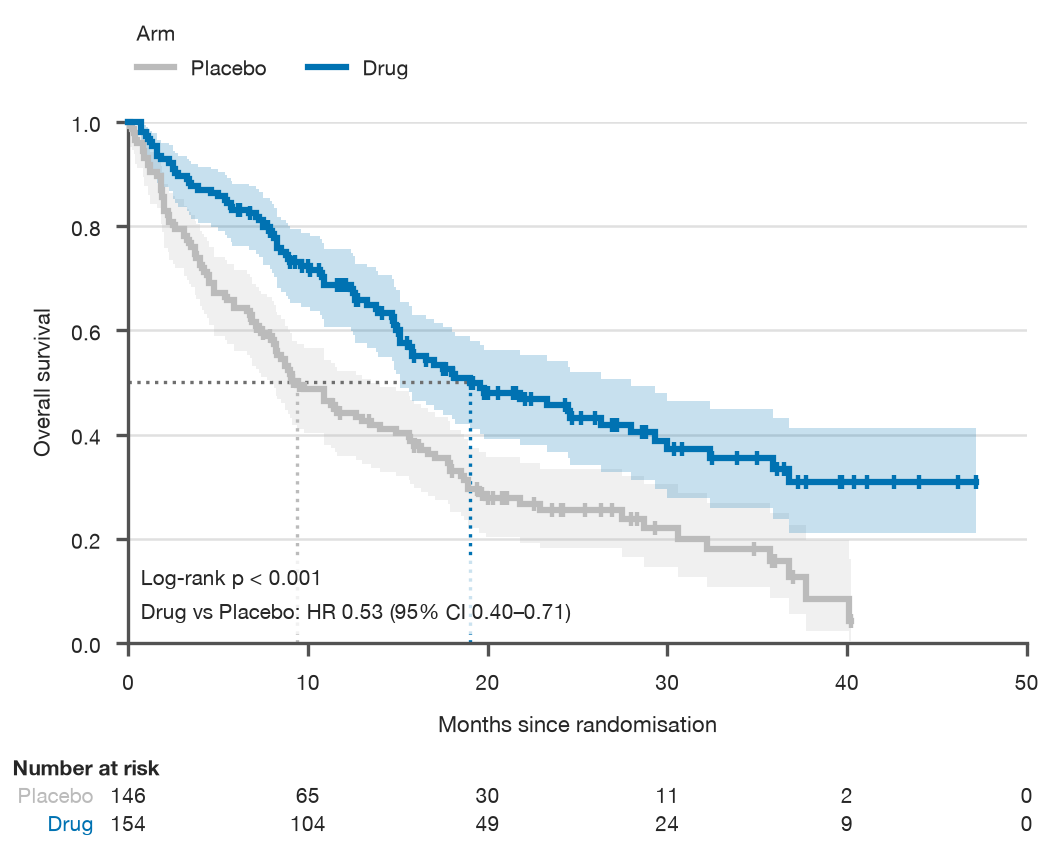
sp.survival(patients, time="months", event="died", hue="arm").risk_table().median().pvalue().hazard_ratio()
One figure, any journal
Presets describe where a figure is going; themes describe how it looks. Switch either one without touching your plotting code:
sp.use(preset="nature")                    # for the whole session
plot.preset("ieee")                        # or for one plot
plot.size(width="double", height="60mm")   # the journal's named widths, or any length
plot.theme("print-bw").encode_groups()     # greyscale with dashes and markers
| Kind | Presets |
|---|---|
| Journals | nature · science · cell · pnas · aha · elsevier · springer · ieee · acm · neurips |
| Everyday | screen (default) · web · a4 · letter · slide-16x9 · poster |
| Newsroom | bbc · ft-like · economist-like · nyt-like · wapo-like |
Journal presets cite the guidelines they were built from. If you set a value
outside a journal's limits, you get a LimitExceededWarning instead of a
silent change. Newsroom presets ending in -like are inspired by publicly
visible chart conventions; they are not affiliated with those publishers and
use open fallback fonts. You can write your own preset
in a few lines of TOML.
Plot types
sp.bar |
Means, sums or values per category; error bars, groups, stacks, value labels |
sp.scatter |
Colour, size and marker encodings; linear and LOWESS fits |
sp.line |
Means with CI/SD/SEM/PI bands, fan charts, individual units, end labels |
sp.area, sp.fill_between |
Stacked and 100% areas, envelopes, split by sign, gradients |
sp.histogram |
Counts, percent or density; KDE, rug, cumulative, layered, stacked or dodged |
sp.heatmap |
Colormaps, z-scoring, clustering, groups, annotation tracks, masks |
sp.forest |
Subgroup and meta-analysis forest plots with tables, sections, summary diamonds, weights and side-by-side panels |
sp.survival |
Kaplan-Meier, cumulative incidence and cumulative hazard; risk tables, censor ticks, medians, log-rank tests and hazard ratios |
sp.box |
Points, means, sample sizes, significance brackets |
sp.violin, sp.raincloud |
Split violins, inner box/quartiles, half-violin rainclouds |
Find any option without leaving Python
No need to open the docs or call help(). Every plot type describes itself as a
table you can read or search:
sp.BarPlot.arguments()          # what sp.bar(...) accepts: allowed values, defaults
sp.BarPlot.arguments("error")   # one argument
plot.options()                  # every chainable step for this plot
plot.options("legend")          # one step's parameters, allowed values and defaults
sp.theme_options()              # every style field accepted by .theme(...)
plot.explain("font_size")       # where a style value came from
Development
uv sync --group dev --group docs
uv run pre-commit install
uv run pytest --mpl                       # tests, including image comparisons
uv run python scripts/render_docs.py      # regenerate documentation figures
uv run mkdocs serve                       # preview the documentation
See CONTRIBUTING.md for adding presets and documentation. Bug reports, preset requests and pull requests are very welcome.
License
MIT © Rohit Suratekar and contributors. Colour palettes and colormaps by SecretColors.
1 maintainer

Metadata
1 maintainer
Release files for SecretPlots 3.0.0
For a detailed explanation of source distributions (sdists) and built distributions (wheels), please see the package formats documentation.
Source distribution (sdist)
| File | Size | Uploaded | Provenance | Actions |
|---|---|---|---|---|
| secretplots-3.0.0.tar.gz | 651.5 kB | Without provenance | Details for secretplots-3.0.0.tar.gz |
Built distribution (wheel)
| File | Interpreter | ABI | Platform | Actions Reset |
|---|---|---|---|---|
| secretplots-3.0.0-py3-none-any.whl | Python 3 | none | any | Details for secretplots-3.0.0-py3-none-any.whl |
Total release size: 853.2 kB
Release files / secretplots-3.0.0.tar.gz
| Download URL | secretplots-3.0.0.tar.gz |
|---|---|
| Size | 651.5 kB |
| Tags | Source |
|
SHA-256 checksum How to use checksums |
f2b9fde97a7fdedf61754e5d78738273f7324ceec9e6ee4c30e8338a87dee979
|
|
BLAKE2b-256 checksum How to use checksums |
53398671e55723b5b4d65e2c2e03abdc8d71f8f8f83d37bacf81cdd232d6fb2f
|
| Upload date | |
|
Uploaded using Trusted Publishing? What is trusted publishing? |
No |
| Uploaded via |
uv/0.13.5 {"installer":{"name":"uv","version":"0.13.5","subcommand":["publish"]},"python":null,"implementation":{"name":null,"version":null},"distro":{"name":"macOS","version":null,"id":null,"libc":null},"system":{"name":null,"release":null},"cpu":null,"openssl_version":null,"setuptools_version":null,"rustc_version":null,"ci":null}
|
Release files / secretplots-3.0.0-py3-none-any.whl
| Download URL | secretplots-3.0.0-py3-none-any.whl |
|---|---|
| Size | 201.7 kB |
| Tags | Python 3 |
|
SHA-256 checksum How to use checksums |
364d36a0bf76aab39e9b545f282bf986ea7ca1cb93110b8d44c68886a78a9551
|
|
BLAKE2b-256 checksum How to use checksums |
b6ef4c382b3cf926d5dccbc05dba1b51c196ee4a3374ecb0844eedea42860dbb
|
| Upload date | |
|
Uploaded using Trusted Publishing? What is trusted publishing? |
No |
| Uploaded via |
uv/0.13.5 {"installer":{"name":"uv","version":"0.13.5","subcommand":["publish"]},"python":null,"implementation":{"name":null,"version":null},"distro":{"name":"macOS","version":null,"id":null,"libc":null},"system":{"name":null,"release":null},"cpu":null,"openssl_version":null,"setuptools_version":null,"rustc_version":null,"ci":null}
|
Security for SecretPlots 3.0.0
Provenance
Provenance describes where a file came from. On PyPI, provenance is shared via attestations, which provide a verifiable record of the build or publishing details. View details, limitations and caveats.
No provenance found
None of the files in this release were uploaded with provenance metadata.
A note on package security
PyPI is a repository for distributing packages, not a service for auditing them. While third-party security researchers and our staff do their best to detect and remove malicious packages, PyPI cannot guarantee the quality, security or suitability of any given package.
To learn more about protecting yourself from malicious actors, visit our package security documentation.














