
segretini-matplottini
A collection of Matplotlib and Seaborn recipes and utilities collected over years of colorful plot-making, to help researchers create publication-ready plots with ease.
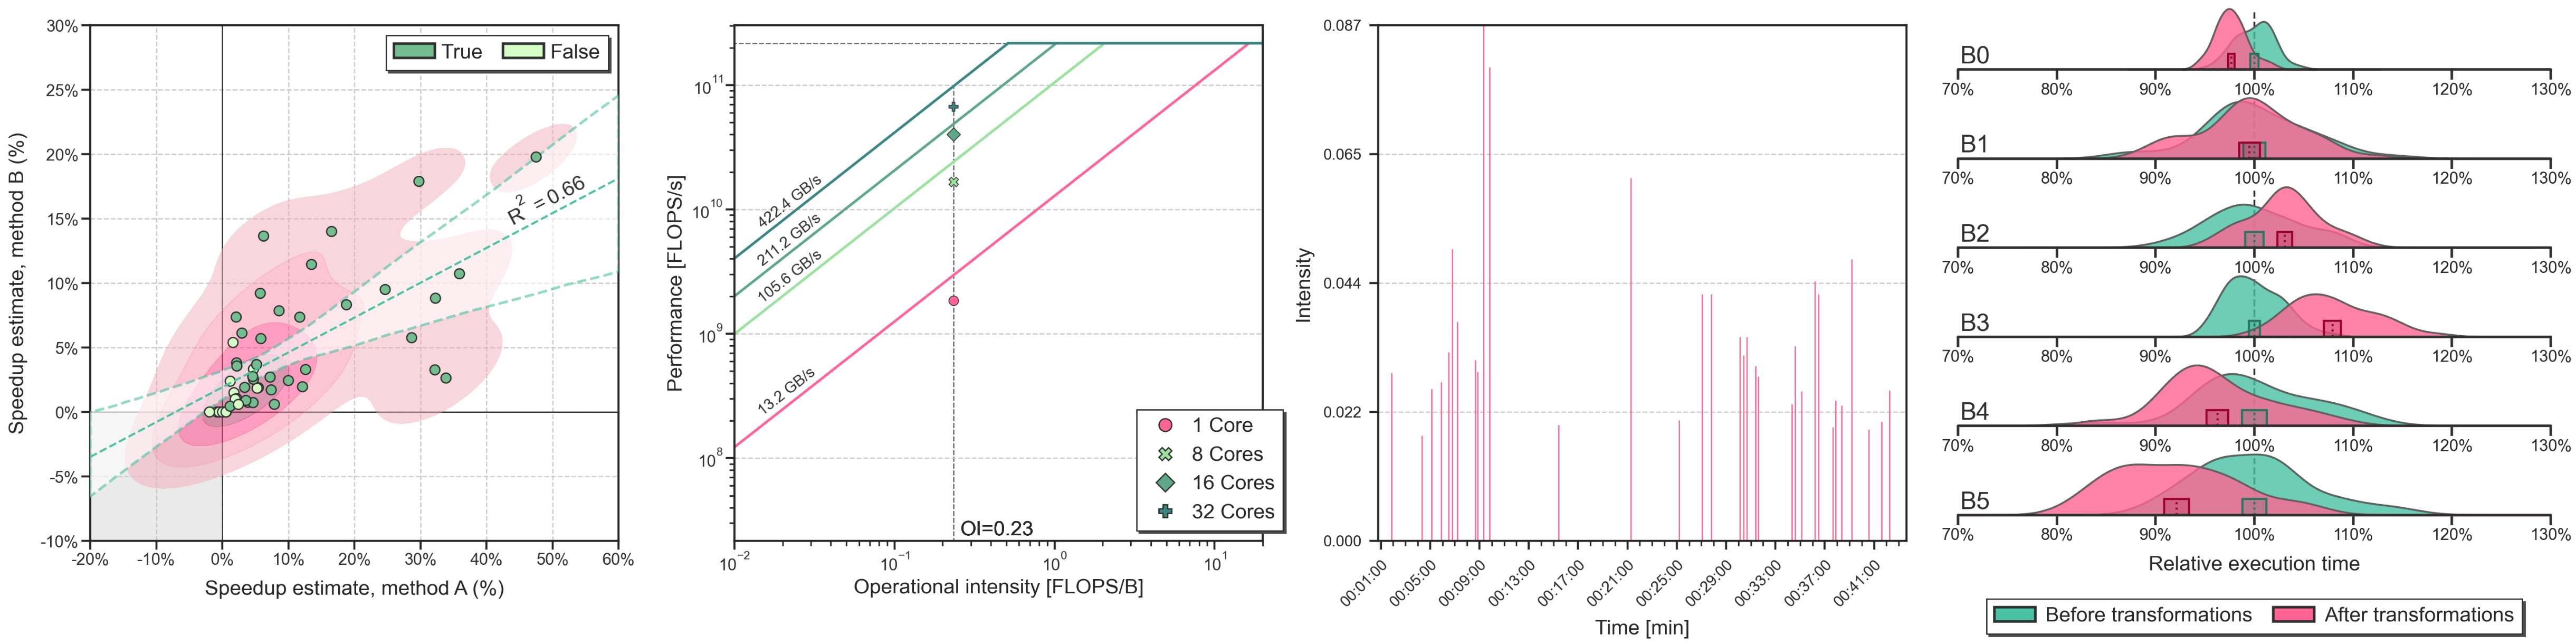
👇 For example, a correlation_scatterplot, a stacked roofline plot, a timeseries plot with stems, and a ridgeplot. Find other examples below!
🚂 Installation
What do you want do to with segretini-matplottini? Pick the installation that suits you best.
I want to use segretini-matplottini as a package in my projects
Install segretini-matplottini with pip.
pip install segretini-matplottini
I want to run the examples
Clone the repository and install segretini-matplottini with pip. You might want to do so in a dedicated conda environment.
git clone https://github.com/AlbertoParravicini/segretini-matplottini.git
cd segretini-matplottini
conda create -n segretini_matplottini python=3.9
conda activate segretini_matplottini
pip install -e .
I want to run the examples and the notebooks
If you want to play with notebooks, also install jupyter.
pip install ".[notebook]"
I like segretini-matplottini so much that I want to contribute to it
Jump ahead to the Development notes section!
✍️ Repository Structure
These are the most important folders of segretini-matplottini, so you won't get lost when exploring the code.
segretini-matplottini (this folder)
    ├── segretini_matplottini
    │   ├── plot              -> Ready-made plotting functions (e.g. ridgeplots, and Roofline plots)
    │   └── utils             -> Other setup files (constants, metadata, etc.)
    │       ├── constants.py  -> Default values for shared settings (font size, DPI, etc.)
    │       ├── colors.py     -> List of predefined and pretty colors, plus color-related utilities
    │       ├── data.py       -> Utilities to preprocess datasets (e.g. outlier removal)
    │       ├── legend.py     -> Legend-related utilities (e.g. custom legend styles)
    │       └── plot.py       -> General utilities for plotting (e.g. adding labels, saving plots)
    ├── data         -> Sample data used in example plots
    ├── examples     -> Recipes to create fancy plots
    ├── notebooks    -> Jupyter notebooks and tutorials
    ├── plots        -> Plots generated by examples. If you find something cool, check the code in examples
    ├── tests        -> Unit tests and end-to-end tests for plotting functions
    ├── CHANGELOG.md -> List of updates to the codebase. Check here to see what's new
    ├── README.md   -> This file!
    └── (...)       -> Configuration files for linters, and other setup files.
🌞 Getting started
The best way to get started is to check out the plots folder, to find plots generated with segretini-matplottini.
If you find a plot you like, you can find the code to generate it in the examples folder.
📚 Notebooks
If you do not know where to start from, and you do not have a lot of experience with Matplotlib and Seaborn, check out the notebooks folder.
1_getting_started_with_barplots.ipynbprovides an introduction to Matplotlib and Seaborn, and guides the reader into creating a beautiful barplot. You will learn principles that lie behind any great visualization, and the basic concepts of Matplotlib and Seaborn.
🖼️ Some plots available in segretini-matplottini
This is a non-inclusive list of custom plots that are available out-of-the-box in segretini-matplottini.
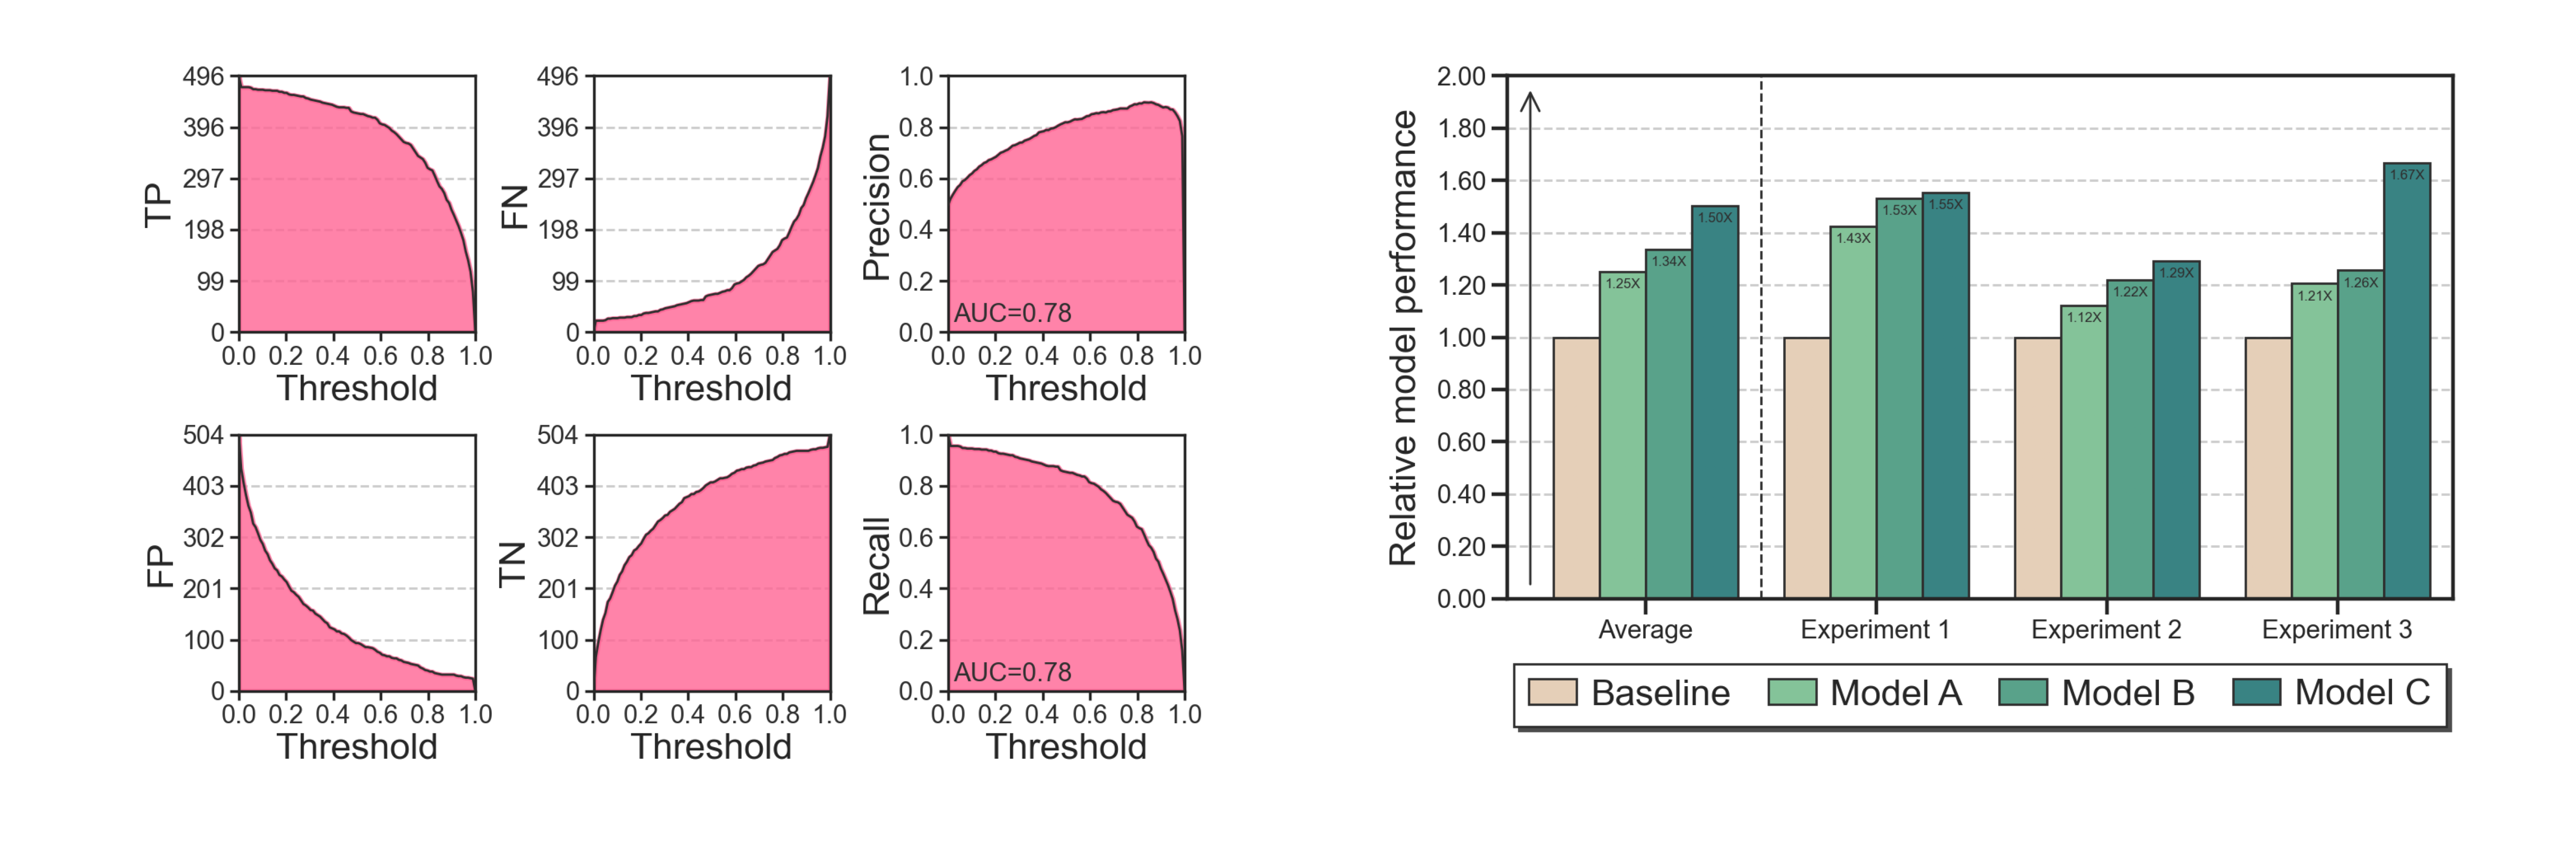
correlation_scatterplotvisualizes the relation between two variables, combining a scatterplot, a 2D density plot, and a linear regression with confidence intervals. Learn more with this example.ridgeplotshows the distribution of two variables, grouped by the specified factor. For example, one can visualize the latency of two implementations of the same algorithm, across multiple runs of different datasets. Learn more with this example.rooflineplots the Roofline model for the input operational intensity and performance values. Learn more with this example.binary_classficationsummarizes the performance of a binary classifier, plotting curves such as ROC, Precision-Recall, and F1 score for different classification thresholds. Learn more with this example.
🧪 Some utilities available in segretini-matplottini
The astute reader might say "Hey, I don't need any of those plots, why should I care about segretini-matplottini?".
There's a lot more than plotting functions! The utils can be applied to any Matplotlib plot, to simplify your life when it comes to creating complex visualizations.
datacontains functions to preprocess your experiment results by removing outliers and computing the relative performance from absolute performance numbers.colorsprovides utilities to convert your palettes to grayscale to check how your plot will look when printed in black-and-white or when seen by a color deficient person, and to simplify the creation of palettes given the start and end colors. It also has plenty of beautiful colors to choose from, validated for black and white printing and color blindness.plotis the source for general plotting utilities, from computing and adding labels to barplots to saving plots with a standardized structure, so they won't get lost or overwritten by accident.
In the examples below, a binary_classification plot with a few of the available sub-plots turned on, and a barplot that takes advantage of the utils to compute relative performance and add labels to bars.
👨🔬 Development notes
If you want to hack segretini-matplottini itself, you will most likely want to clone it with SSH, and install it inside a conda environment, in editable mode with dev dependencies. Also, install the pre-commit hooks to obtain linting and quality checks when creating a commit.
git clone git@github.com:AlbertoParravicini/segretini-matplottini.git
cd segretini-matplottini
conda create -n segretini_matplottini python=3.9
conda activate segretini_matplottini
pip install -e ".[dev,notebook]"
pre-commit install
We use black, mypy, and ruff for formatting, type checking, linting, and sorting imports. Each commit must pass these checks. To run checks manually, run the following commands. Checks also run when creating a commit. You won't be able to commit if a check fails.
black . --config pyproject.toml
mypy . --config mypy.ini
ruff . --fix --config ruff.toml
Building and releasing
New releases of segretini-matplottini are built and uploaded to pypi every time a pull request is merged to master. Remember to update the version field in pyproject.toml, or the release on pypi will fail.
💡 Tips and Tricks
An ever-growing collection of tips I've found or discovered along the way, together with some nice resources I like a lot.
📚 Resources
- Subtleties of Color: a six-part guide on how to pick nice colors and create great palettes, from the Earth Observatory NASA blog.
- Adobe Color: a free web tool to create palettes of different types (shades, complementary, etc.). It also has accessibility tools to test for color blindness safety.
🎨 Colors
Picking the right colors is hard! I found the following tips to be very helpful.
-
Not everyone sees colors in the same way: most reviewers will look at your papers after printing them in black & white. Always check for that! You can use
segretini_matplottini.utils.convert_color_to_grayscaleor do a print preview after saving your plot as PDF. If colors are too similar, try adjusting the L (lightness) in the HSL representation, or the B (brightness) in the HSB representation. Also, a lot of people are color blind, and there are many types of color blindness! It's always better to double-check. To do so, you can usesegretini_matplottini.utils.convert_color_to_deficiency. -
Hidden color biases: people tend to associate implicit meanings with colors. To simplify the matter a lot, green is usually associated with positive things, while red is bad. If your plot is not explicitly comparing classes (for example, you want to show the speed of your algorithm on different datasets), just go for a neutral/positive palette, using colors such as green, blue, and light pink.
-
Add redundant information: if you are plotting many different classes, and use one color per class, it can be difficult to distinguish among them. Instead, add some kind of redundant information. In scatterplots and lineplots you can use different markers (circles, diamonds, etc.), while in barplots you can use different hatches (//// or \\) or add labels to each class.
1 maintainer

Release files for segretini-matplottini 0.4.0
For a detailed explanation of source distributions (sdists) and built distributions (wheels), please see the package formats documentation.
Source distribution (sdist)
| File | Size | Uploaded | |
|---|---|---|---|
| segretini-matplottini-0.4.0.tar.gz | 7.4 MB | Details |
Built distribution (wheel)
| File | Interpreter | ABI | Platform | Reset |
|---|---|---|---|---|
| segretini_matplottini-0.4.0-py3-none-any.whl | Python 3 | none | any | Details |
Total release size: 7.4 MB
Release files / segretini-matplottini-0.4.0.tar.gz
| Download URL | segretini-matplottini-0.4.0.tar.gz |
|---|---|
| Size | 7.4 MB |
| Tags | Source |
|
SHA-256 checksum How to use checksums |
e6db81403d7bd9662a964c29878bc747f3e466fae38b500cf80198661ba6192e
|
|
BLAKE2b-256 checksum How to use checksums |
41841f50322f447d12716d607951998c7662d603849eabceeedf5866c449d626
|
| Upload date | |
|
Uploaded using Trusted Publishing? What is trusted publishing? |
Yes |
| Uploaded via |
twine/4.0.2 CPython/3.11.6
|
Release files / segretini_matplottini-0.4.0-py3-none-any.whl
| Download URL | segretini_matplottini-0.4.0-py3-none-any.whl |
|---|---|
| Size | 52.3 kB |
| Tags | Python 3 |
|
SHA-256 checksum How to use checksums |
88b928c45ba7e68f00d9a90750b9e8f2191e52385b76c61ba5f4f3d2999682db
|
|
BLAKE2b-256 checksum How to use checksums |
043c9166215ec297e4a9dec7ff03b982d02a6ab43d3fafb11dcc3b536bc675b0
|
| Upload date | |
|
Uploaded using Trusted Publishing? What is trusted publishing? |
Yes |
| Uploaded via |
twine/4.0.2 CPython/3.11.6
|














