Simple spectrum image processing toolbox which include functions such as uncurving, and more to come.

Project description
spectrumuncuver
The spectrumuncurver python package is aimed at a specific problem which is often found
in spectrometers which is the curvature of the spectrum data caused by the lenses shape. Some spectrometers have 2D CCD
which allows the sum of the vertical pixels to achieve greater SNR. However, summing while the spectrum is curved
leads to a decrease of the spectral resolution. Thus, to achieve maximum resolution, one would want to uncuve the spectral data.
In addition to this main function, this package provides other function for graphing spectrum for articles. You will find an extensive description of these function below, or more in details in the readthedocs.
Anyone who is willing to contribute is welcome to do so.
email: marc-andre.vigneault.02@hotmail.com
installing the package
you can simply use pip install spectrumuncurver or for those without a pip link to PATH, python -m pip install specturmuncurver.
using the package
To use the package, you have to follow 3 or 4 steps depending on your goal.
- Create a
su = SpectrumUncurver()object. - Load an image into the object.
su.load_image(imagePath: str) - Uncurve the image and choose the algorithm.
su.uncurve_spectrum_image(xlim:List, ylim:List, method='gaussian', fitted=False). You can choose from the following algorithms:maximum,gaussian,quadratic. Thefittedparameter will polyfit the found peaks to ensure smooth uncurving, though not perfectly implemented. - Choose which function interests you from the following functions:
The package has (or will have soon) the following function:
to save/show an image
save_uncurve_image()save_curved_image()save_curved_image_with_fit()save_curving_comparison_image()show_uncurve_image()show_curved_image()show_curved_image_with_fit()show_curving_comparison_image()
to save/show a plot
save_uncurved_spectrum_plot()save_curved_spectrum_plot()save_superposed_spectrum_plot()save_curve_plot()show_uncurved_spectrum_plot()show_curved_spectrum_plot()show_superposed_spectrum_plot()show_curve_plot()
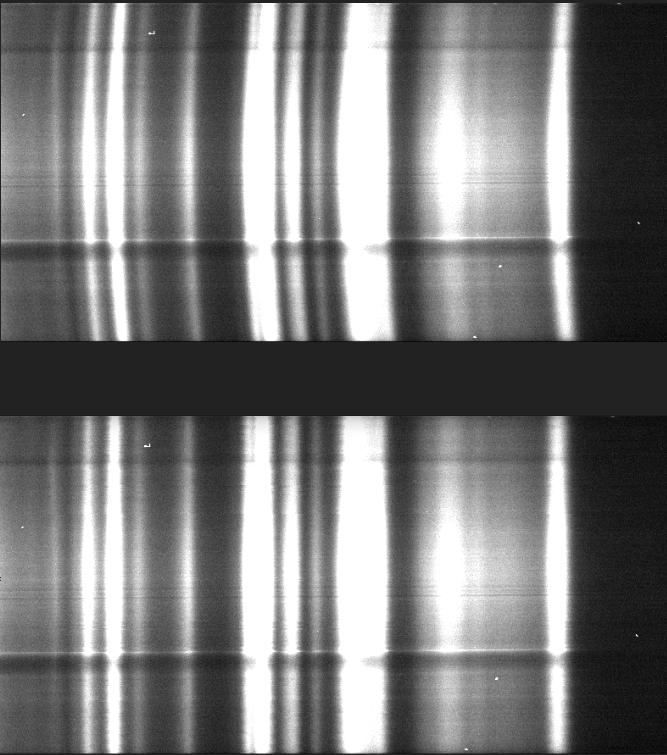
Here is some results achieved with this package:


Download files
Download the file for your platform. If you're not sure which to choose, learn more about installing packages.
Source Distribution
Built Distribution
Filter files by name, interpreter, ABI, and platform.
If you're not sure about the file name format, learn more about wheel file names.
Copy a direct link to the current filters
File details
Details for the file spectrumuncurver-0.1.11.tar.gz.
File metadata
- Download URL: spectrumuncurver-0.1.11.tar.gz
- Upload date:
- Size: 6.2 kB
- Tags: Source
- Uploaded using Trusted Publishing? No
- Uploaded via: twine/3.2.0 pkginfo/1.5.0.1 requests/2.24.0 setuptools/49.2.1 requests-toolbelt/0.9.1 tqdm/4.48.2 CPython/3.7.8
File hashes
| Algorithm | Hash digest | |
|---|---|---|
| SHA256 |
d6c08d54cea7e5fbdab5e59f0fa323e61a3208cd2bca16d304756dd579ff19ee
|
|
| MD5 |
b6857b5063b07f3e155bd1bd99feddd7
|
|
| BLAKE2b-256 |
d93914e74aa7f75608515c878559273eadee210971577b079885b74f7d29af9b
|
File details
Details for the file spectrumuncurver-0.1.11-py3-none-any.whl.
File metadata
- Download URL: spectrumuncurver-0.1.11-py3-none-any.whl
- Upload date:
- Size: 11.5 kB
- Tags: Python 3
- Uploaded using Trusted Publishing? No
- Uploaded via: twine/3.2.0 pkginfo/1.5.0.1 requests/2.24.0 setuptools/49.2.1 requests-toolbelt/0.9.1 tqdm/4.48.2 CPython/3.7.8
File hashes
| Algorithm | Hash digest | |
|---|---|---|
| SHA256 |
ebd4b526a1cb0831e1fcf3b44c8dbb1117785cc51f8f0a5eebc174efa5153cc6
|
|
| MD5 |
e1bbdbeb11f7fa150ad5d5837212beba
|
|
| BLAKE2b-256 |
79f549070d127516fcf05b1fa15fec7f8eaffc00444979c9a0e96b33fa855cef
|


