No project description provided

Project description
SplatStats


This codebase works in tandem with the s3s package to refactor and analayze Splatoon 3's data. When finished, it will be able to load s3s package json files, re-shape them, and visualize the data from battles history.
Have a look at our documentation for more information on how to install and use this package!
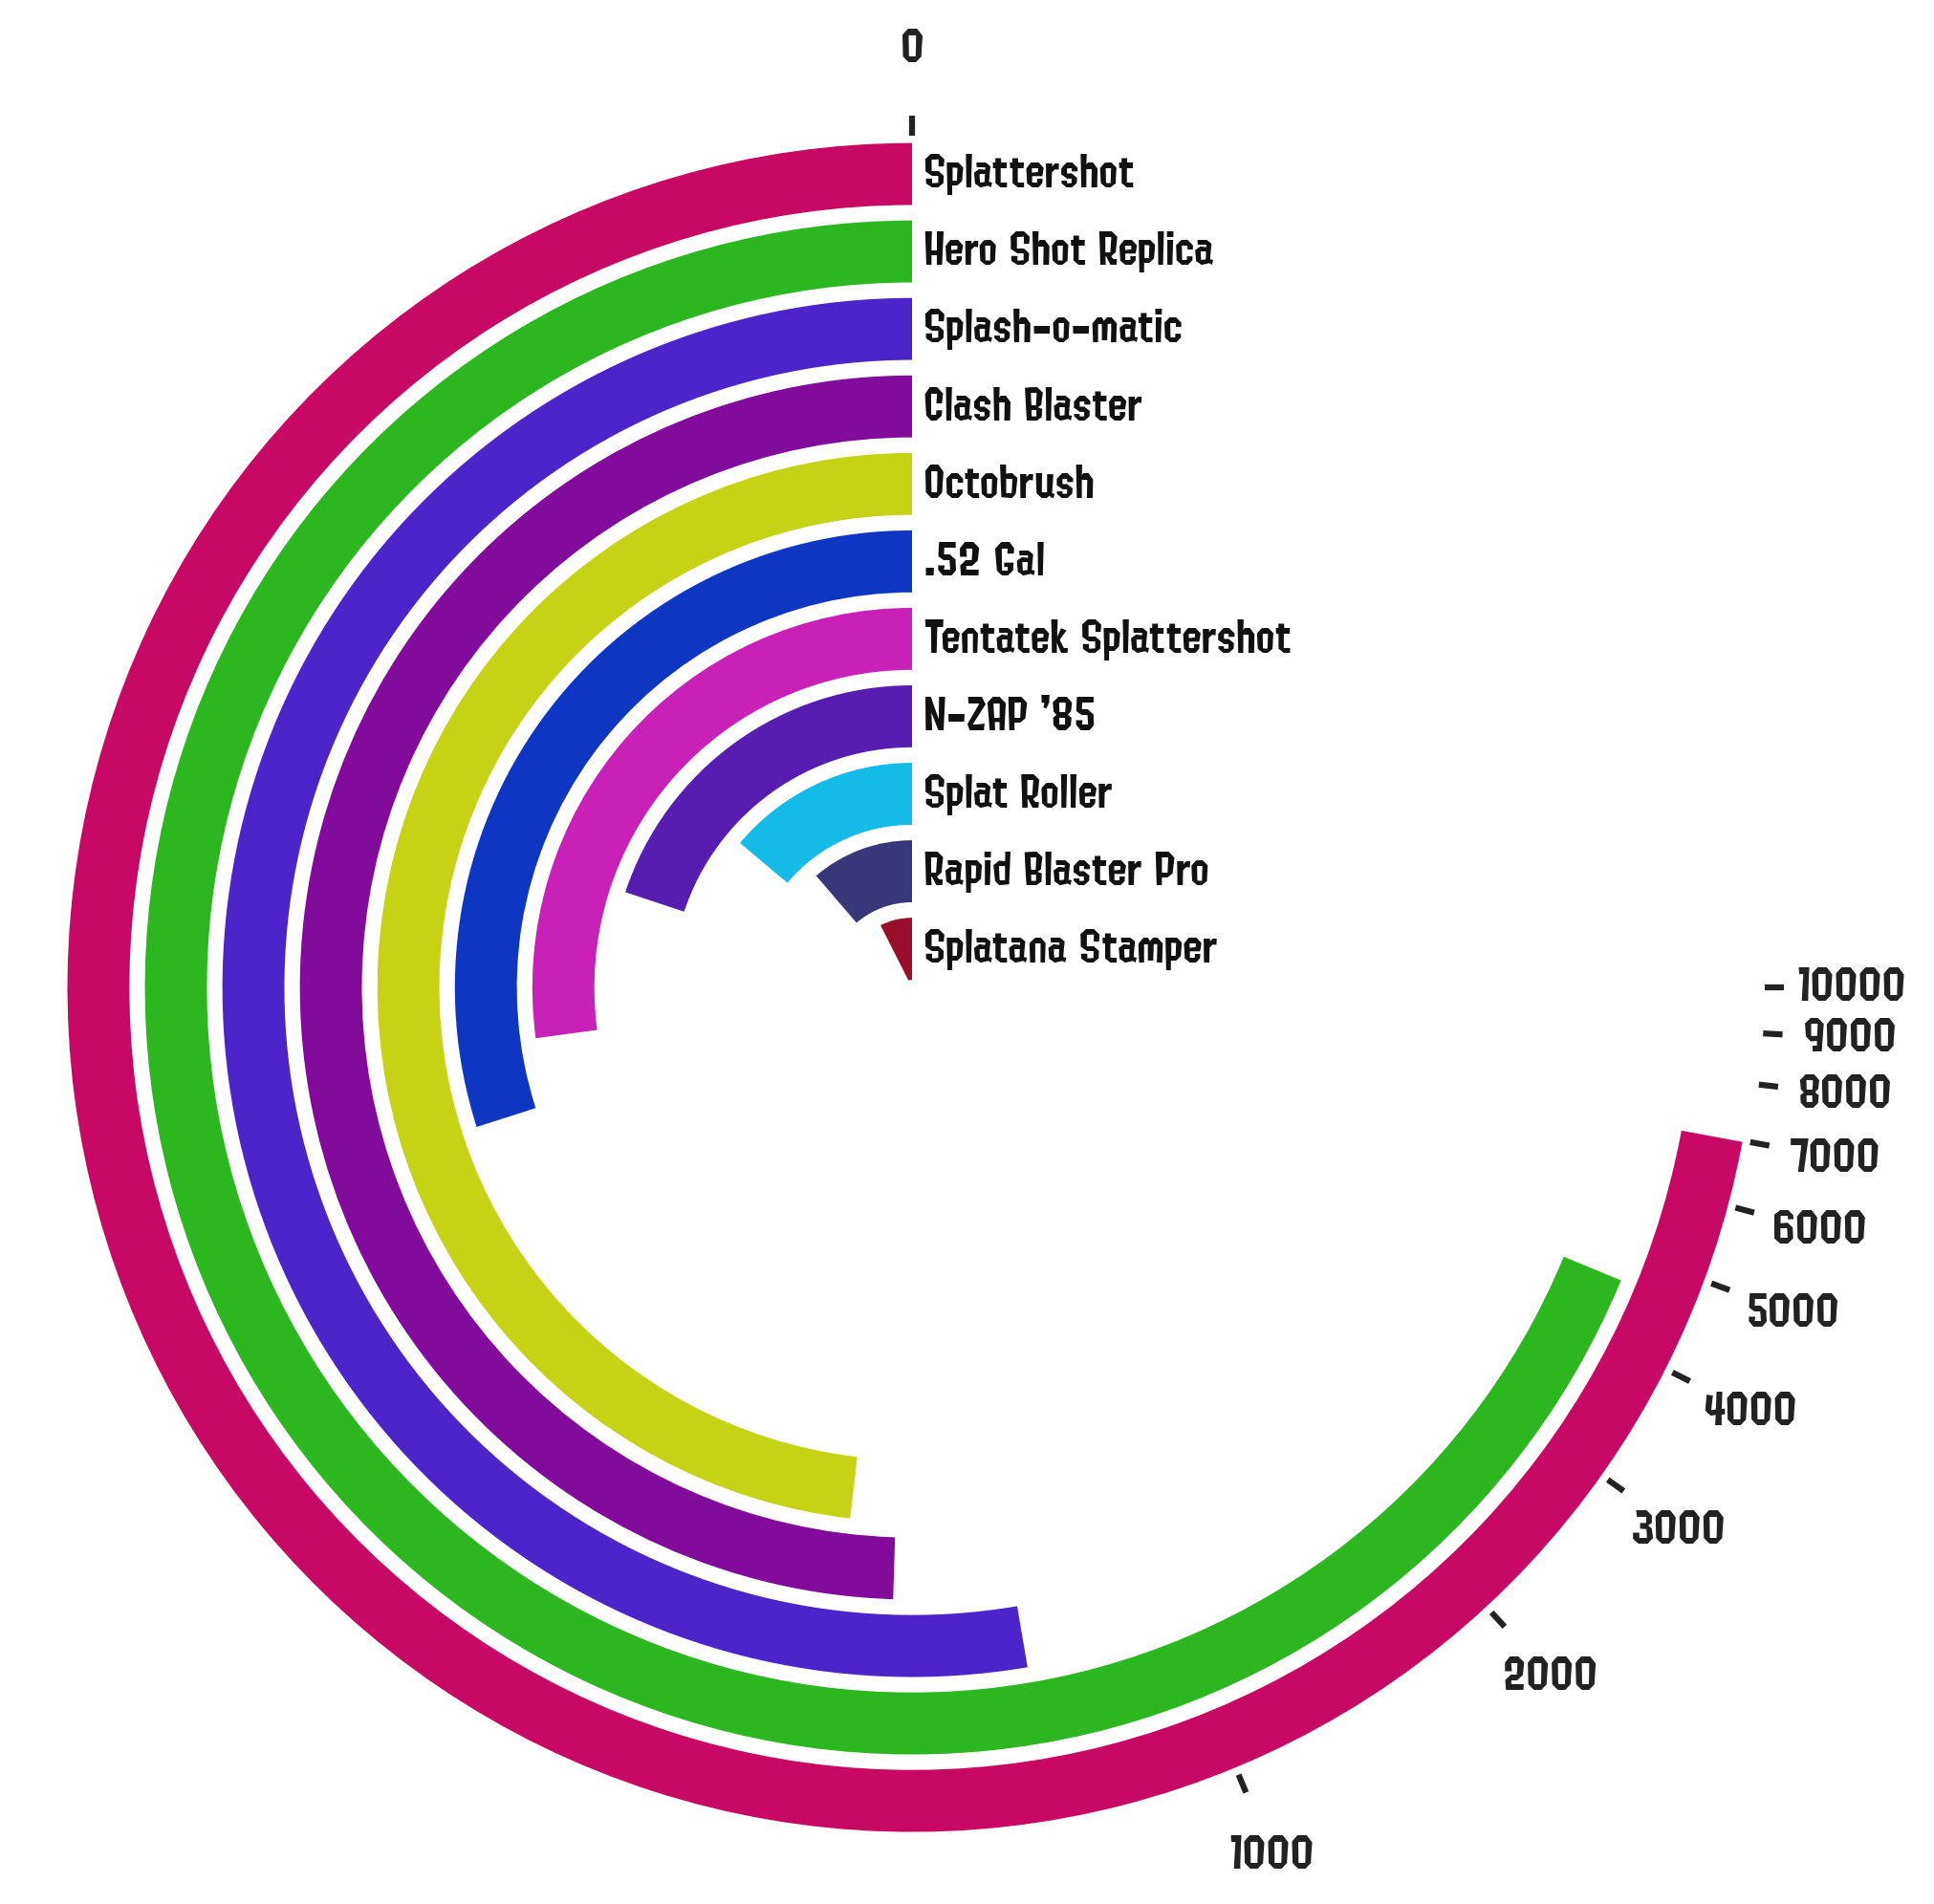
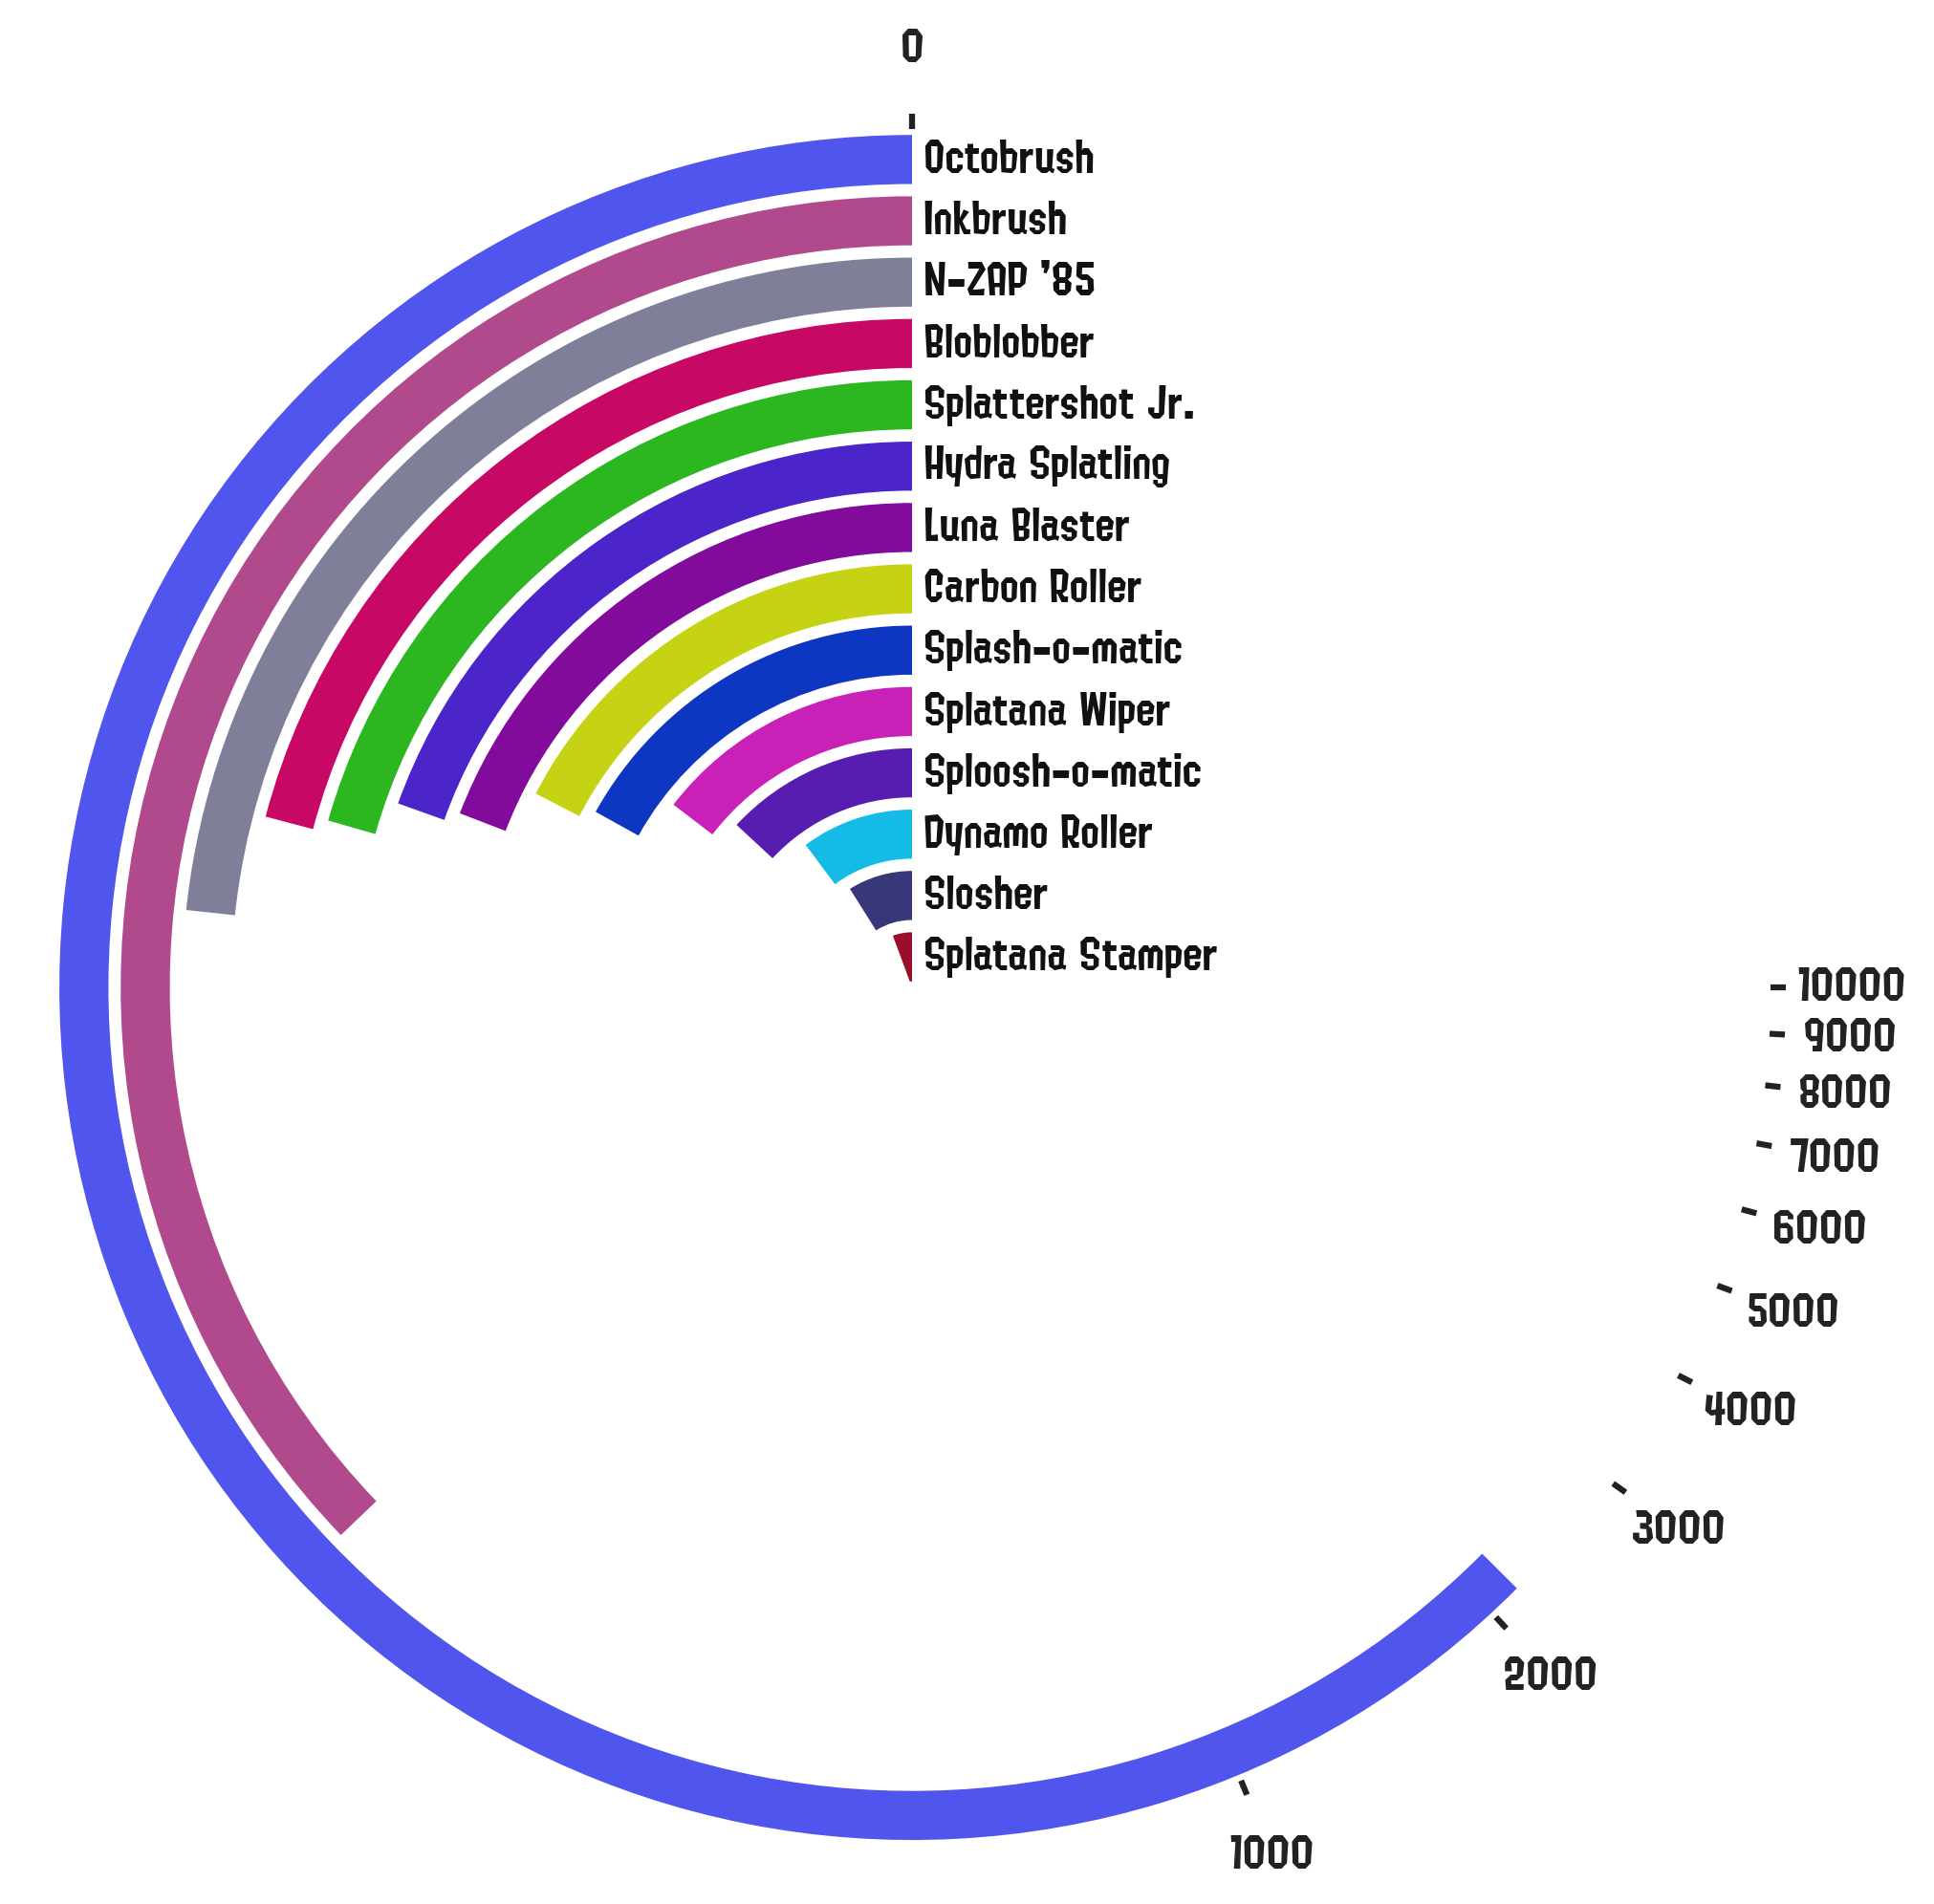
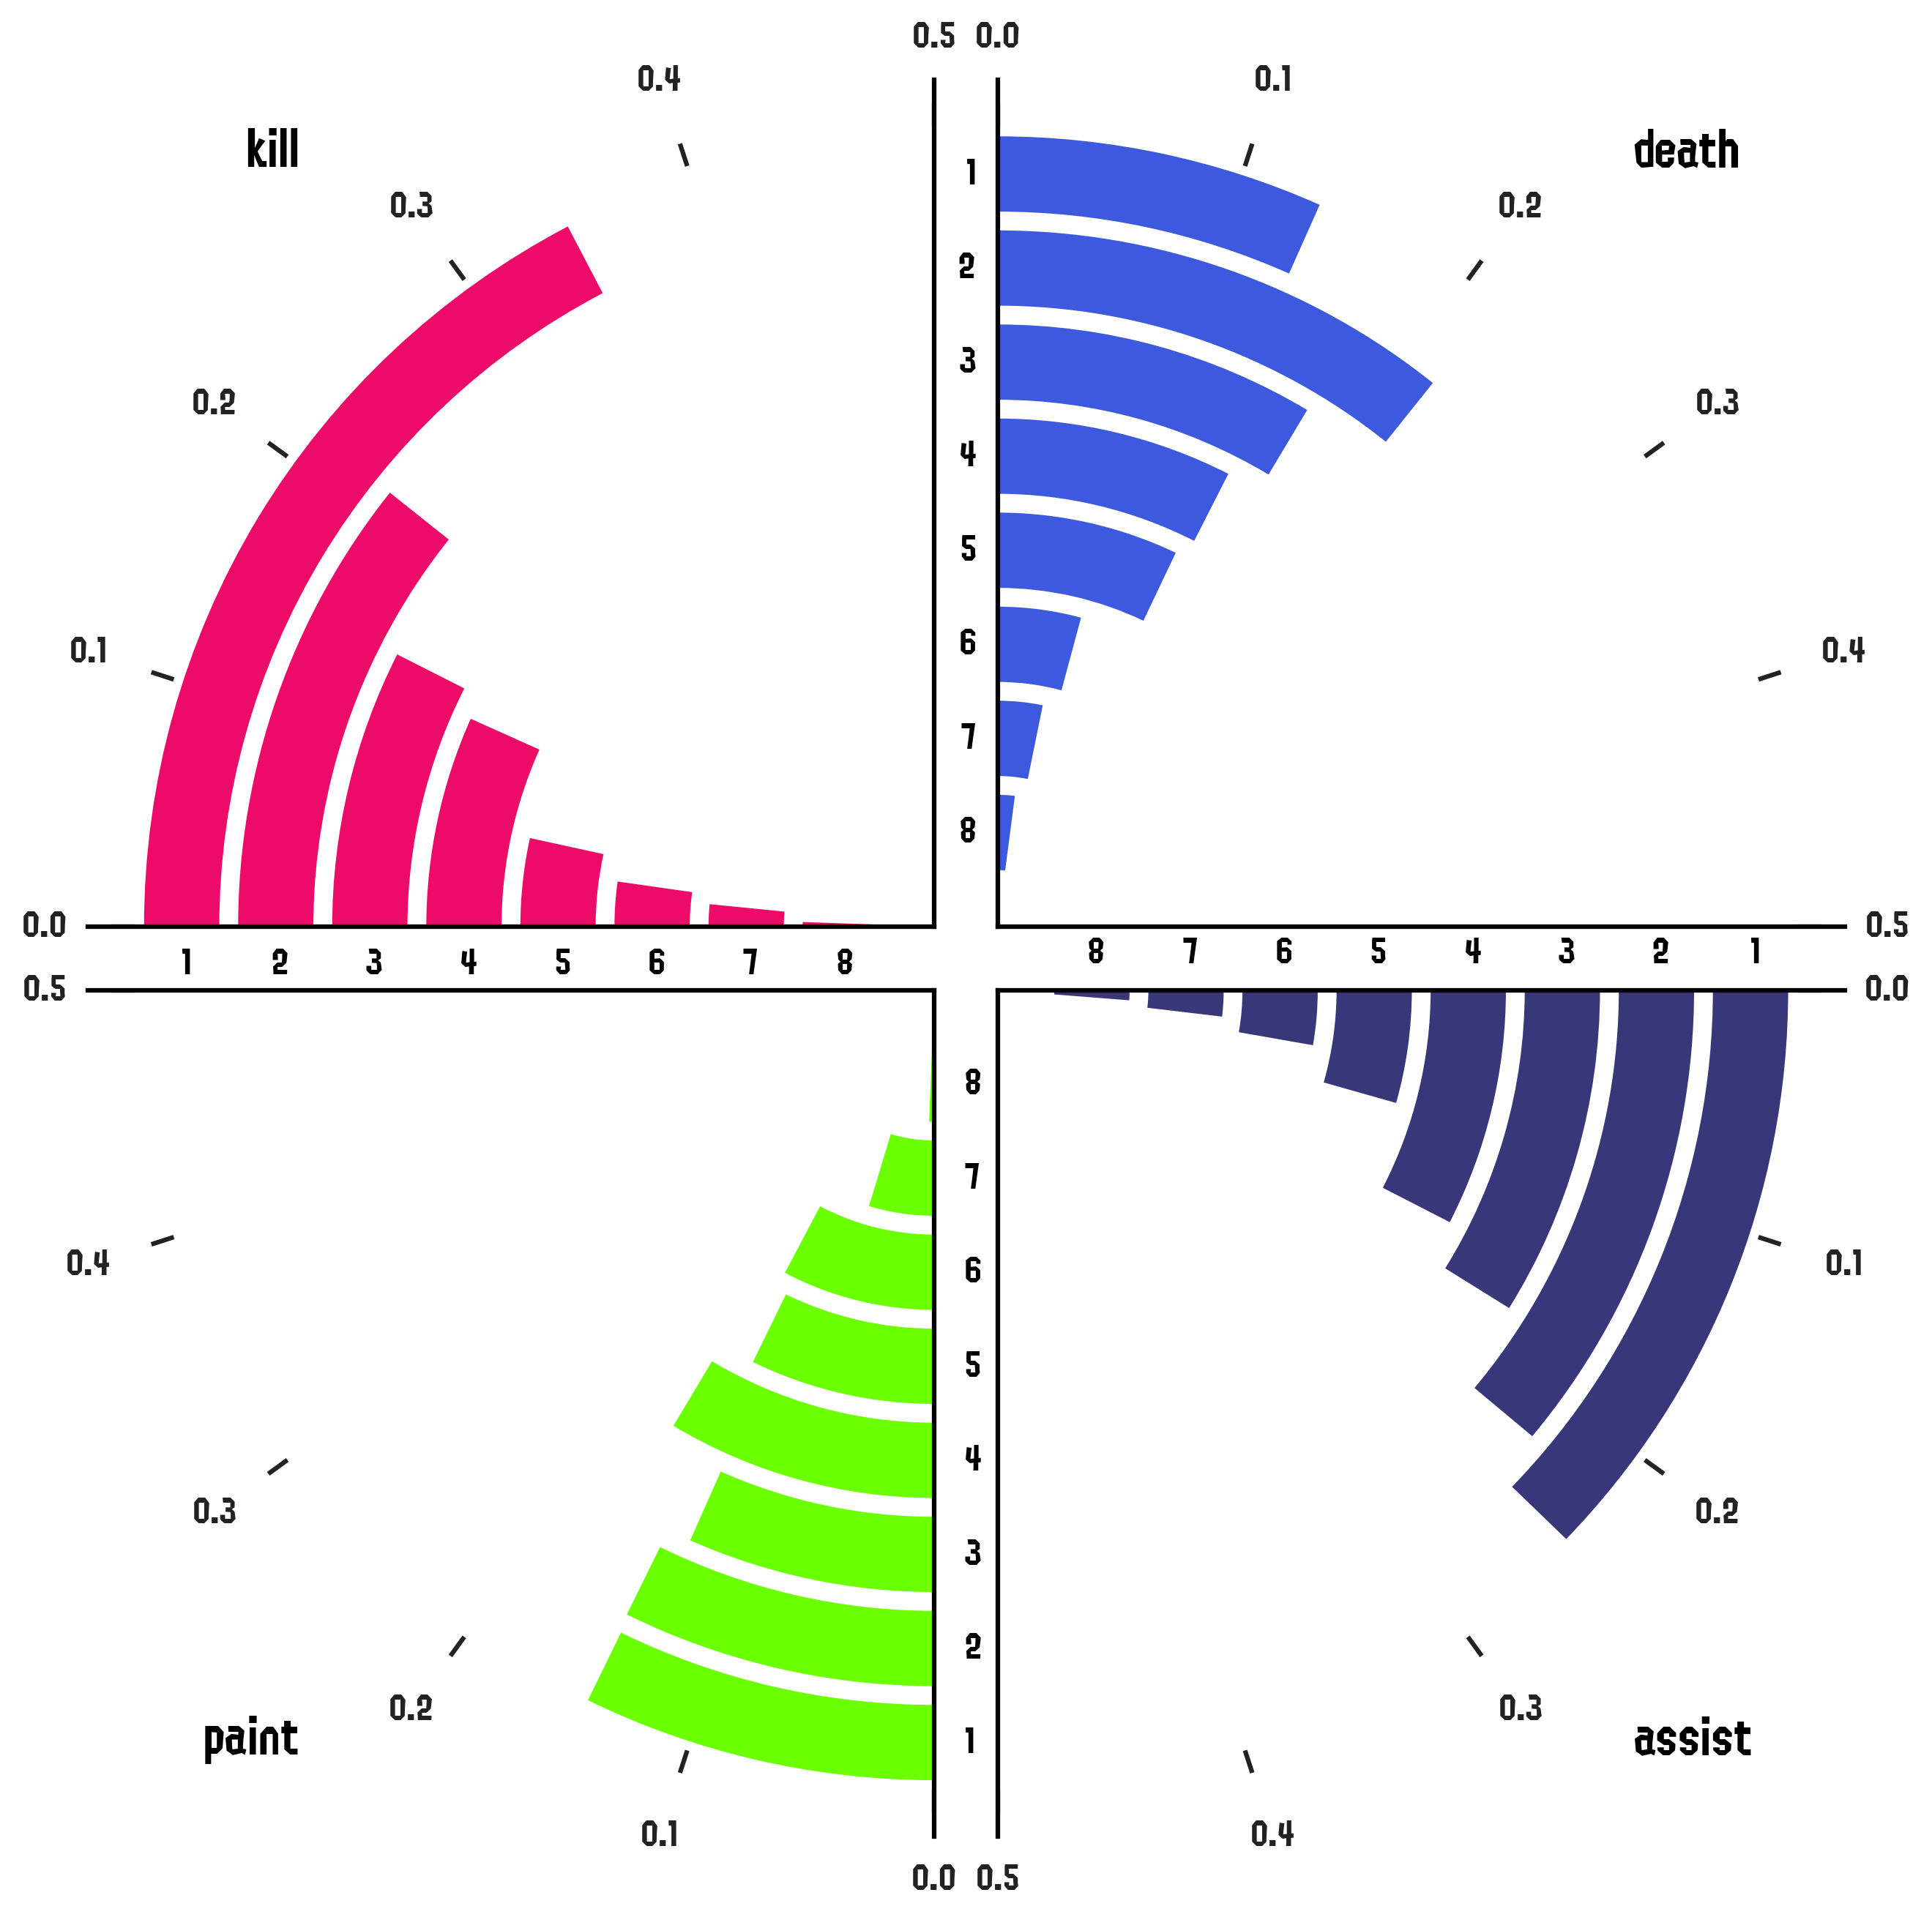
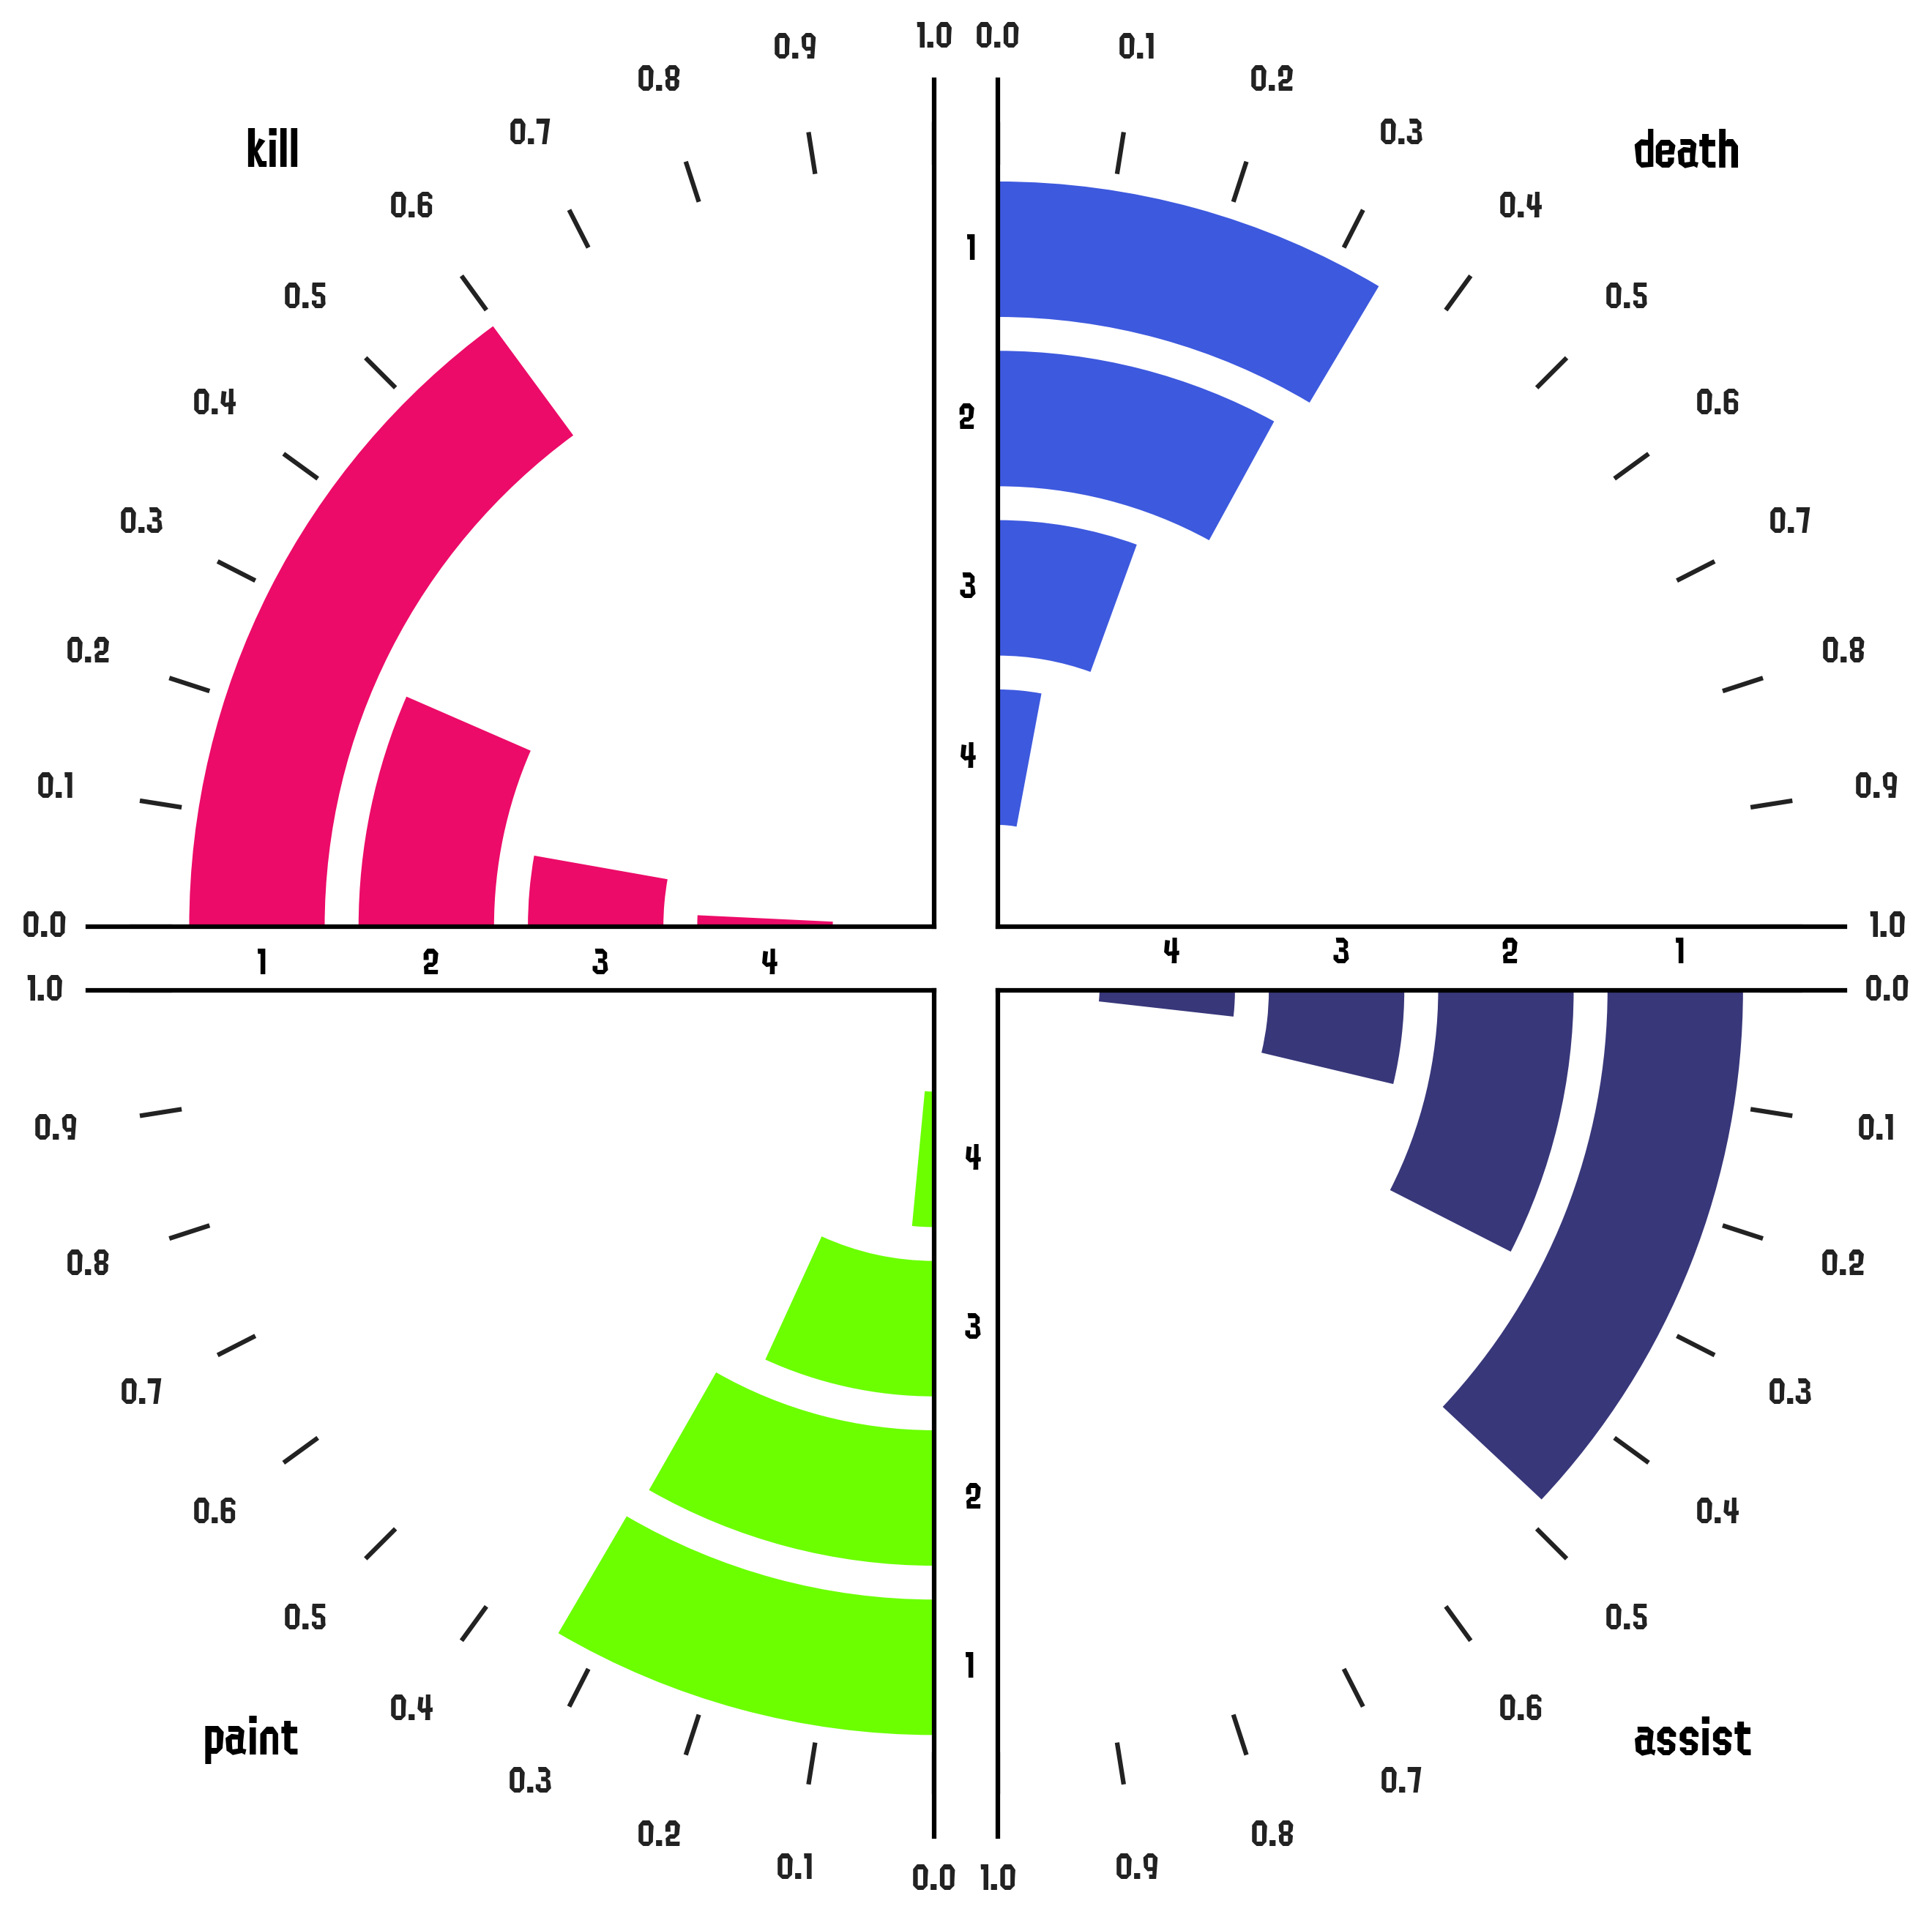
Polar Barcharts
These plots show the breakdown of a given statistic by category shown in a polar barchart. In the following examples we show kills+1/2*assists (kassists) by main weapon.
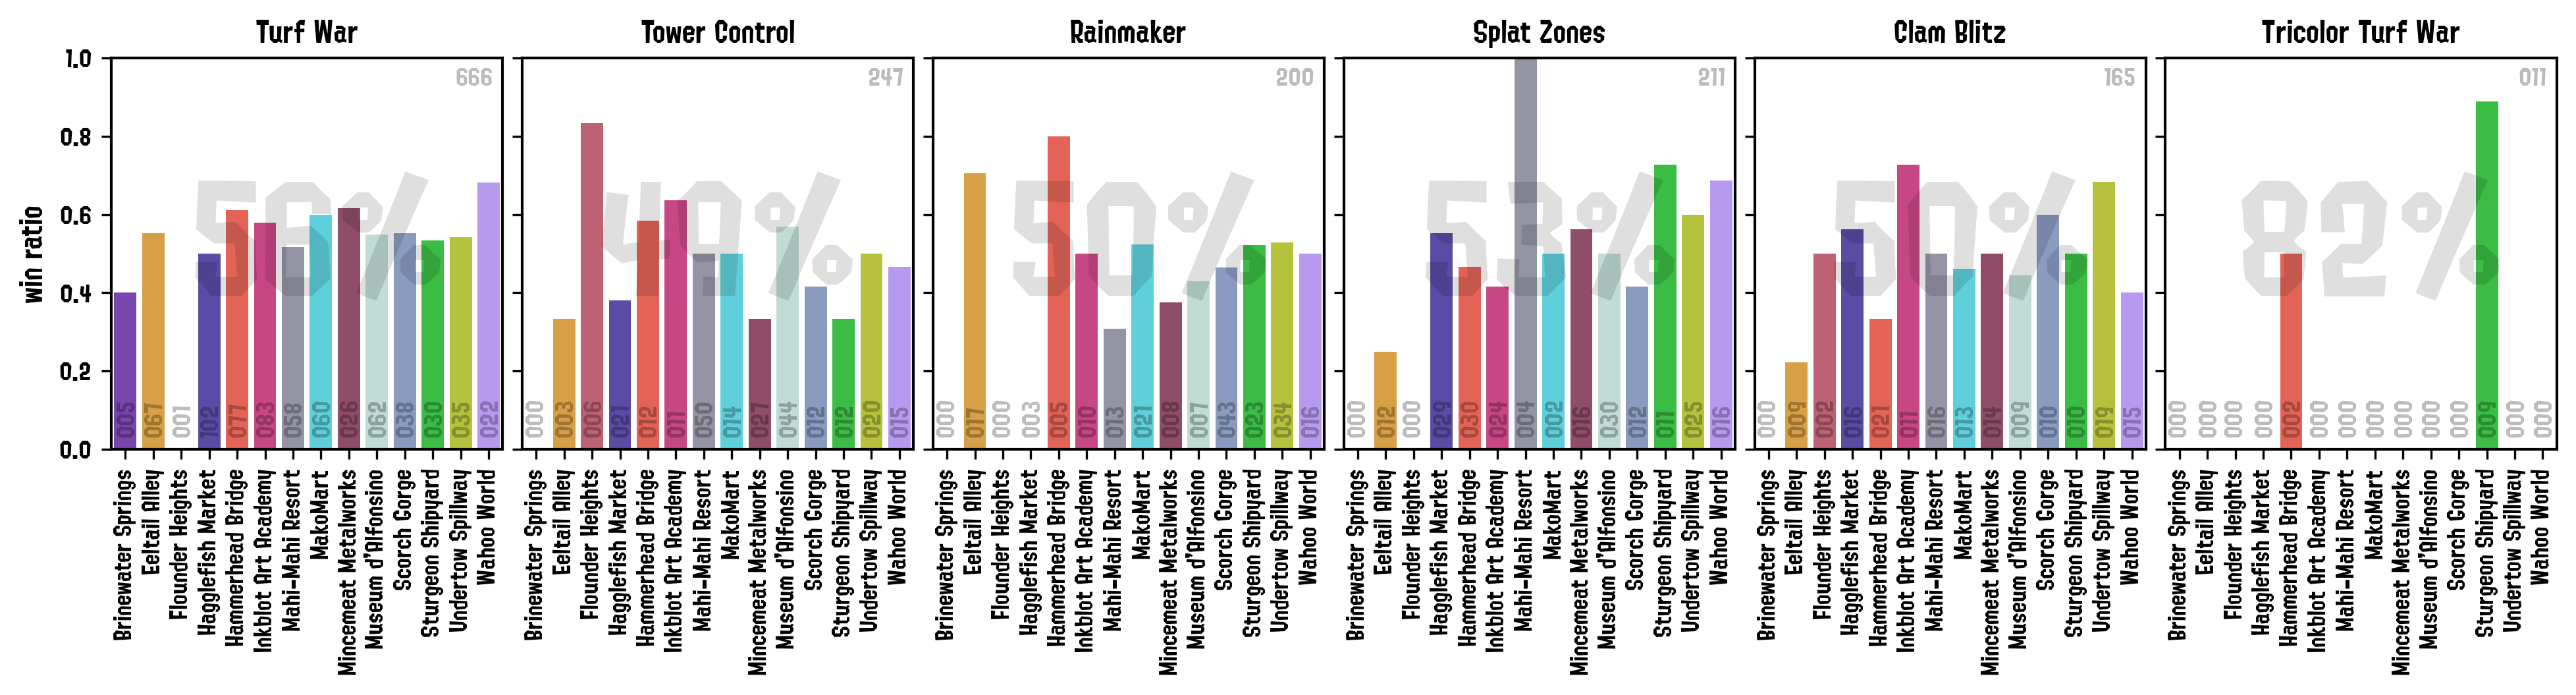
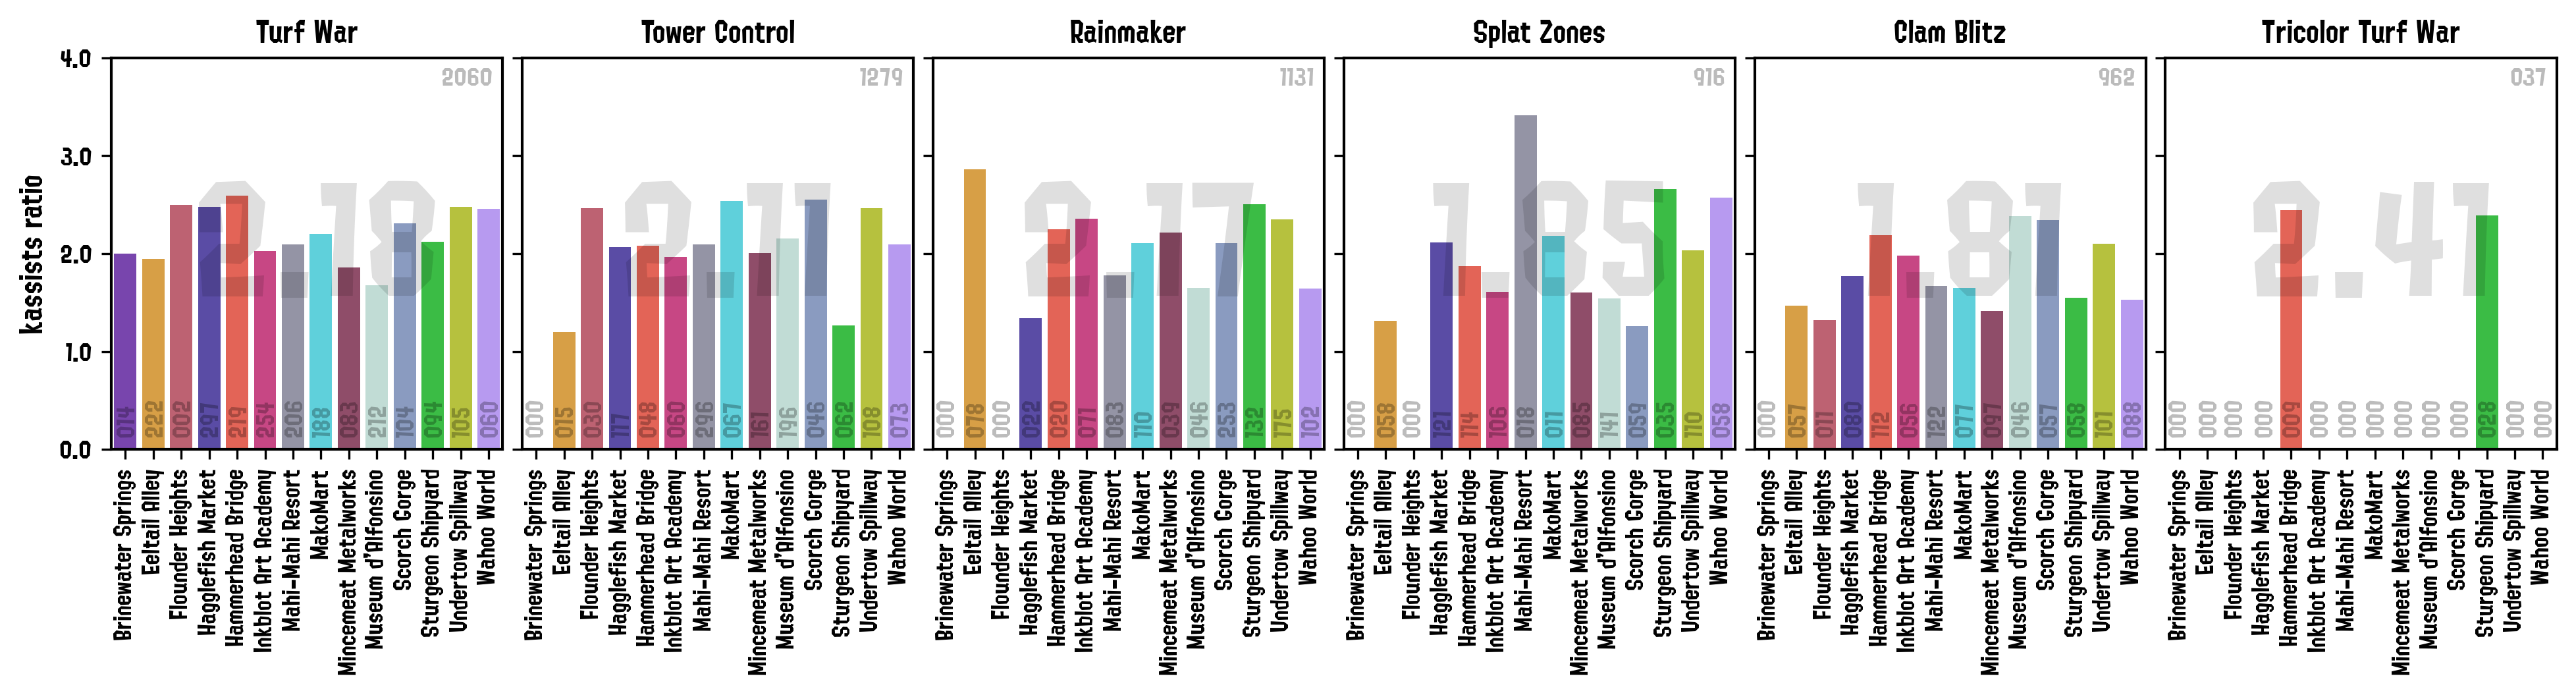
Stats By Match-Type and Stage
These barcharts show the frequency of a given statistic broken down by match-type and stage.
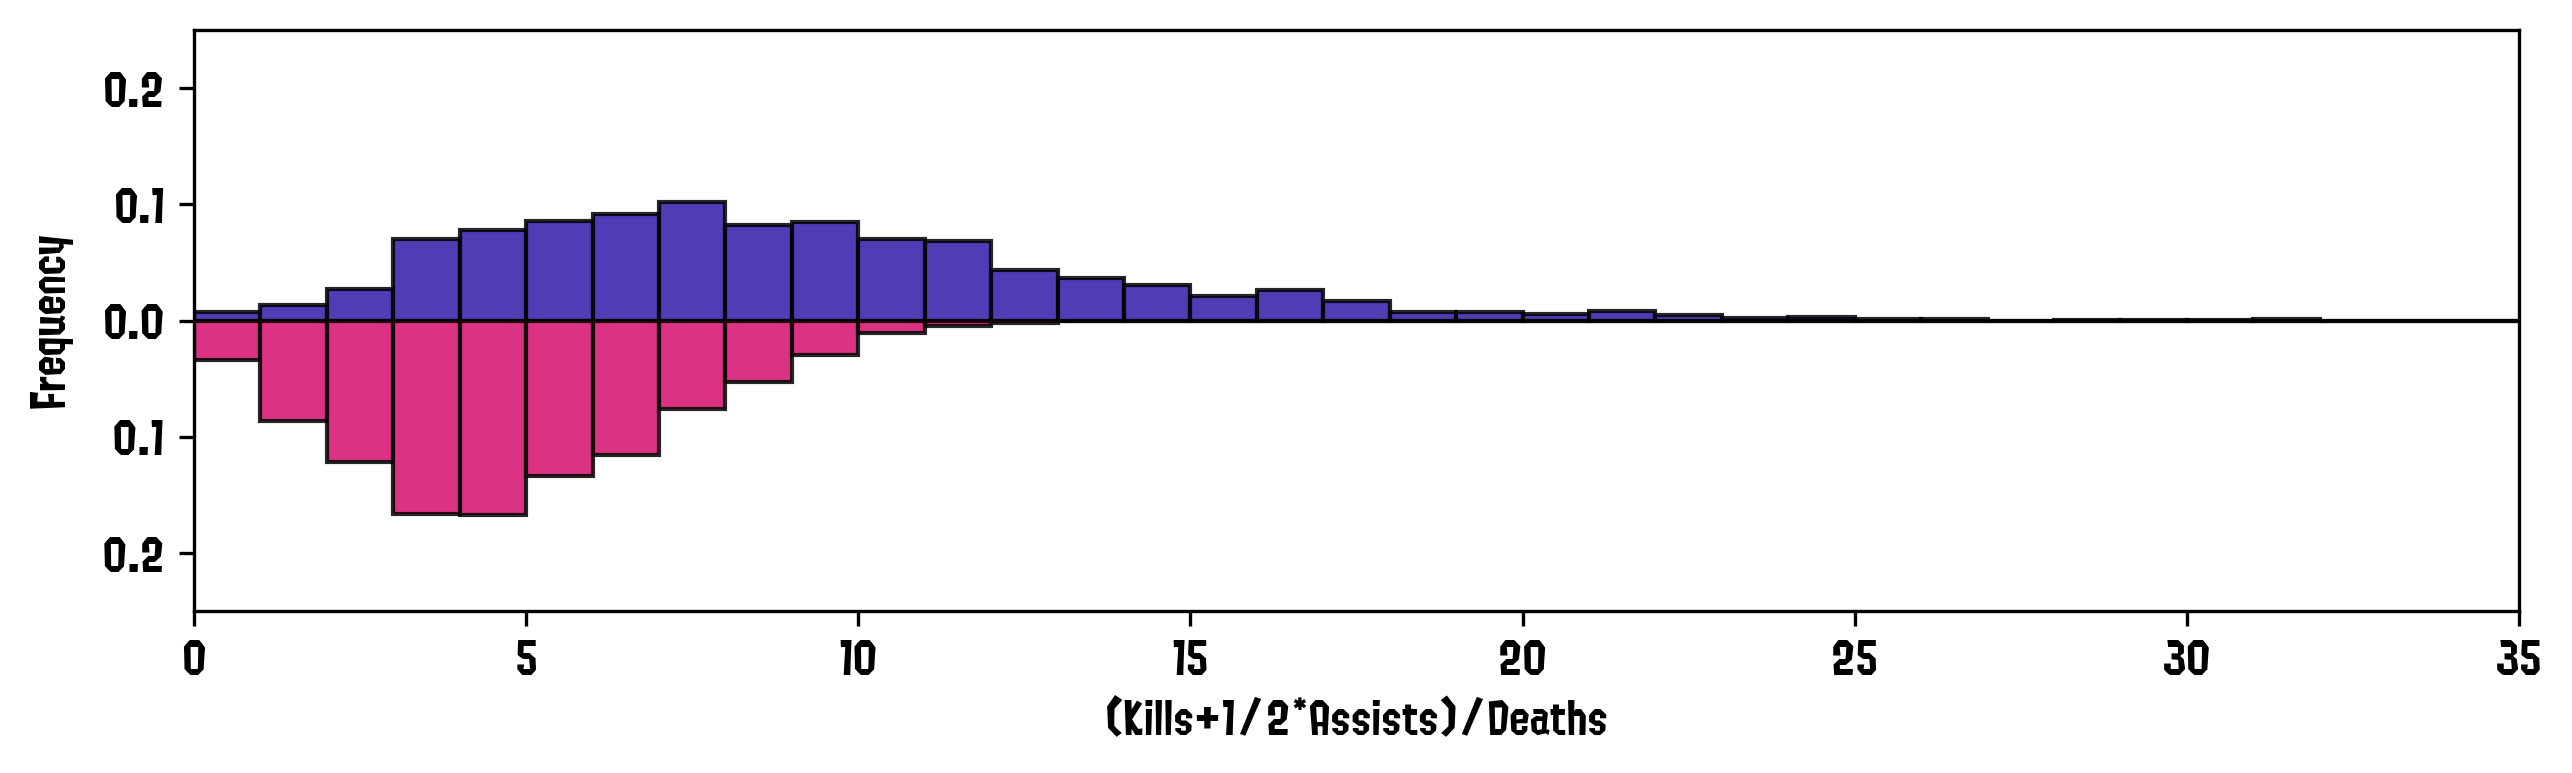
Kills VS Deaths Distributions
These paired histograms show the frequency distributions of the number of kills or kassists (top, blue), and the number of deaths (bottom, magenta) across matches.
Player Rank
These plots show the player's results as compared to the other players in the match (left) and on the player's team (right).
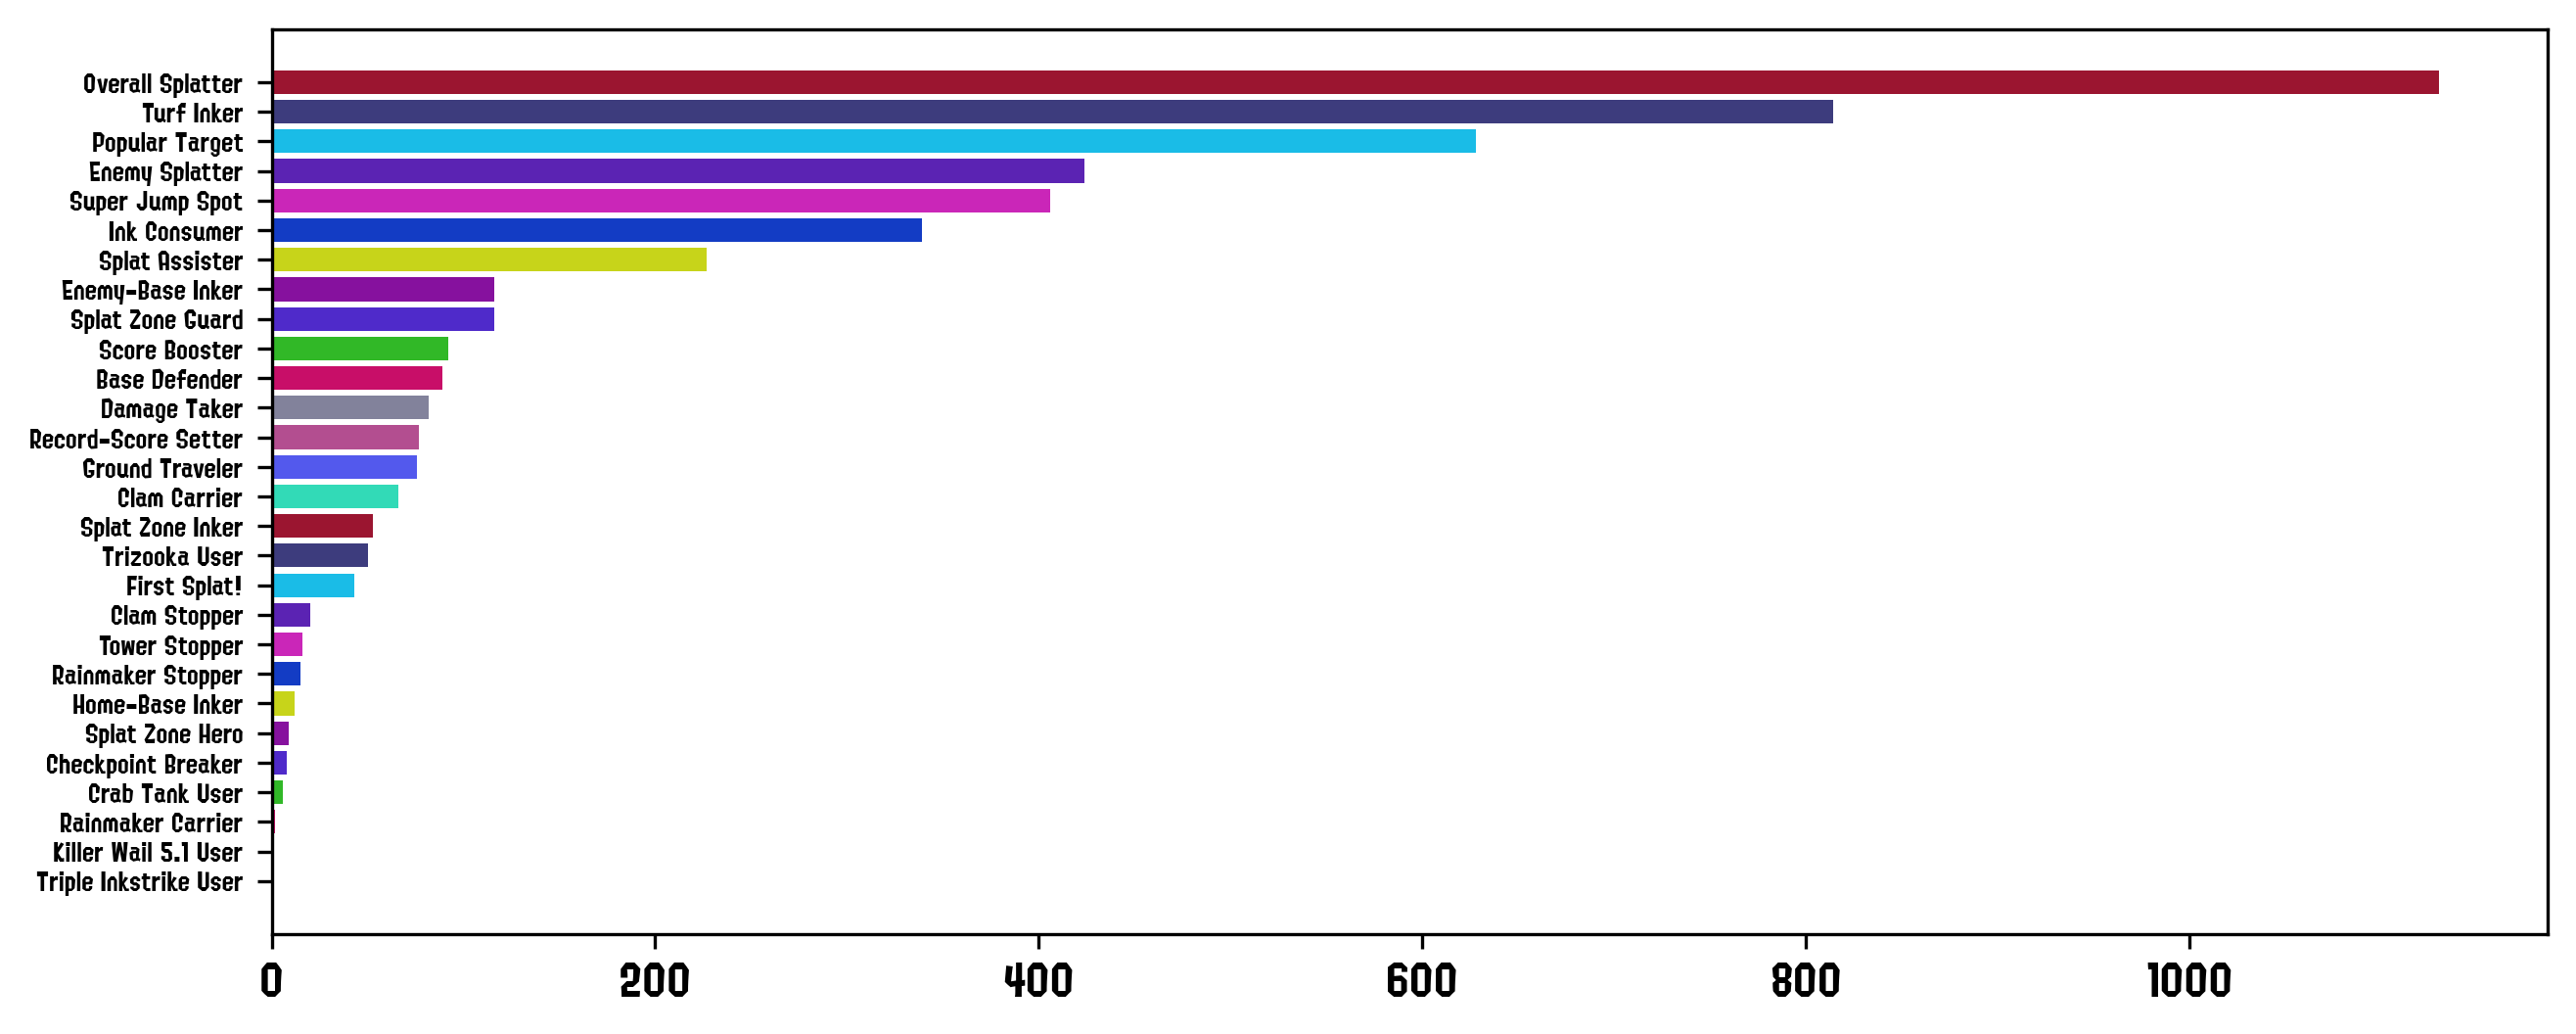
Awards BarChart
A simple bar chart of the times awards have been given to the player.
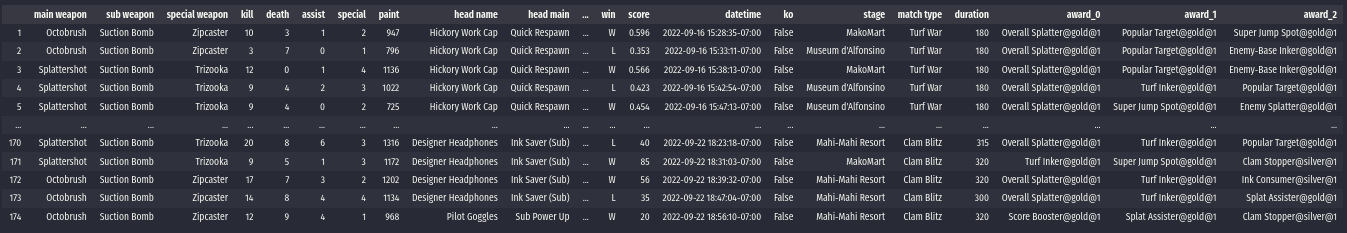
Matches History Panel
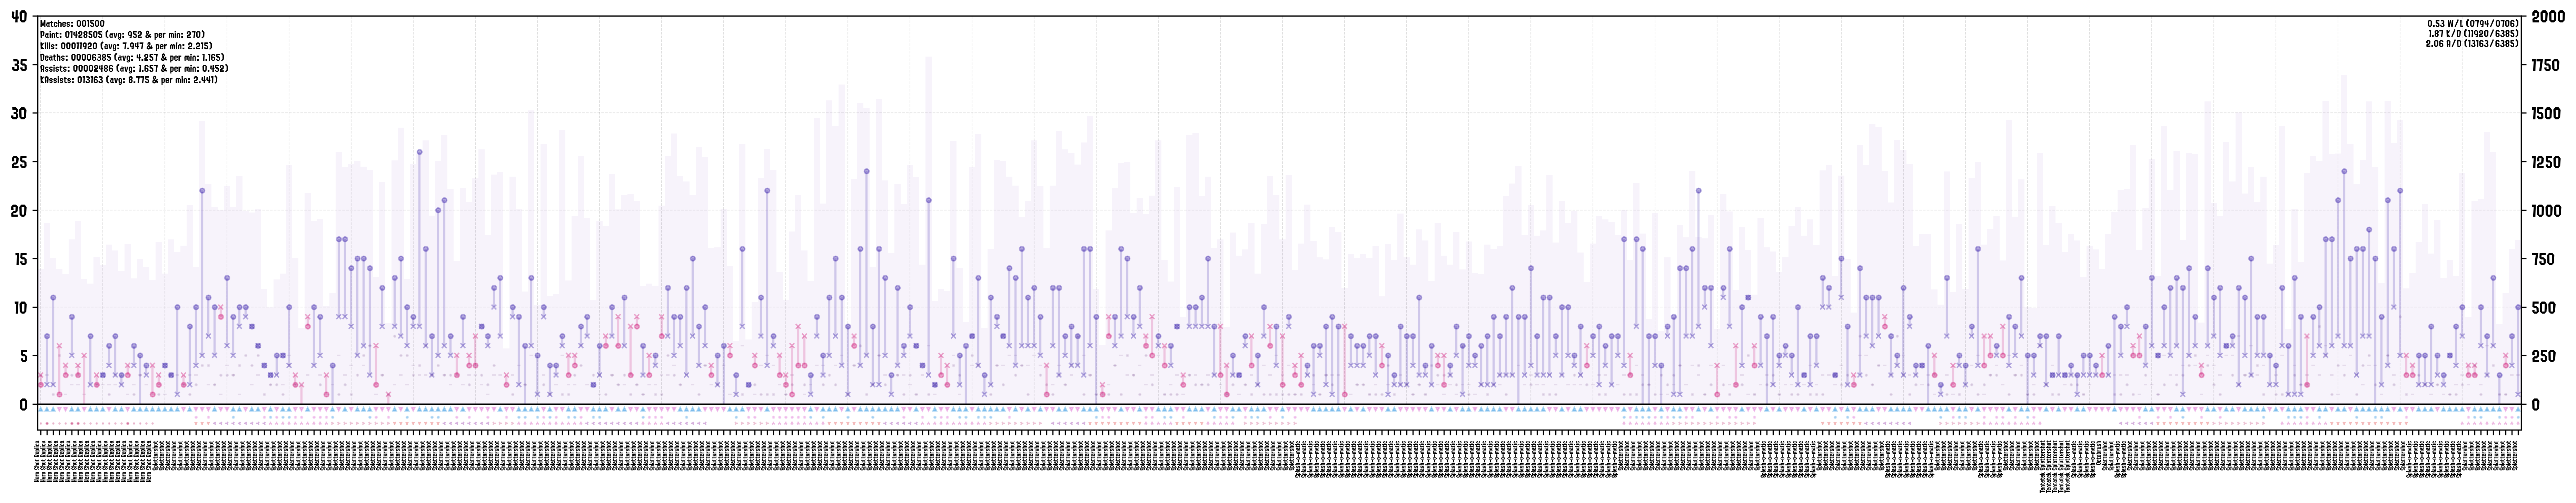
This panel is constructed as a panel composed of two different figures. The top one is a detailed breakdown of the statistics of each battle. Each column on the x axis represents a single battle; where the left y axis shows the number of kills, deaths, assists and specials; and the right y axis the turf painted over the match (bars on the plot).
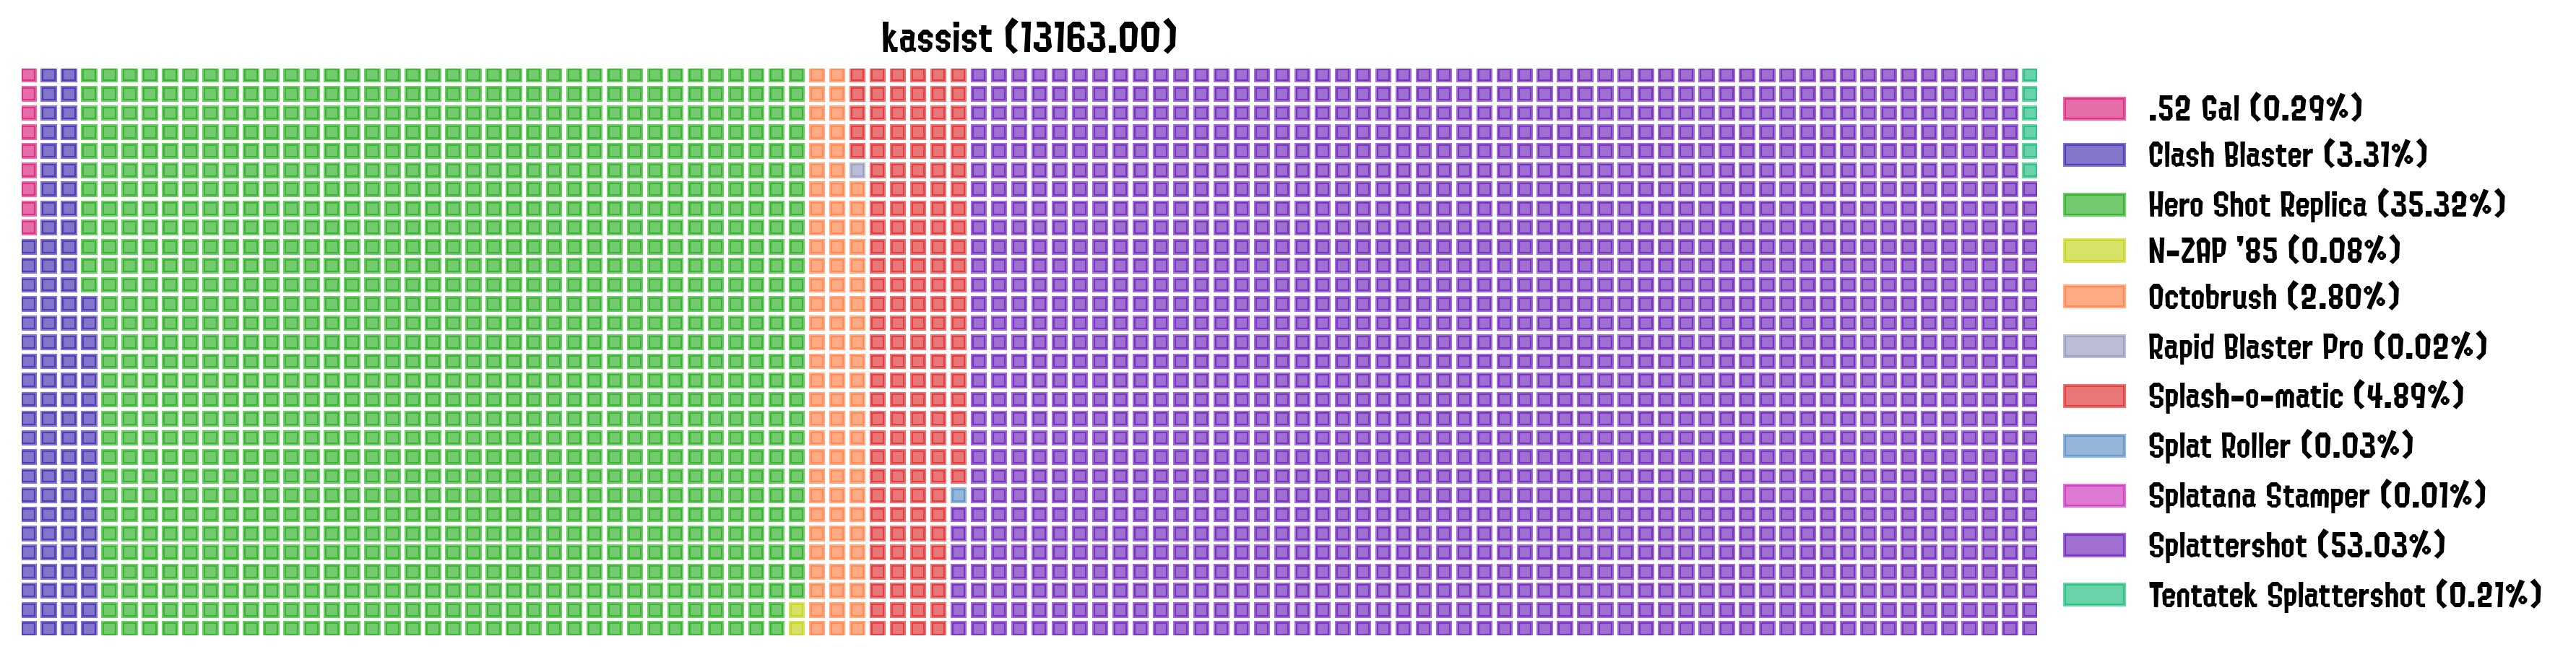
Waffle Plots
Shows the contributions of given categories to a certain stat. In this example, we show the total number of (kills+1/2*assists) broken down by weapon.
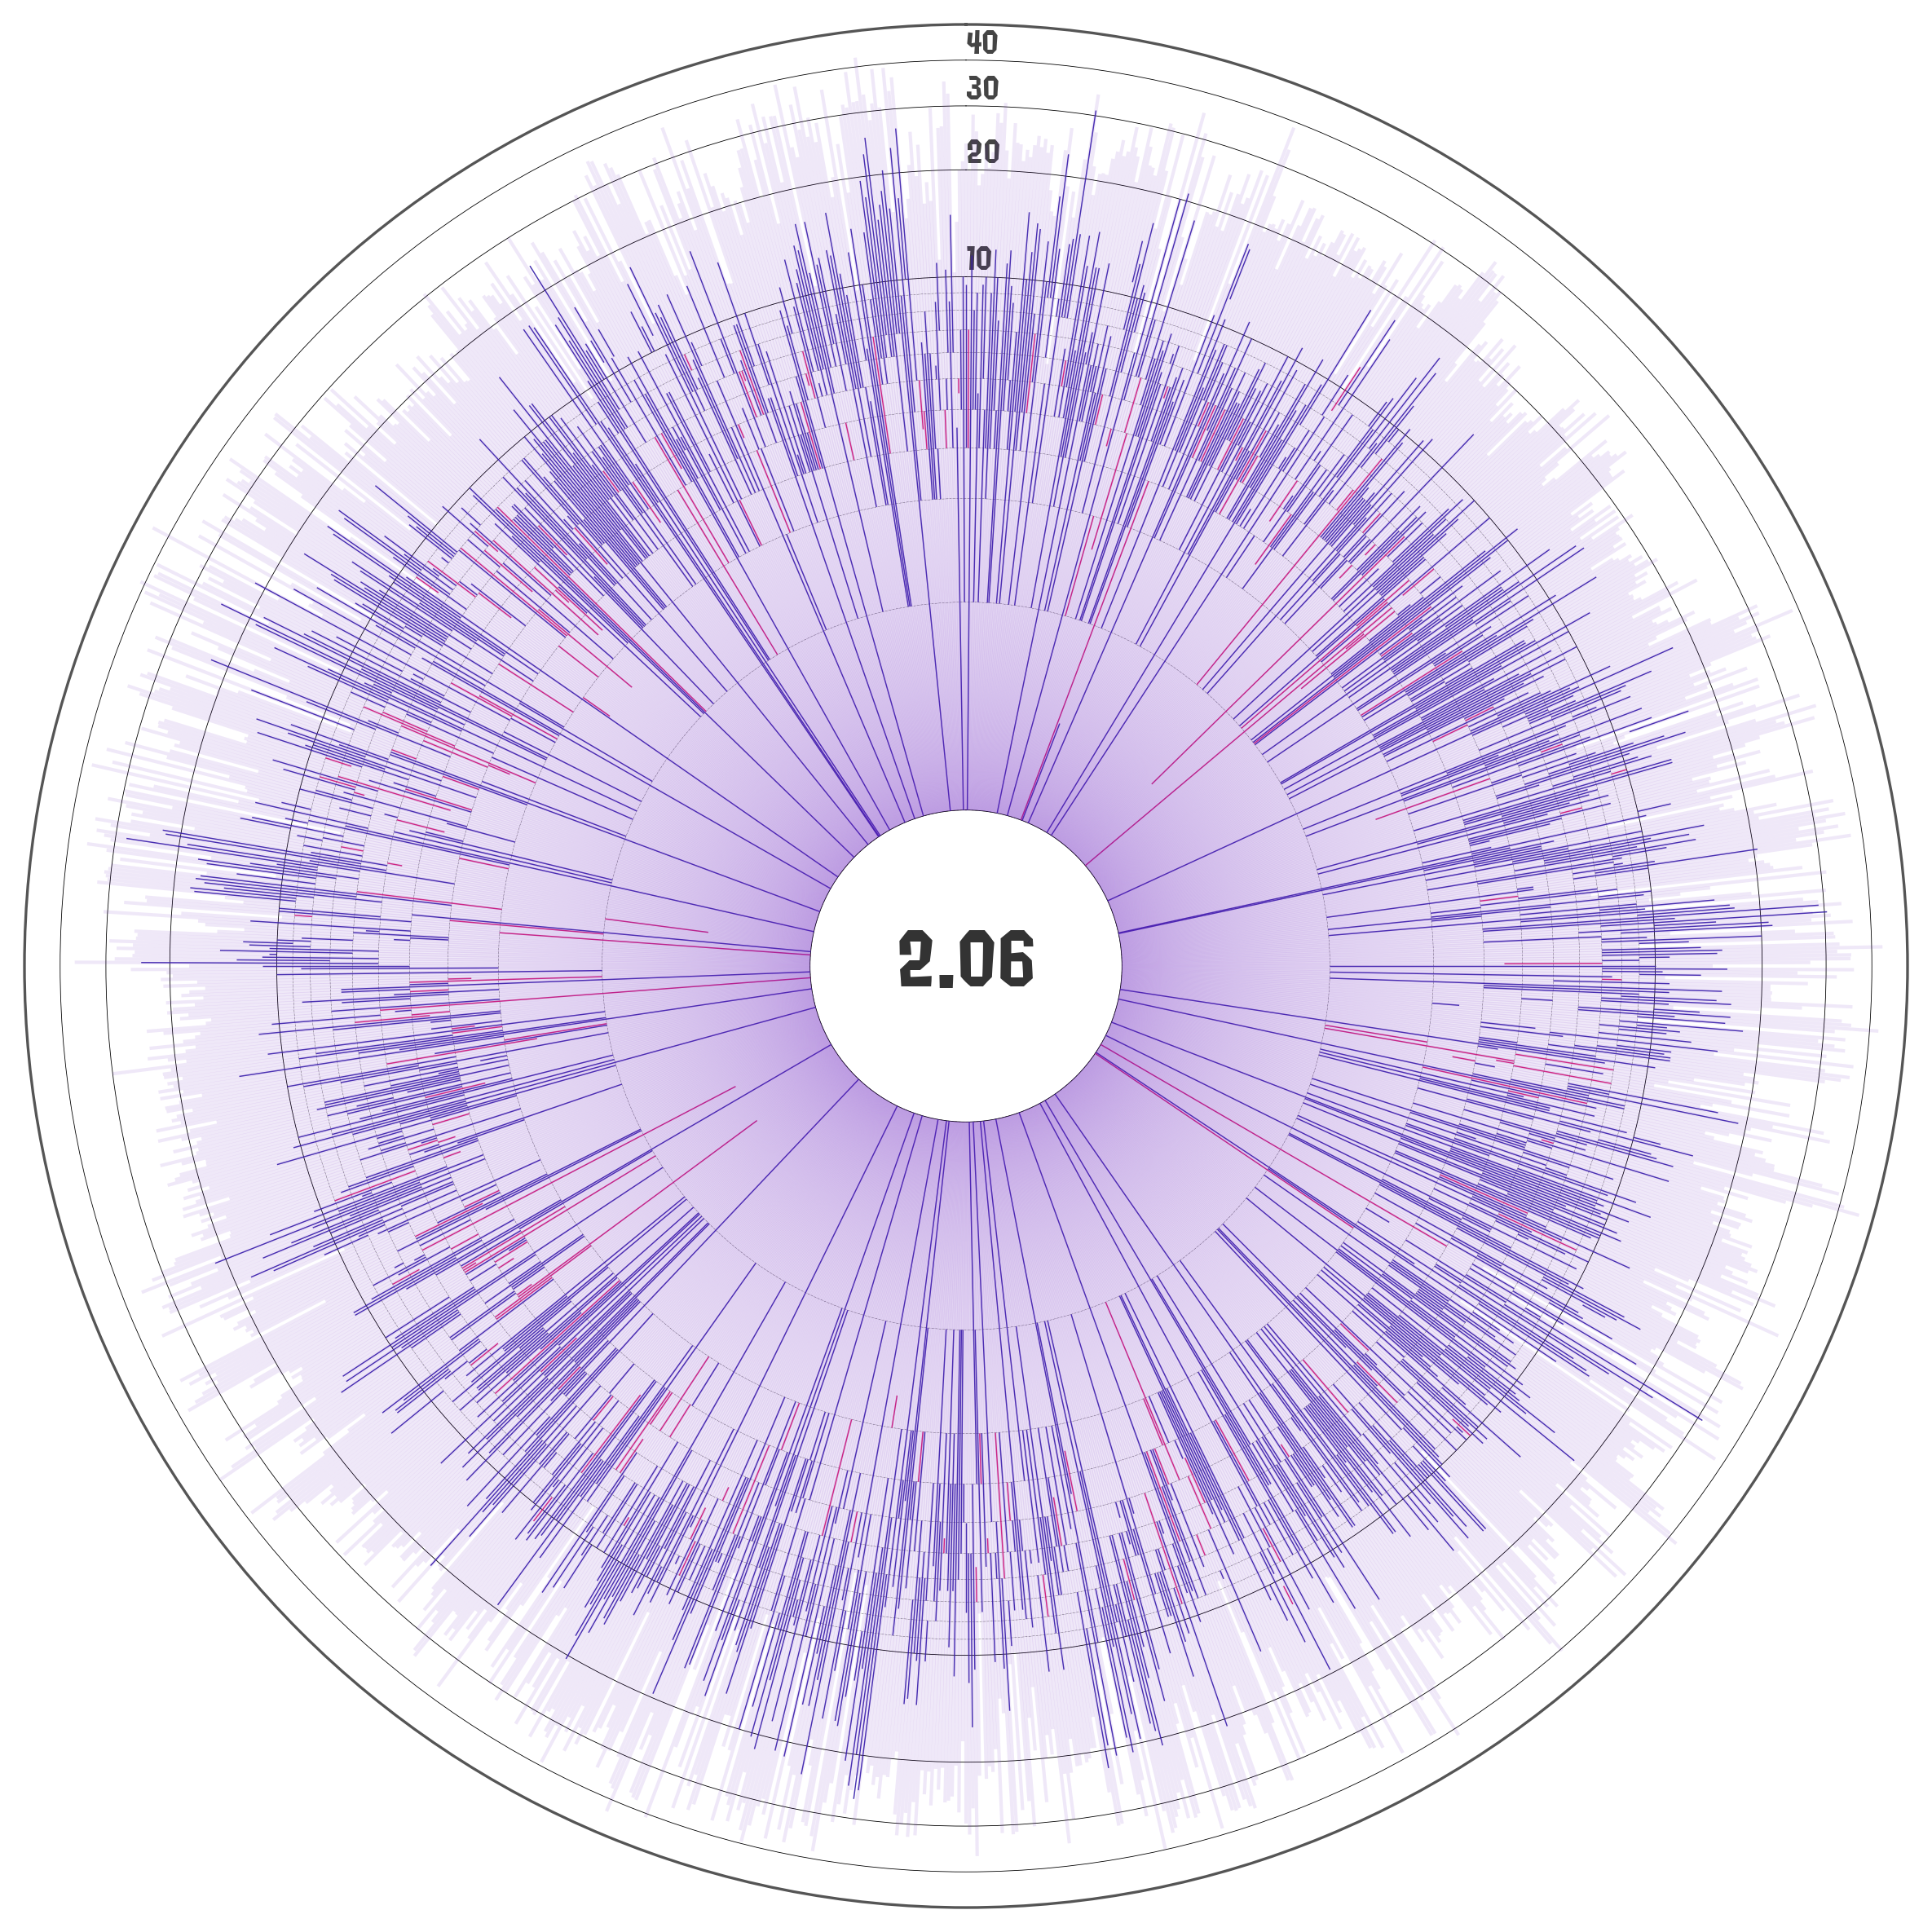
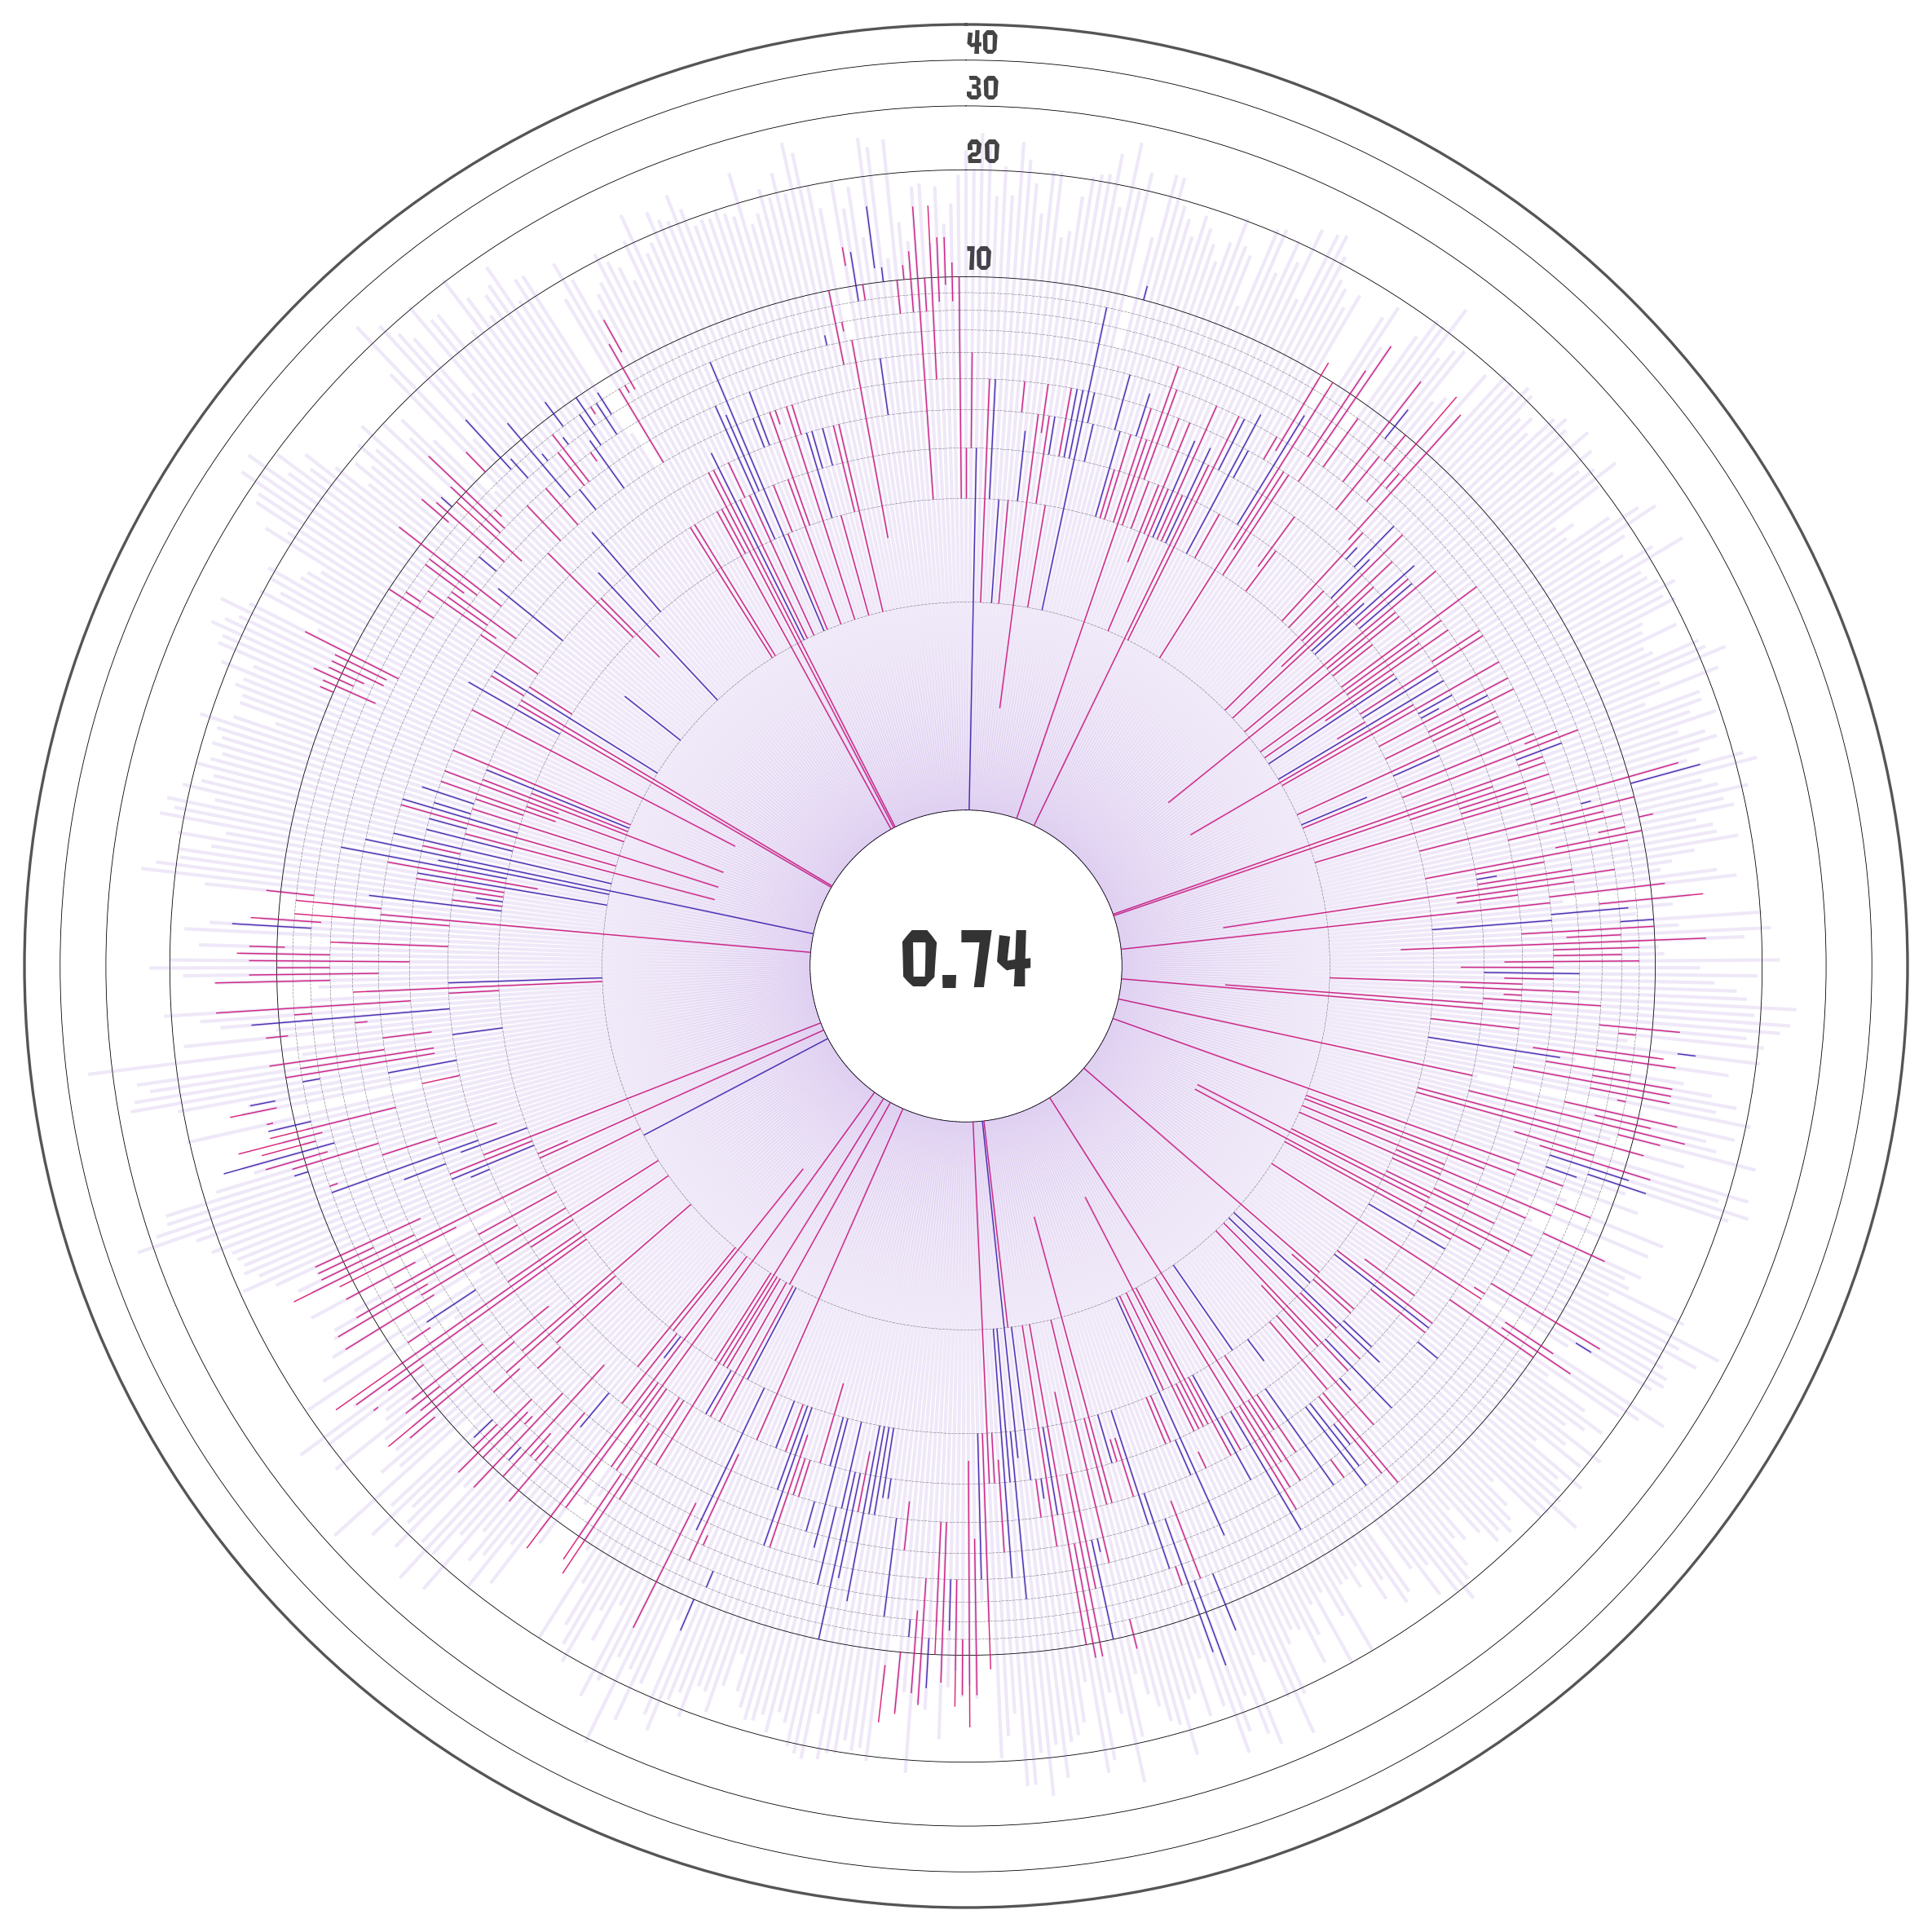
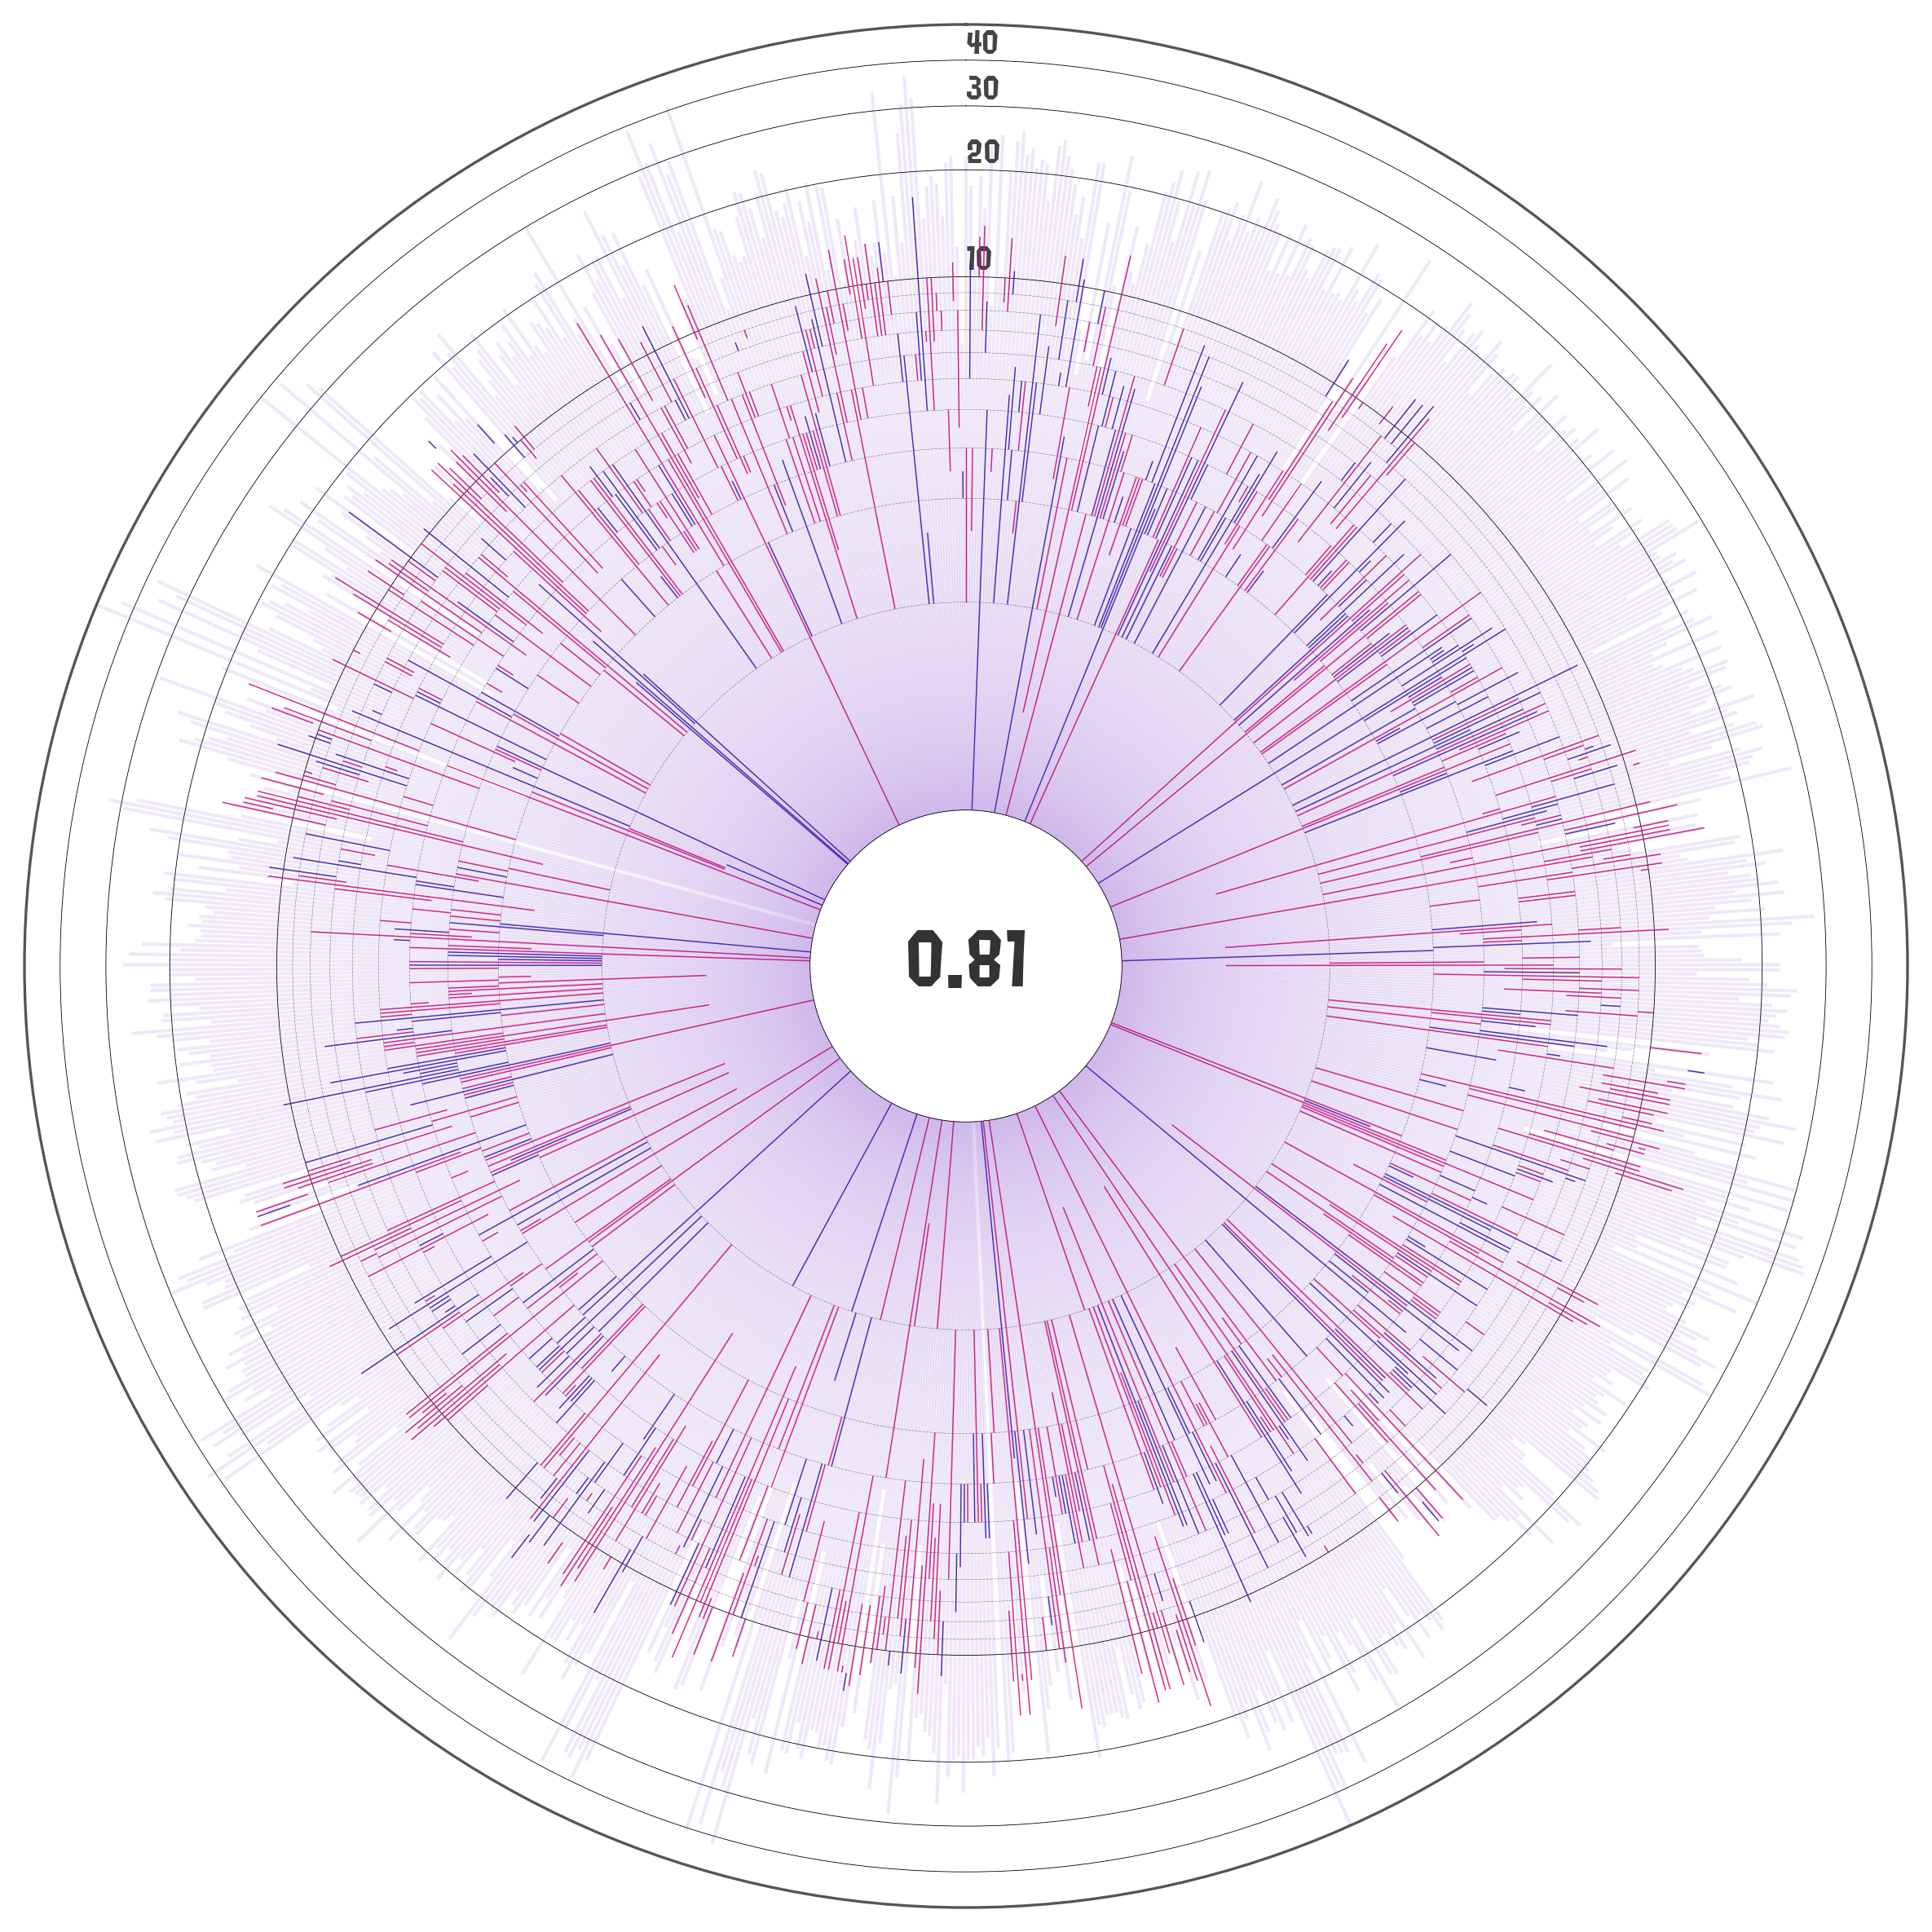
Kill/Death Iris
Similar to the matches history panel, these plots show the kill to death ratios as bars but this time they are arranged in a circular pattern to keep it more compact. The radial axis is log-scaled by default with the (kill+1/2*assist) to deaths ratio highlighted at the center of the plot.
Stage/Weapons Stats Treemaps
These plots are designed to show which stages are the ones in which the player performs best on any given stage with respect to a selected metric. Auxiliary provided functions generate the statistics dataframe required for these plots, which includes: kills, deaths, win ratio, paint, total matches; amongst many others. These statistics can be also generated for a specific match type (Rainmaker, Turf War, Tower Control, etc), or for a combination of them.
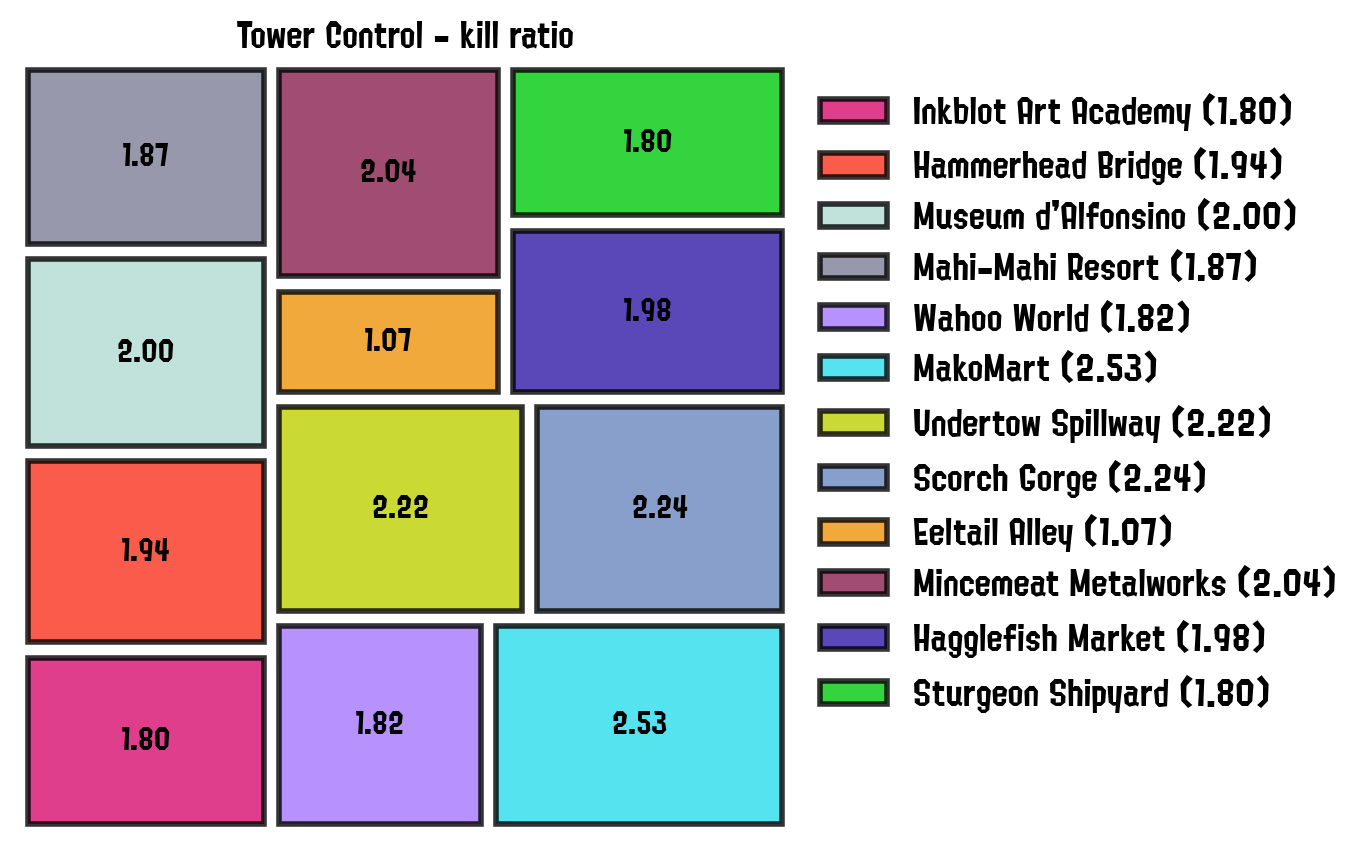
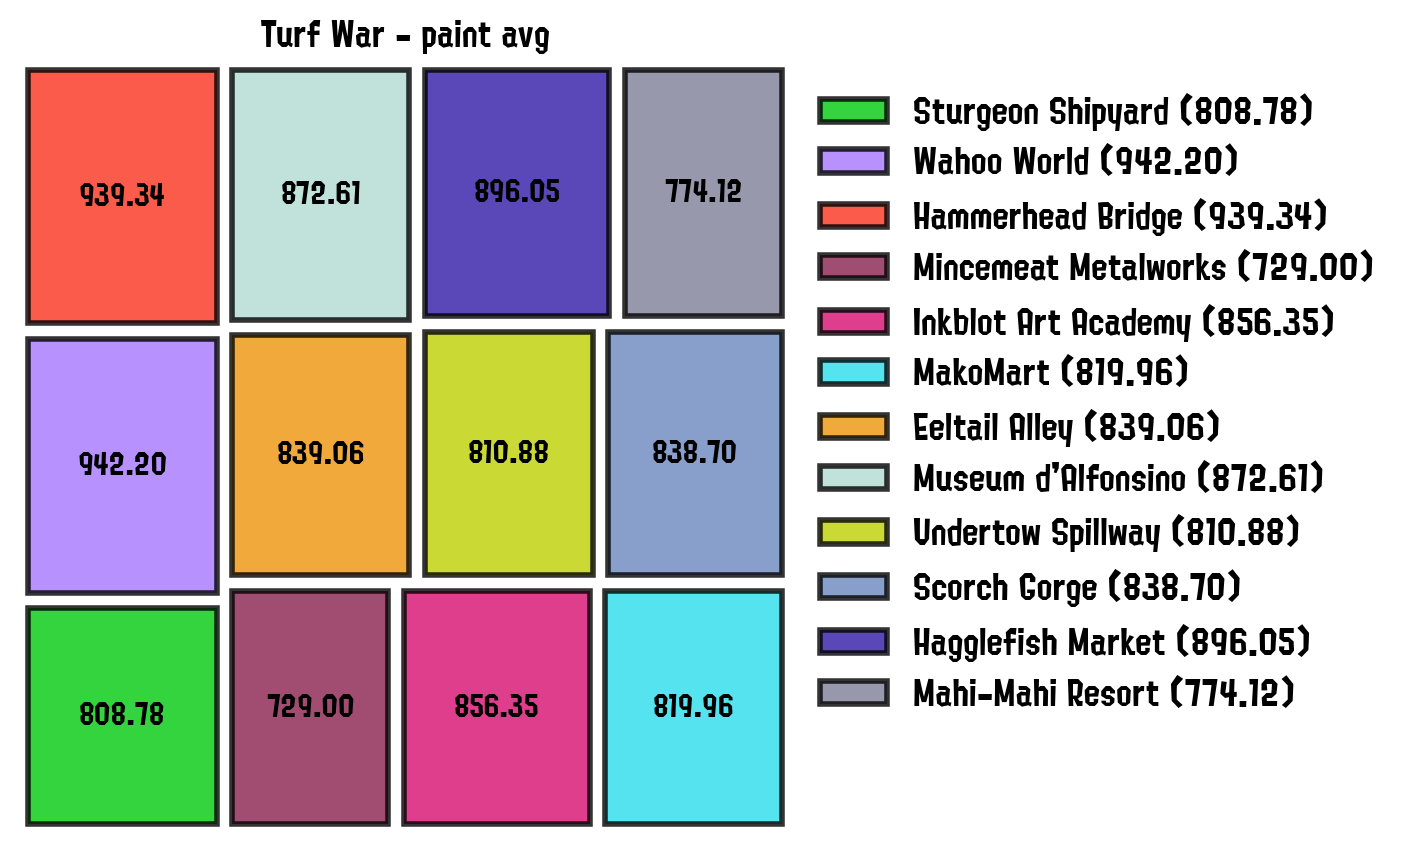
Moreover, these plots can be generated for any arbitrary key in the dataframe: main weapon, sub weapon, head gear, etc.
Author
Check out the blogposts on my website with more information about the development, planned features, and some analyses on my own Splatoon matches data!

Release history Release notifications | RSS feed


Download files
Download the file for your platform. If you're not sure which to choose, learn more about installing packages.
Source Distribution
Built Distribution
Filter files by name, interpreter, ABI, and platform.
If you're not sure about the file name format, learn more about wheel file names.
Copy a direct link to the current filters
File details
Details for the file SplatStats-6.0.0.tar.gz.
File metadata
- Download URL: SplatStats-6.0.0.tar.gz
- Upload date:
- Size: 64.2 kB
- Tags: Source
- Uploaded using Trusted Publishing? No
- Uploaded via: twine/5.0.0 CPython/3.10.13
File hashes
| Algorithm | Hash digest | |
|---|---|---|
| SHA256 |
b4c120a51676d626ef5499ca108286fa3c87006d91a075d55b863eab1b07034d
|
|
| MD5 |
5096e6a19e2cc6ba2f9f1cf3ca01bc1f
|
|
| BLAKE2b-256 |
e778145a04ef0f9e19a4c421de4ff5d2f1d0b33e40bedf1210658fc684748c67
|
File details
Details for the file SplatStats-6.0.0-py3-none-any.whl.
File metadata
- Download URL: SplatStats-6.0.0-py3-none-any.whl
- Upload date:
- Size: 67.4 kB
- Tags: Python 3
- Uploaded using Trusted Publishing? No
- Uploaded via: twine/5.0.0 CPython/3.10.13
File hashes
| Algorithm | Hash digest | |
|---|---|---|
| SHA256 |
afa9e215928413878f4c4a06552b3b276289287505df476d2246304dbb308a0d
|
|
| MD5 |
139d7027c9af6ac324de5480a16d6584
|
|
| BLAKE2b-256 |
2fd1347bf129bf4dcdf8ab84f4ccf2470637731a54d647663e76c97078e60e01
|


