

StripeSankey fits a mixed membership model at several k (a sweep) and draws all of it as one figure. Every ribbon entering or leaving a node sums to exactly that node, and a ribbon's thickness is a number of samples you can read off.
The pipeline supports LDA and NMF, and takes three tables: a count matrix, a per-feature annotation (like taxa in microbiome) and per-sample metadata.
| table | index | columns |
|---|---|---|
counts |
sample id | feature id |
feature_annotation |
feature id | annotation levels |
metadata |
sample id | sample variables |
The pipeline also lets users bring their own sweep, computed elsewhere (see Fit your customized models).
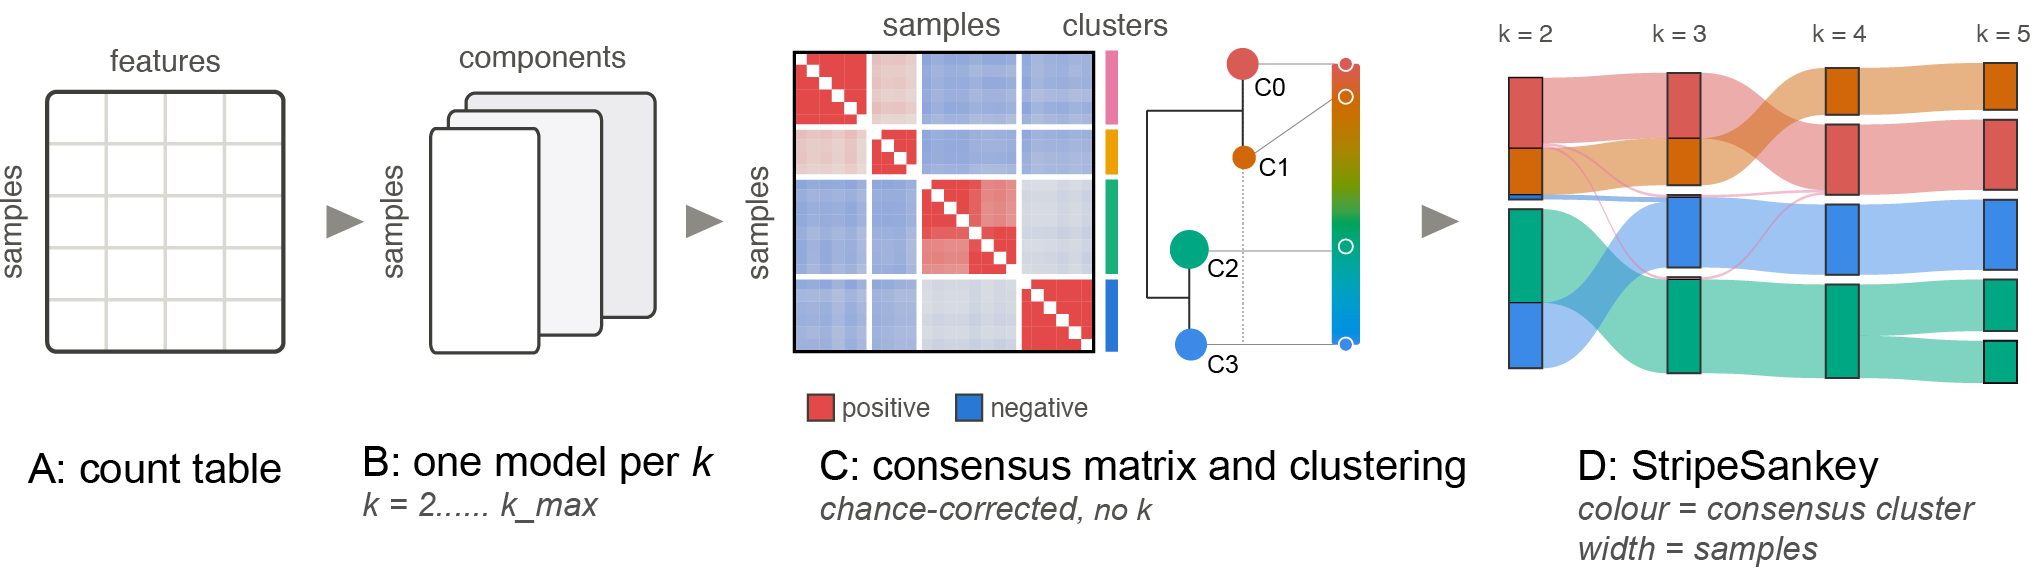
pip install stripesankey
Fit models with StripeSankey
1 — prepare
prepare checks that the three tables line up (matching sample and feature ids, usable counts), collapses the counts to one annotation level if you give one, and writes the result to base/intermediate/ for sweep to read.
import stripesankey as ss
base = 'LOCAL FOLDER PATH TO SAVE CACHE'
# fit LDA/NMF models via StripeSankey, example of microbiome count table
ss.prepare(base, counts, feature_annotation, metadata, level="genus")
level is any column of feature_annotation. For instance, in microbiome or ecology, you may want to group your count table at genus level.
2 — sweep
One fit per k, each saved to disk as it finishes.
ss.sweep(base, k_range=range(2, 11), implementation="nmf", random_state=42)
Implementations include:
| Algorithm | implementation | source lib | API |
|---|---|---|---|
LDA |
Variational Bayes | gensim | lda_gensim |
LDA |
Markov Chain Monte Carlo | MALLET | lda_mallet |
NMF |
generalized KL loss, initialised with nndsvdar | scikit-learn | nmf |
lda_mallet takes one more argument, mallet: the path to MALLET's bin/mallet launcher. MALLET is a Java program and is not bundled with StripeSankey, so download it yourself and make sure Java is availble.
ss.sweep(base, k_range=range(2, 11), implementation="lda_mallet",
         mallet="/path/to/Mallet", random_state=42)
Expect lda_mallet to be much slower than lda_gensim and nmf, for two reasons:
- MALLET fits LDA by Markov chain Monte Carlo (collapsed Gibbs sampling)
- Convergence has to be watched.
After fitting, results are saved in the base folder with the structure below:
base/
├── intermediate/                       # written by prepare
│   ├── features.csv
│   ├── feature_annotation.csv
│   ├── manifest.json
│   └── mallet/corpus.txt               # the count table as MALLET's input
└── results/                            # written by sweep
    ├── W/W_{k}.csv                     # one file per k
    ├── H/H_{k}.csv                     # one file per k
    ├── diagnostics/topic_diff_{k}.csv  # LDA (gensim) only
    ├── diagnostics/ll_{k}.csv          # LDA (MALLET) only
    ├── consensus.json                  # consensus cluster of each sample
    ├── run_info.json                   # k list, implementation, convergence per k
    └── metrics.csv
| shape | on disk | |
|---|---|---|
W |
sample × LC | results/W/W_{k}.csv |
H |
LC × feature | results/H/H_{k}.csv |
Fit your customized models
Bring your own model via python
Define a function that takes k and a seed and returns an unfitted model, then pass it as implementation. sweep fits it at every k and saves W, H and the consensus, as it does for the built-in implementations:
from sklearn.decomposition import NMF

def my_nmf(k, seed):
    return NMF(n_components=k, beta_loss="kullback-leibler", solver="mu",
               init="nndsvdar", max_iter=3000, random_state=seed)

ss.sweep(base, k_range=range(2, 11), implementation=my_nmf, random_state=42)
The model needs scikit-learn's interface: fit_transform(X) returns W (sample × LC) and components_ holds H (LC × feature).
Bring your own sweep via other programming languages
If your model runs in another language, such as R, or in a well-established tool like ADMIXTURE, run the sweep there and save each W as base/results/W/W_{k}.csv: the sample id in the first column, then one column per LC, rows summing to 1, and the same samples in the same order at every k. Then run sweep without k_range:
ss.sweep(base)
example/population does this with pong's precomputed ADMIXTURE results for the 1000 Genomes (K = 2…8).
Plotting
Both figures read the sweep from base, wherever it was fitted.
stripesankey — coloured by consensus cluster
fig = ss.stripesankey(base, metadata_df=metadata, hover_field=["group"])
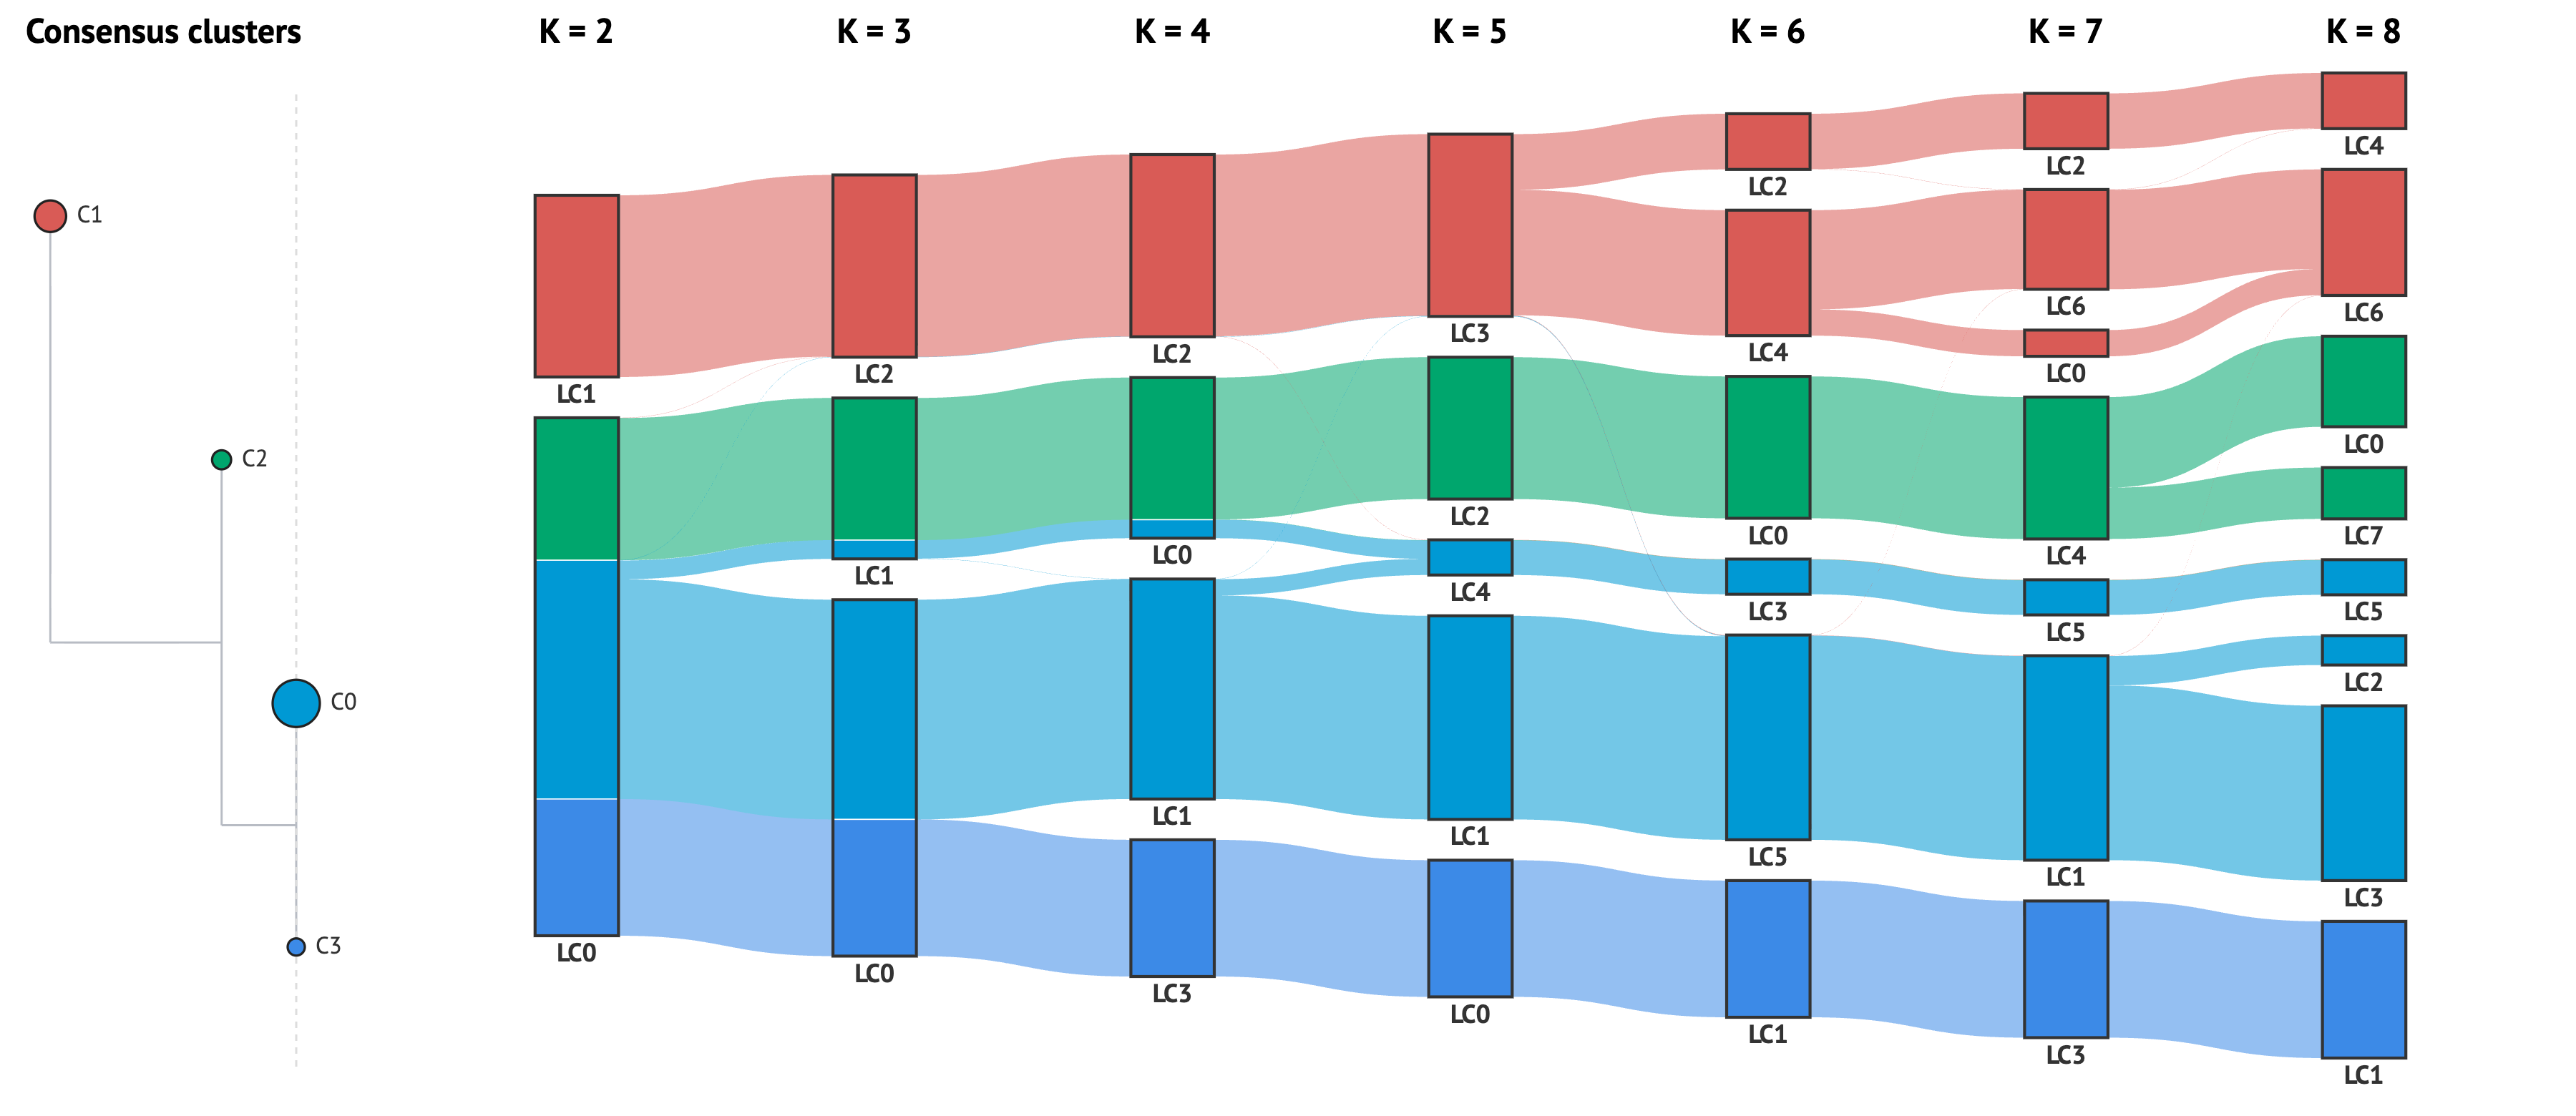
An interactive version is available in example/population/viz/stripesankey_K2-8.html.
Click a band, a ribbon or a cluster chip to trace those samples across every
k. Click a K = label to focus that column — it restacks by the first
hover_field. Read the selection back from fig.selected_samples.
metasankey — the same figure, cut by metadata
fig = ss.metasankey(base, metadata_df=metadata, hover_field=["group"])
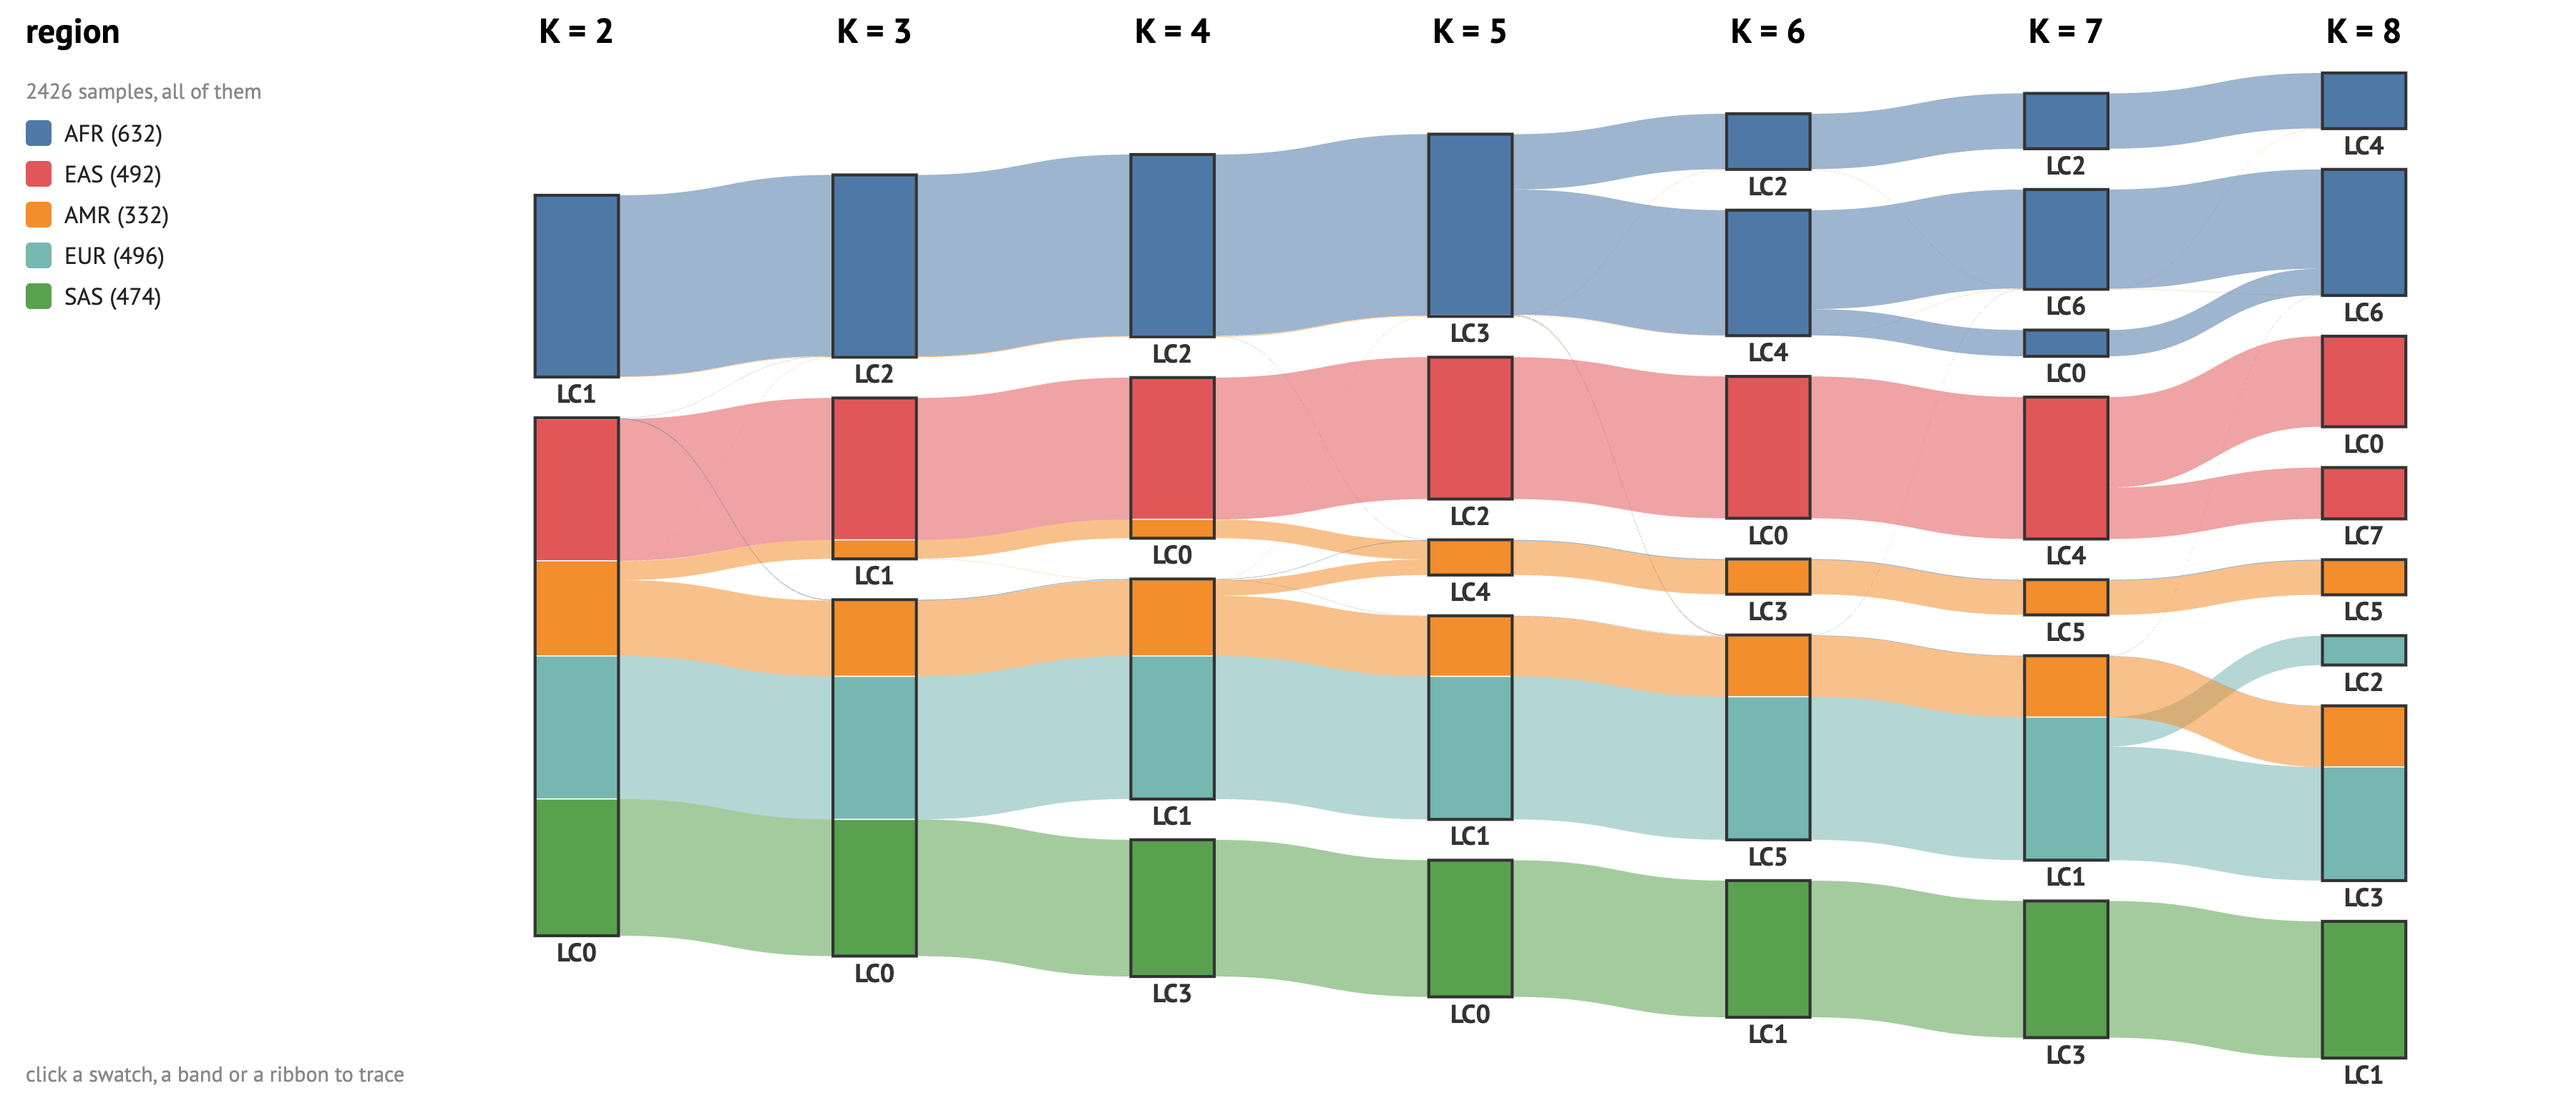
An interactive version is available in example/population/viz/metasankey_K2-8.html.
Identical layout, one thing changed: a node is sliced into a metadata field's categories instead of into clusters.
affinity heatmap — the matrix the clusters came from
Q = ss.consensus_affinity(ss.load_W(base))                                         # the affinity matrix
fig, order, labels = ss.affinity_heatmap(Q, above=metadata, annotations=["group"])  # the plot
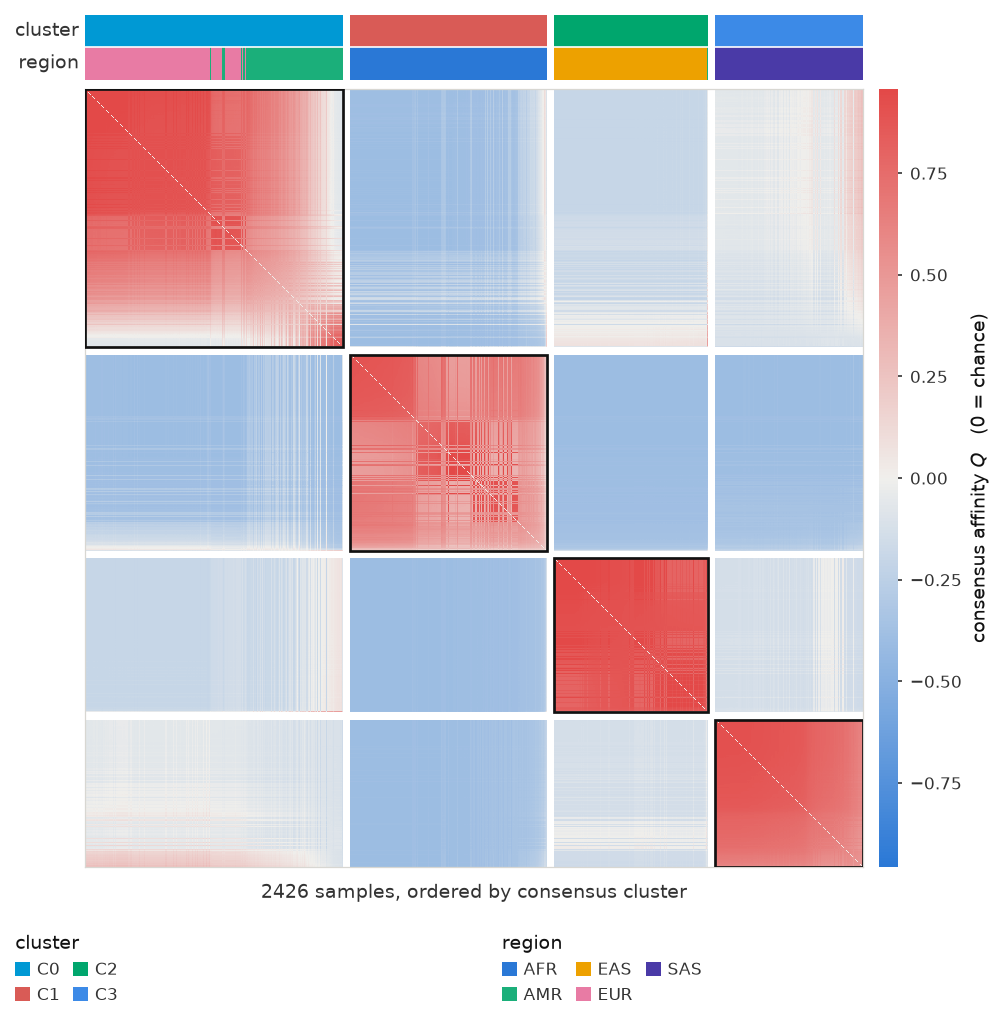
Q is the signed, chance-corrected co-membership: positive means two samples
share components more than chance, negative less. Samples are ordered by
consensus cluster by default.
Hard labels
For an ensemble of hard labels instead of soft assignments — k-means at
several k, or different algorithms at one k:
fig = ss.hardstripe(labels_df, colorby="consensus", metadata_df=metadata)
Citation
License
MIT
1 maintainer

Metadata
1 maintainer
Release files for StripeSankey 0.4.1
For a detailed explanation of source distributions (sdists) and built distributions (wheels), please see the package formats documentation.
Source distribution (sdist)
| File | Size | Uploaded | Provenance | |
|---|---|---|---|---|
| stripesankey-0.4.1.tar.gz | 2.2 MB | Without provenance | Details |
Built distribution (wheel)
| File | Interpreter | ABI | Platform | Reset |
|---|---|---|---|---|
| stripesankey-0.4.1-py3-none-any.whl | Python 3 | none | any | Details |
Total release size: 2.4 MB
Release files / stripesankey-0.4.1.tar.gz
| Download URL | stripesankey-0.4.1.tar.gz |
|---|---|
| Size | 2.2 MB |
| Tags | Source |
|
SHA-256 checksum How to use checksums |
10d818cfa347f3a031248cbc3e99963f7273f53279f8ac21008d0334014e407d
|
|
BLAKE2b-256 checksum How to use checksums |
84468795038278fdd71f62b0a4424146b5ad2532e48b9ceaa74d9777051ab845
|
| Upload date | |
|
Uploaded using Trusted Publishing? What is trusted publishing? |
No |
| Uploaded via |
uv/0.9.4
|
Release files / stripesankey-0.4.1-py3-none-any.whl
| Download URL | stripesankey-0.4.1-py3-none-any.whl |
|---|---|
| Size | 185.7 kB |
| Tags | Python 3 |
|
SHA-256 checksum How to use checksums |
7463e77f2f5662c93f18cf669e8c0ccb55702647dd5532d397f859416e04df65
|
|
BLAKE2b-256 checksum How to use checksums |
909228aa925147ec94679b2f022dc9e6abe3aa24bdb382f69535a5b2382752c8
|
| Upload date | |
|
Uploaded using Trusted Publishing? What is trusted publishing? |
No |
| Uploaded via |
uv/0.9.4
|
Security for StripeSankey 0.4.1
Provenance
Provenance describes where a file came from. On PyPI, provenance is shared via attestations, which provide a verifiable record of the build or publishing details. View details, limitations and caveats.
No provenance found
None of the files in this release were uploaded with provenance metadata.
A note on package security
PyPI is a repository for distributing packages, not a service for auditing them. While third-party security researchers and our staff do their best to detect and remove malicious packages, PyPI cannot guarantee the quality, security or suitability of any given package.














