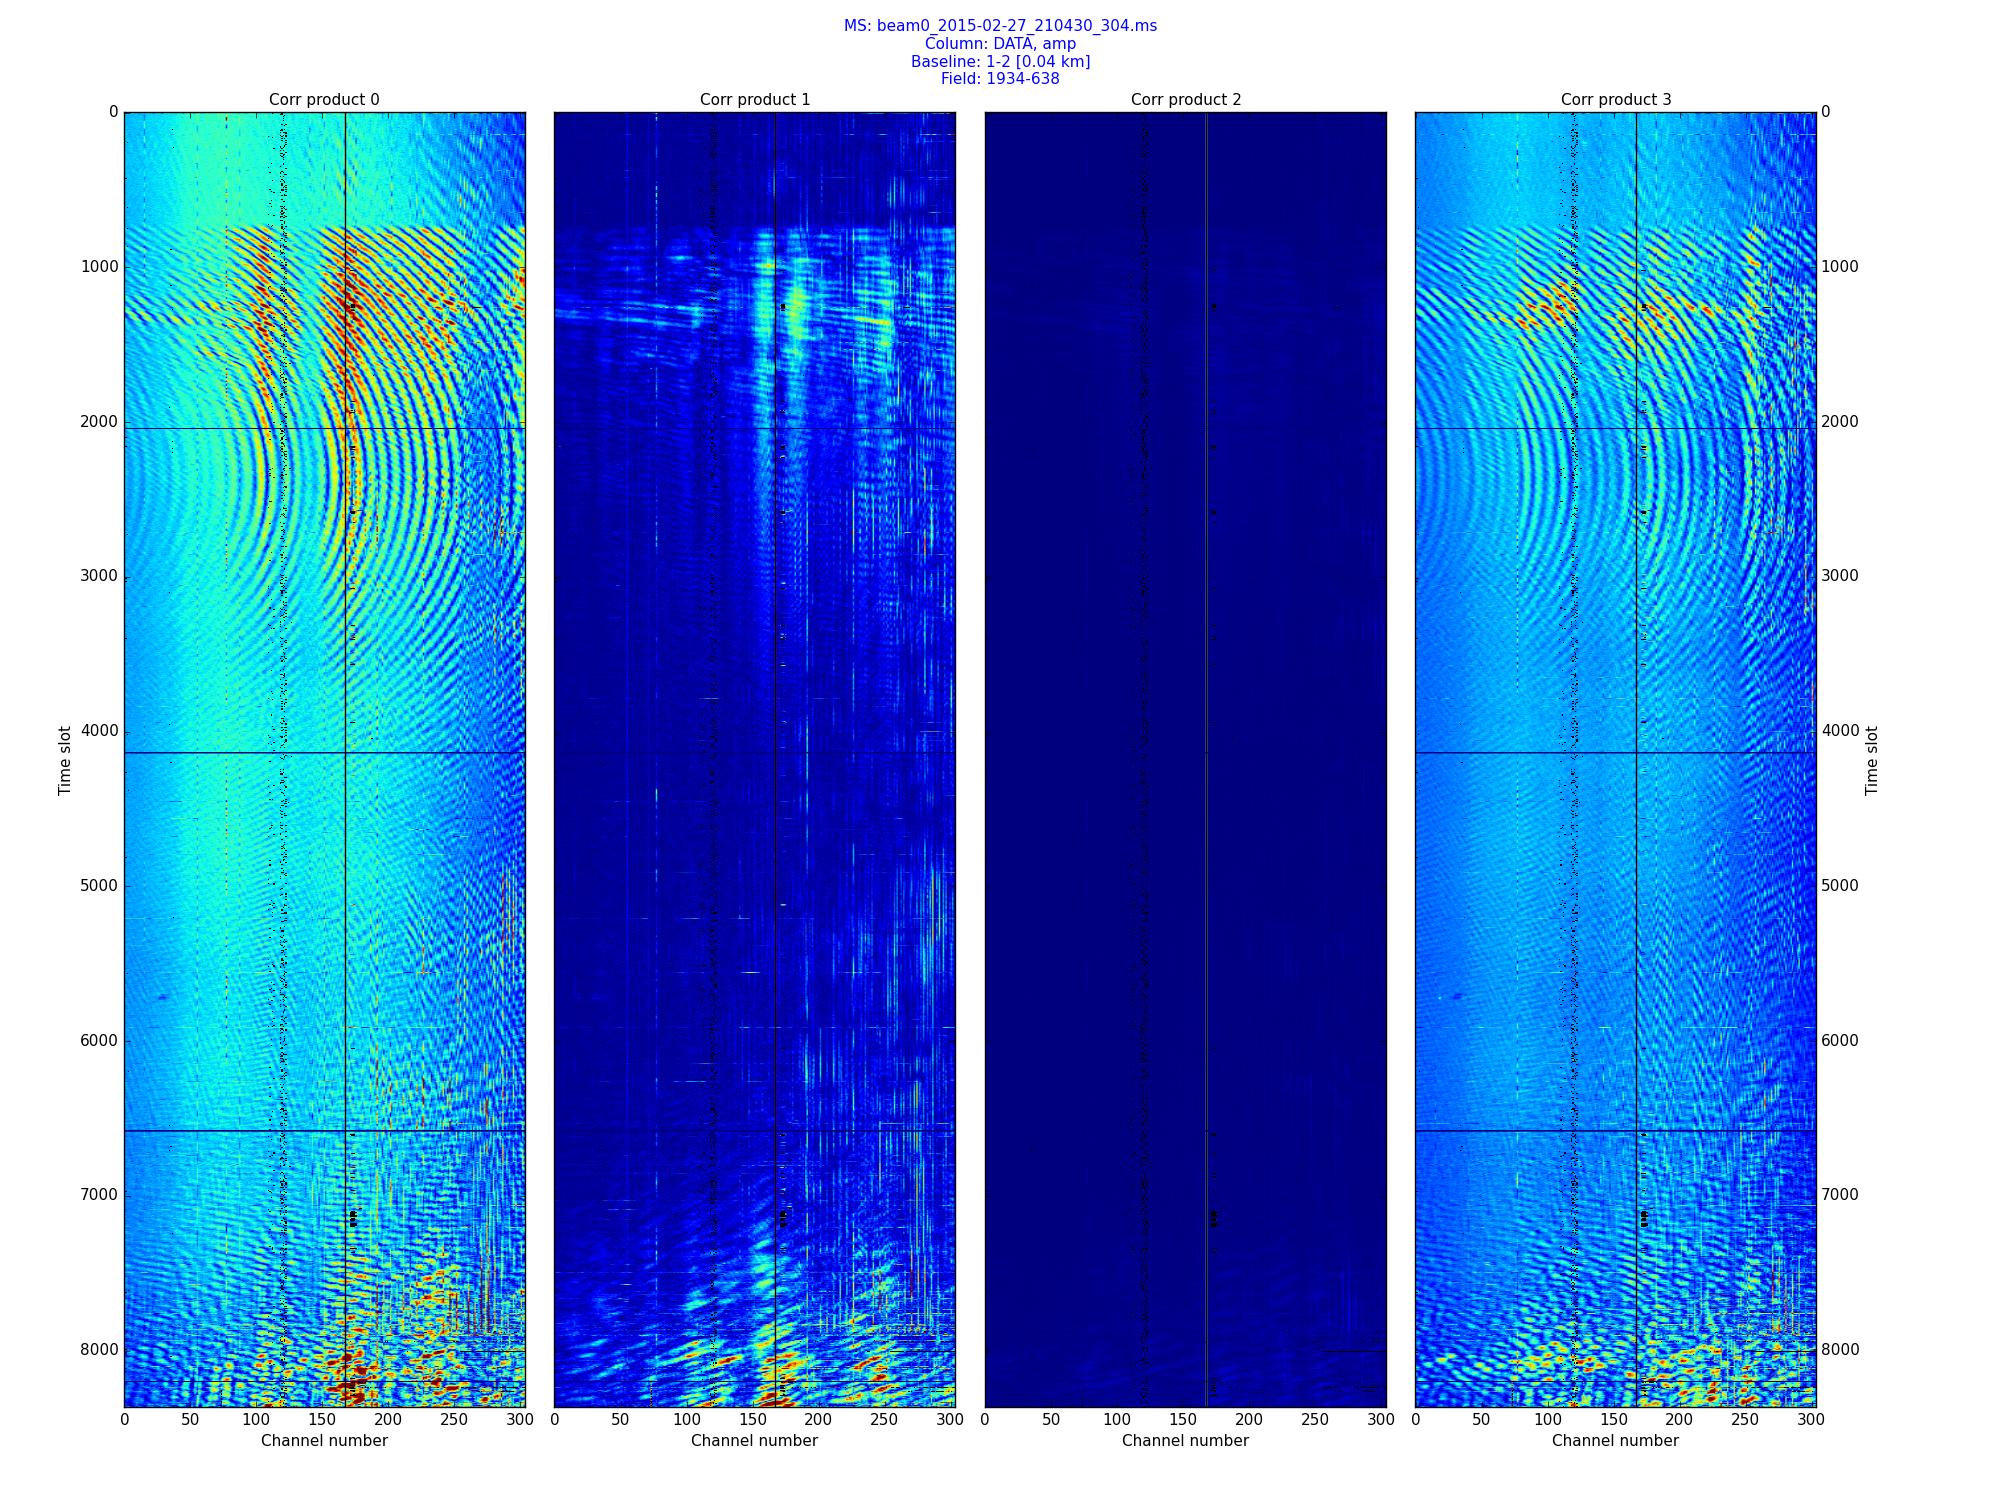
Per-baseline time/freq and Chi-Square plots
Project description
surfvis
Create per-baseline time/frequency plots from a Measurement Set. Uses pyrap.
Usage: surfvis.py [options] msname

Options:
  -h, --help            show this help message and exit
  -l, --list            List Measurement Set properties and exit
  -d COLUMN, --datacolumn=COLUMN
                        Measurement Set column to plot (default = DATA)
  -f FIELD, --field=FIELD
                        Field ID to plot (default = 0)
  -s MYSPW, --spw=MYSPW
                        Comma separated list of SPWs to plot (default = all)
  -p PLOT, --plot=PLOT  Set to amp, phase, real or imag (default = amp)
  -i ANTENNA1, --i=ANTENNA1
                        Antenna 1: plot only this antenna
  -j ANTENNA2, --j=ANTENNA2
                        Antenna 2: use with -i to plot a single baseline
  --scale=SCALE         Scale the image peak to this multiple of the per-corr
                        min/max (ignored for phases)
  --cmap=MYCMAP         Matplotlib colour map to use (default = jet)
  -o FOLDERNAME, --opdir=FOLDERNAME
                        Output folder to store plots (default = msname___plots)
Plotting can be quite slow for large Measurement Sets. Will probably also fail if you have SPWs with different time/freq shapes. Use of the -s switch can generally get around this.
Project details
Release history Release notifications | RSS feed
Download files
Download the file for your platform. If you're not sure which to choose, learn more about installing packages.
Source Distribution
surfvis-0.0.1.tar.gz
(10.4 kB
view details)
Built Distribution
surfvis-0.0.1-py3-none-any.whl
(12.2 kB
view details)
File details
Details for the file surfvis-0.0.1.tar.gz.
File metadata
- Download URL: surfvis-0.0.1.tar.gz
- Upload date:
- Size: 10.4 kB
- Tags: Source
- Uploaded using Trusted Publishing? No
- Uploaded via: twine/4.0.0 CPython/3.9.13
File hashes
| Algorithm | Hash digest | |
|---|---|---|
| SHA256 | a97093e9c4f57793b2f2341f66f8374e62fe4e85e6d1e49970f81c8c7316843c |
|
| MD5 | d4c12dee9a5bb438cb8d1f8da1223243 |
|
| BLAKE2b-256 | a21e178a0ffd467e03cb62a6f9bf6dd4e5d48dd485ecbaa517f754b47e014a74 |
File details
Details for the file surfvis-0.0.1-py3-none-any.whl.
File metadata
- Download URL: surfvis-0.0.1-py3-none-any.whl
- Upload date:
- Size: 12.2 kB
- Tags: Python 3
- Uploaded using Trusted Publishing? No
- Uploaded via: twine/4.0.0 CPython/3.9.13
File hashes
| Algorithm | Hash digest | |
|---|---|---|
| SHA256 | cfd3b31602016c1eb229473419cc70c4bd4c81b6179748765d7fe9e46108f2e1 |
|
| MD5 | 33cf31ee4eaeba12f03352ff5fa31ddd |
|
| BLAKE2b-256 | 6bd52bd662cae28471bf913b94999bd36b7d49467f8537ae6dc8b7117a995925 |


