
TAcharts 0.0.29
By: Carl Farterson
Contributors: @rnarciso, @t3ch9
This repository provides technical tools to analyze OHLCV data, along with several TA chart functionalities. These functions are optimized for speed and utilize numpy vectorization over built-in pandas methods when possible.
Methods
Indicators With Chart Functionality
Bollinger(df=None, filename=None, interval=None, n=20, ndev=2): Bollinger BandsIchimoku(df=None, filename=None, interval=None): Ichimoku CloudRenko(df=None, filename=None, interval=None): Renko Chart
Indicators Without Chart Functionality
atr(high, low, close, n=2): average true range from candlestick datacmf(df, n=2): Chaikin Money Flow of an OHLCV datasetdouble_smooth(src, n_slow, n_fast): The smoothed value of two EMAsema(src, n=2): exponential moving average for a list ofsrcacrossnperiodsmacd(src, slow=25, fast=13): moving average convergence/divergence ofsrcmmo(src, n=2): Murrey Math oscillator ofsrcroc(src, n=2): rate of change ofsrcacrossnperiodsrolling(src, n=2, fn=None, axis=1): rollingsum,max,min,mean, ormedianofsrcacrossnperiodsrsi(src, n=2): relative strength index ofsrcacrossnperiodssdev(src, n=2): standard deviation across n periodssma(src, n=2): simple moving average ofsrcacrossnperiodstd_sequential(src, n=2): TD sequential ofsrcacrossnperiodstsi(src, slow=25, fast=13): true strength indicator
utils
area_between(line1, line2): find the area between line1 and line2crossover(x1, x2): find all instances of intersections between two linesdraw_candlesticks(ax, df): add candlestick visuals to a matplotlib chartfill_values(averages, interval, target_len): Fill missing values with evenly spaced samples.- Example: You're using 15-min candlestick data to find the 1-hour moving average and want a value at every 15-min mark, and not every 1-hour mark.
group_candles(df, interval=4): combine candles so instead of needing a different dataset for each time interval, you can form time intervals using more precise data.- Example: you have 15-min candlestick data but want to test a strategy based
on 1-hour candlestick data (
interval=4).
- Example: you have 15-min candlestick data but want to test a strategy based
on 1-hour candlestick data (
intersection(a0, a1, b0, b1): find the intersection coordinates between vector A and vector B
How it works
Create your DataFrame
# NOTE: we are using 1-hour BTC OHLCV data from 2019.01.01 00:00:00 to 2019.12.31 23:00:00
from TAcharts.utils.ohlcv import OHLCV

df = OHLCV().btc

df.head()
| date | open | high | low | close | volume | |
|---|---|---|---|---|---|---|
| 0 | 2019-01-01 00:00:00 | 3699.95 | 3713.93 | 3697.00 | 3703.56 | 660.279771 |
| 1 | 2019-01-01 01:00:00 | 3703.63 | 3726.64 | 3703.34 | 3713.83 | 823.625491 |
| 2 | 2019-01-01 02:00:00 | 3714.19 | 3731.19 | 3707.00 | 3716.70 | 887.101362 |
| 3 | 2019-01-01 03:00:00 | 3716.98 | 3732.00 | 3696.14 | 3699.95 | 955.879034 |
| 4 | 2019-01-01 04:00:00 | 3699.96 | 3717.11 | 3698.00 | 3713.07 | 534.113945 |
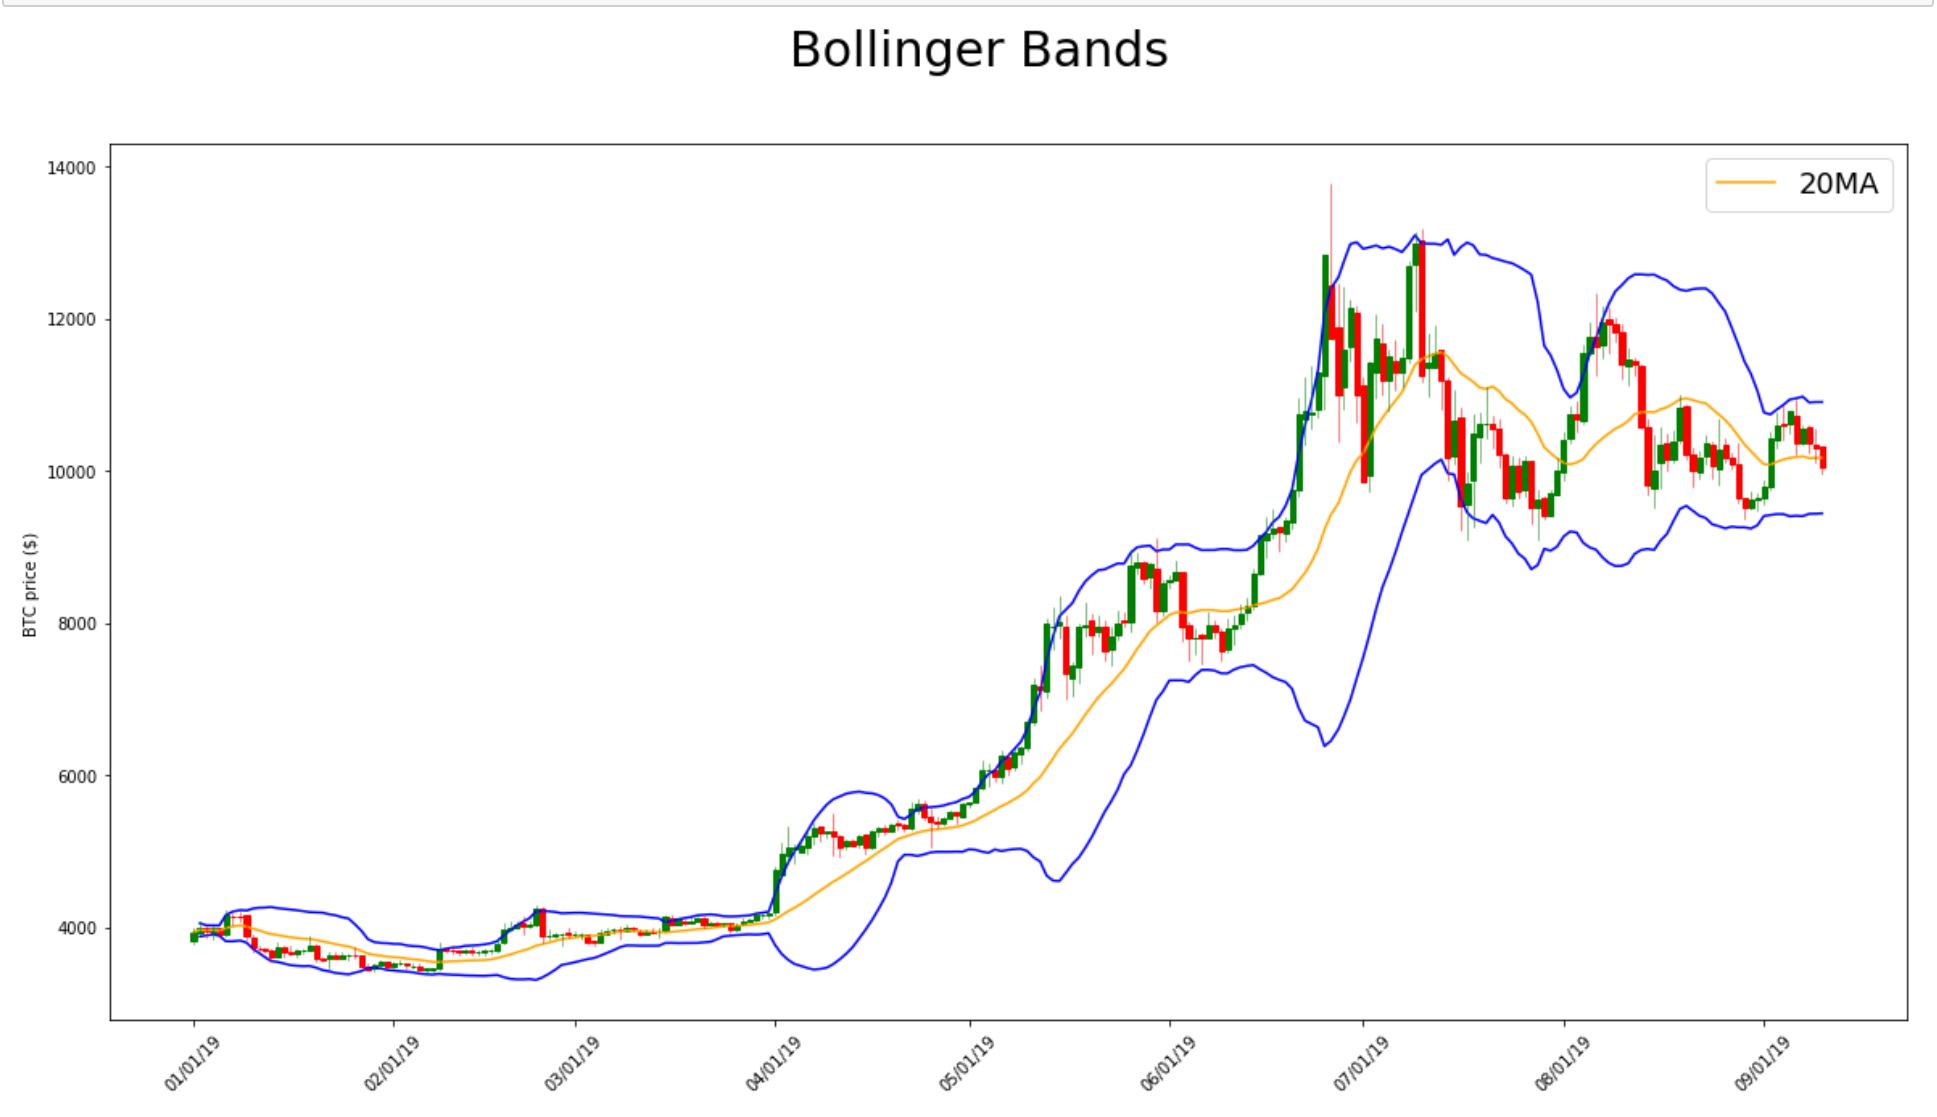
Bollinger Bands
from TAcharts.indicators.bollinger import Bollinger

b = Bollinger(df)
b.build(n=20, ndev=2)

b.plot()
Ichimoku
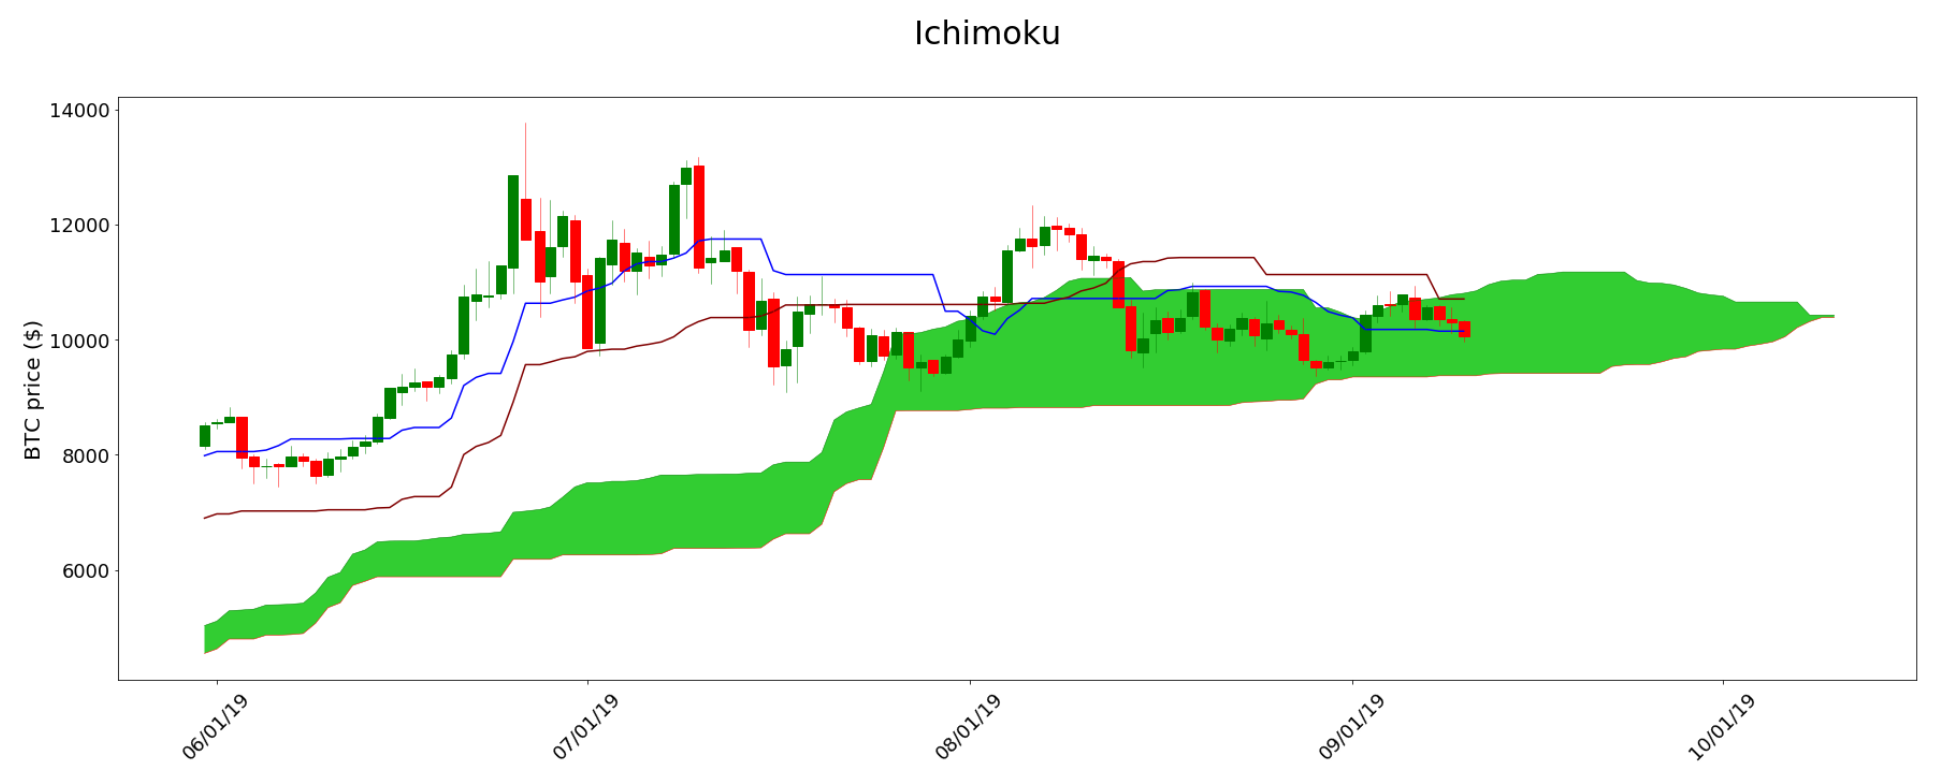
from TAcharts.indicators.ichimoku import Ichimoku

i = Ichimoku(df)
i.build(20, 60, 120, 30)

i.plot()
Renko
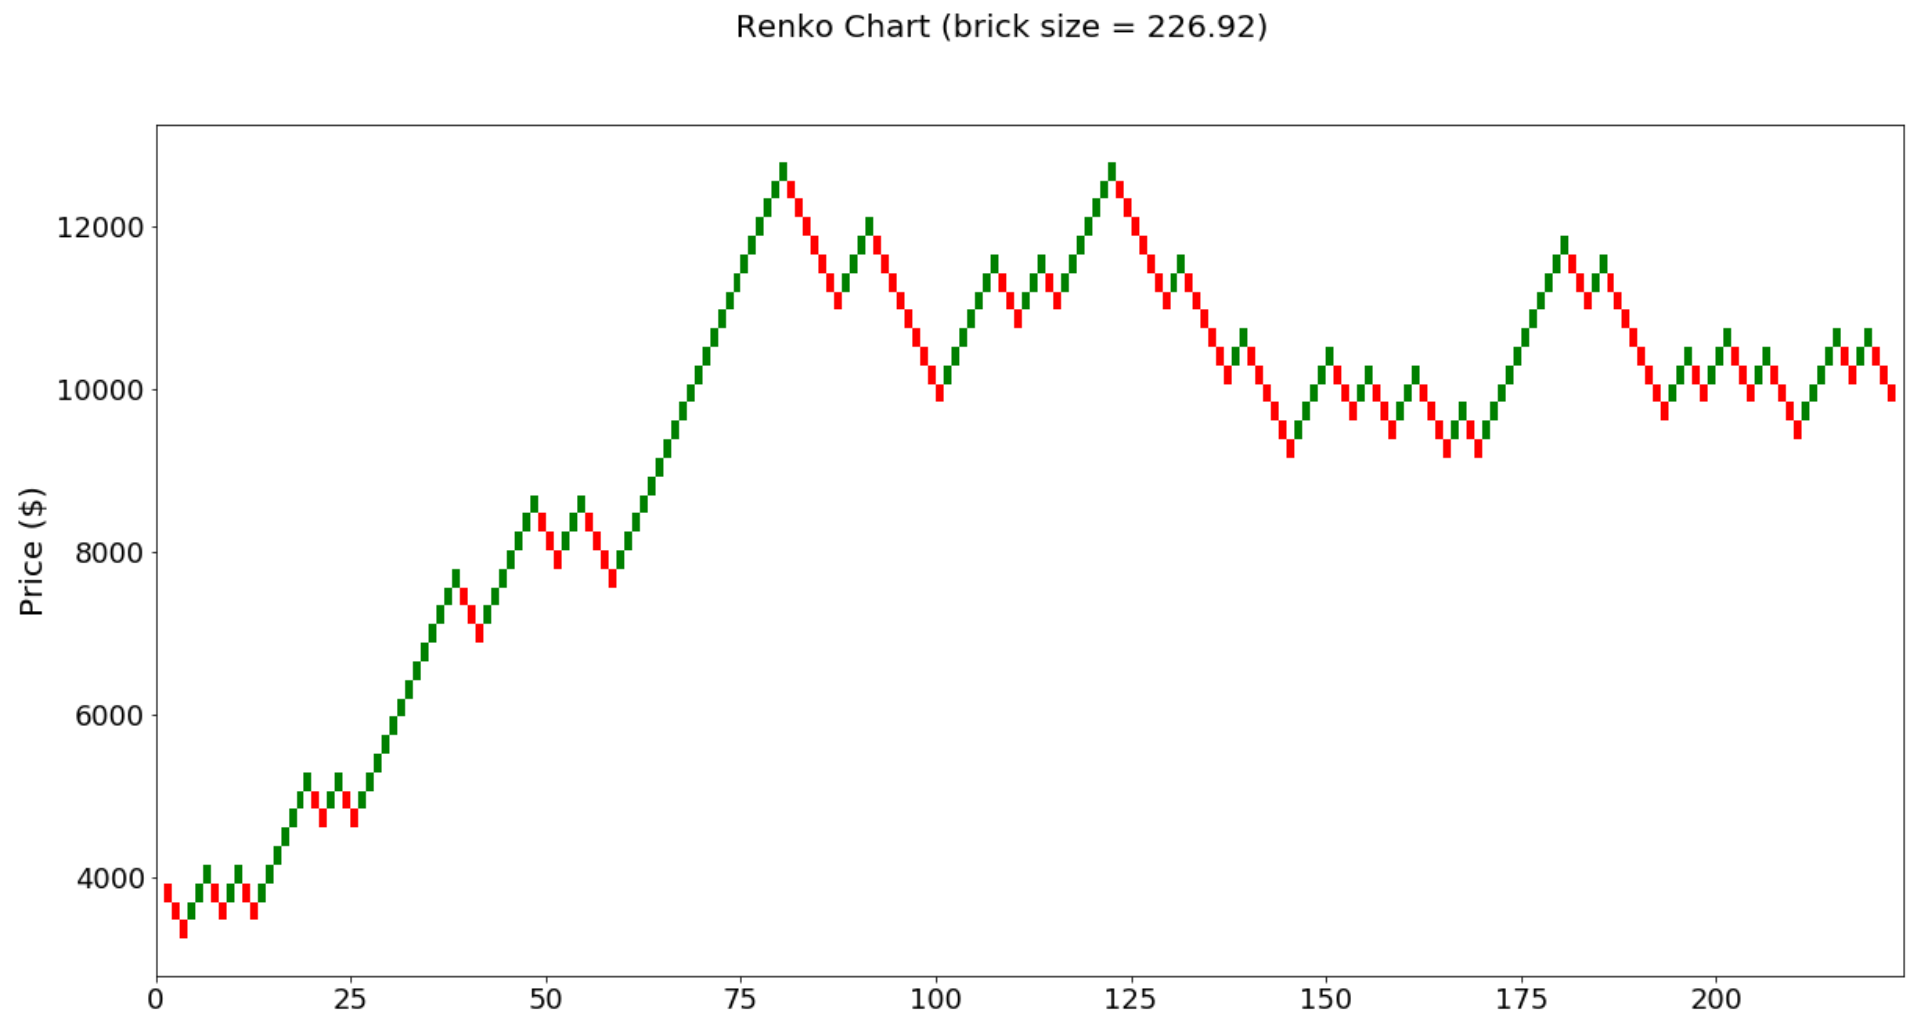
from TAcharts.indicators.renko import Renko

r = Renko(df)
r.set_brick_size(auto=True, atr_interval=2)
r.build()

r.plot()
wrappers
-
@args_to_dtype(dtype): Convert all function arguments to a specific data typefrom TAcharts.wrappers import args_to_dtype # Example: `src` is converted to a list @args_to_dtype(list) def rsi(src, n=2): pass
-
@pd_series_to_np_array: Convert function arguments frompd.Seriestonp.arrayusingpd.Series.values. This wrapper is 10x quicker than using@args_to_dtype(np.array)when working with Pandas series.from TAcharts.wrappers import pd_series_to_np_array # Example: `high`, `low`, and `close` are all converted into `np.array` data types @pd_series_to_np_array def atr(high, low, close, n=14): pass
1 maintainer

Metadata
1 maintainer
Release files for TAcharts 0.0.29
For a detailed explanation of source distributions (sdists) and built distributions (wheels), please see the package formats documentation.
Source distribution (sdist)
| File | Size | Uploaded | |
|---|---|---|---|
| TAcharts-0.0.29.tar.gz | 14.6 kB | Details |
Built distribution (wheel)
| File | Interpreter | ABI | Platform | Reset |
|---|---|---|---|---|
| TAcharts-0.0.29-py3-none-any.whl | Python 3 | none | any | Details |
Total release size: 49.5 kB
Release files / TAcharts-0.0.29.tar.gz
| Download URL | TAcharts-0.0.29.tar.gz |
|---|---|
| Size | 14.6 kB |
| Tags | Source |
|
SHA-256 checksum How to use checksums |
3111b98845a4a572a2a1e1a7bada31c1279dcec6dbe0a91d0b49b7b2507deb2e
|
|
BLAKE2b-256 checksum How to use checksums |
b705a9c56974a29348bafd462addc5fccb3b5ea22c20565dc90b333c09b32962
|
| Upload date | |
|
Uploaded using Trusted Publishing? What is trusted publishing? |
No |
| Uploaded via |
twine/3.3.0 pkginfo/1.6.1 requests/2.25.1 setuptools/51.0.0 requests-toolbelt/0.9.1 tqdm/4.55.0 CPython/3.8.6
|
Release files / TAcharts-0.0.29-py3-none-any.whl
| Download URL | TAcharts-0.0.29-py3-none-any.whl |
|---|---|
| Size | 34.9 kB |
| Tags | Python 3 |
|
SHA-256 checksum How to use checksums |
e48214c519a9d012be92b41a96781c6d91d33c363bc8cde54bbee22dcafb6d0a
|
|
BLAKE2b-256 checksum How to use checksums |
d2b7644979017f40130e2a3bf56a7eabab428122fc855ee0b43165ac69d907ad
|
| Upload date | |
|
Uploaded using Trusted Publishing? What is trusted publishing? |
No |
| Uploaded via |
twine/3.3.0 pkginfo/1.6.1 requests/2.25.1 setuptools/51.0.0 requests-toolbelt/0.9.1 tqdm/4.55.0 CPython/3.8.6
|














