Track Analyzer: quantification and visualization of tracking data


Project description


Track Analyzer :microscope: :bar_chart:
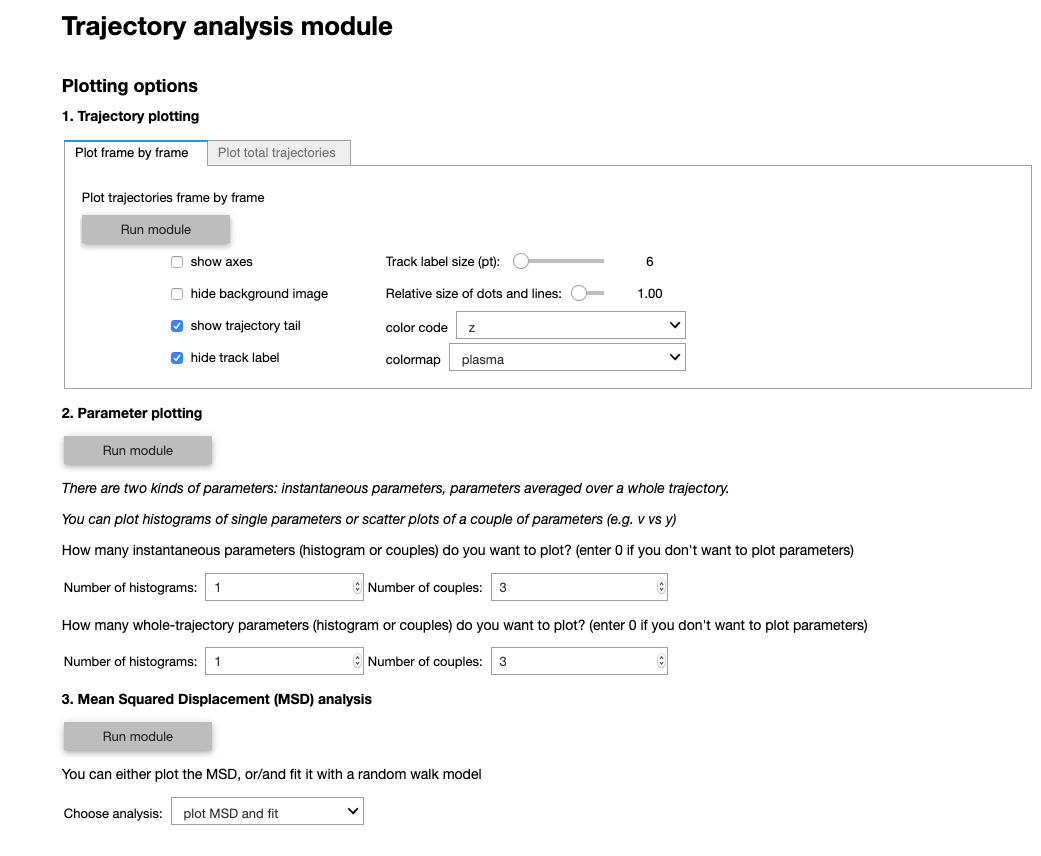
Track Analyzer is Python-based data visualization pipeline for tracking data. It does not perform any tracking, but visualizes and quantified any kind of tracked data. It analyzes trajectories by computing standard quantities such as velocity, acceleration, diffusion coefficient, local density, etc. Trajectories can also be plotted on the original image in 2D or 3D using custom color coding.
Track Analyzer provides a filtering section that can extract subsets of data based on spatiotemporal criteria. The filtered subsets can then be analyzed either independently or compared. This filtering section also provides a tool for selecting specific trajectories based on spatiotemporal criteria which can be useful to perform fate mapping and back-tracking.
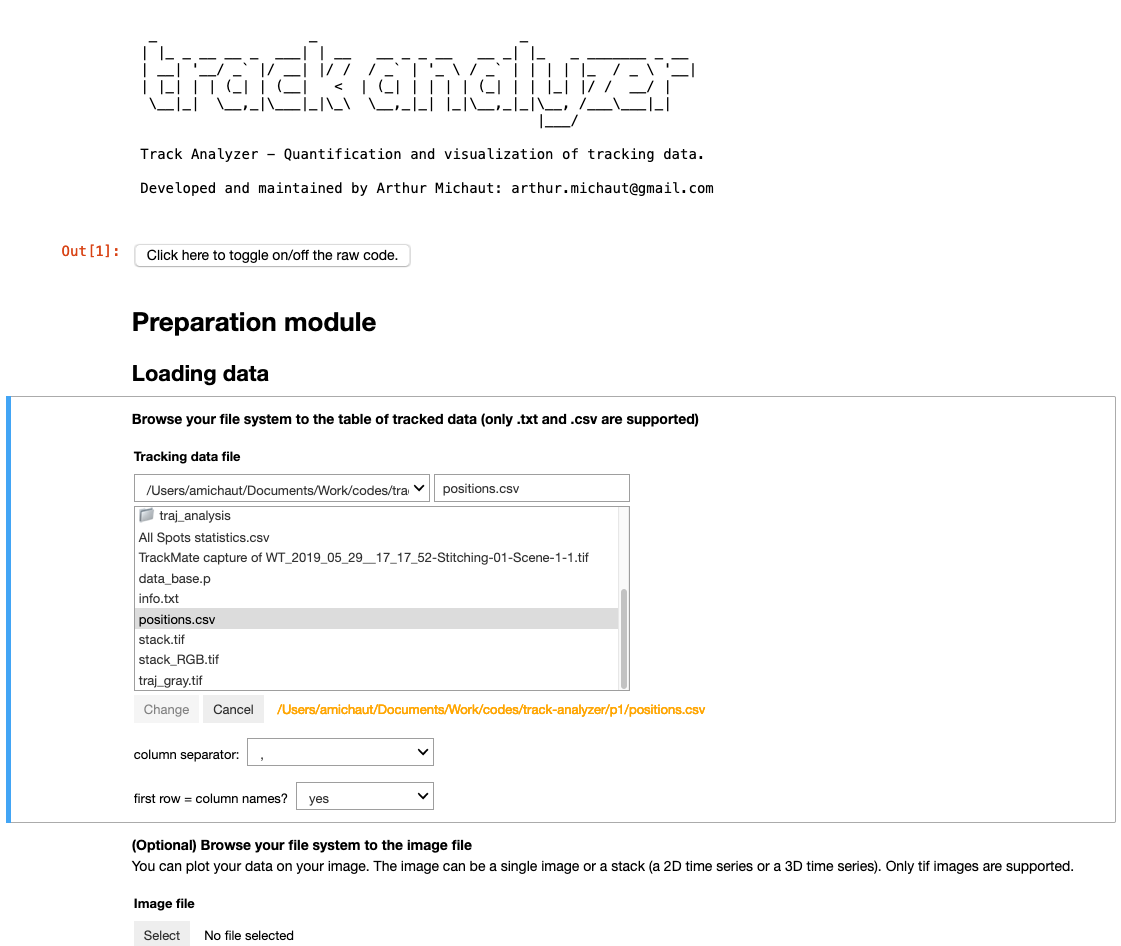
Track Analyzer can be run without any programming knowledge using its graphical interface. The interface is launched by running a Jupyter notebook containing widgets allowing the user to load data and set parameters without writing any code.
Data requirements
Track Analyzer needs as input a text file (csv or txt file) of tracked data containing the position coordinates (in 2D or 3D) along time and the tracks identifiers. Optionally, data can be plotted on the original image provided as a 3D or 4D tiff stack (ie. 2D+time or 3D+time). If the format of your movie is different (list of images), please convert it to tiff stack using Fiji for instance.
The position file must contain columns with the x, y, (z) positions, a frame column and track id column. The positions coordinates can be in pixels or in scaled data. The information about the scaling and other metadata such as time and length scales will be provided by the user through the graphical interface.
If Track Analyzer is run in command line (see below), the data directory must contain:
- a comma-separated csv file named positions.csv which column names are: x, y, (z), frame, track
- a text file named info.txt containing the metadata (see example)
- (optional) a tiff file named stack.tif
Installation
with conda
- If you haven't installed Python yet, install Python 3.7: download miniconda 3.7: https://docs.conda.io/en/latest/miniconda.html
- Open a Terminal (Mac & Linux) or open an Anaconda powershell (Windows)
- Create environment: run
conda create -n pyTA python=3.7 - Activate environment (to be run every time you open a new terminal): run :
conda activate pyTA
To install Track Analyzer, just run:
pip install track-analyzer
with a virtualenv
you can also use a virtual environment
    python3 -m venv pyTA
    cd pyTA
    source bin/activate
    pip install track-analyzer
to exit from the virtualenv
deactivate
To run track-analyzer
    cd pyTA
    source bin/activate
Documentation
You can find a complete documentation

Troubleshooting
The 3D visualization and the drawing selection tool depend on the napari package. The installation of this package can lead to issues depending on your system. If you are not able to solve this installation, you will not be able to have access to 3D rendering. However, you will still be able to use Track Analyzer without the drawing tool, by using coordinates sliders in the graphical interface.
Release history Release notifications | RSS feed


Download files
Download the file for your platform. If you're not sure which to choose, learn more about installing packages.
Source Distribution
File details
Details for the file track_analyzer-0.2.tar.gz.
File metadata
- Download URL: track_analyzer-0.2.tar.gz
- Upload date:
- Size: 17.6 MB
- Tags: Source
- Uploaded using Trusted Publishing? No
- Uploaded via: twine/3.4.1 importlib_metadata/3.10.0 pkginfo/1.7.0 requests/2.25.1 requests-toolbelt/0.9.1 tqdm/4.59.0 CPython/3.8.3
File hashes
| Algorithm | Hash digest | |
|---|---|---|
| SHA256 |
048bc3139c0e63d1e7c13519f70fef8dc07d928dcf8667c0d523d7c508877de8
|
|
| MD5 |
67fd83f5d5d65d558ccb2c84fd8bdc9b
|
|
| BLAKE2b-256 |
38989e893d7e46dfe80b0d68d318b60b37e03a00e82b77b3638f52a34820273e
|


