
Trafalgar🃏
Python library to make development of portfolio analysis faster and easier

Installation 🔥
To install Trafalgar, you should do:
pip install trafalgar.py
(https://pypi.org/project/trafalgars/0.0.2/#description)
For Anaconda setup you can simply run below to install all dependencies with env name trafalgar.
conda env create --file environment.yaml
Note : Step 1 and 2 are not always necessary, just make sure the libraries required by trafalgar are installed in you project env.
Features include 📈
- Get close price, open price, adj close, volume and graphs of these in one line of code!
- Build a efficient frontier programm in 3 lines of code
- Make quantitative analysis on stocks/portfolios (alpha, beta, skew, kurtosis, rolling volatility...)
- Build a Capital Asset Pricing Model of a portfolio
- Backtest a portfolio, see its stats and compare it to a benchmark
- many other thnigs...
Here is the code from a google collab, you can use it to follow along with the code: https://colab.research.google.com/drive/1qgFDDQneQP-oddbJVWWApfPKFMnbpj6I?usp=sharing
Credits ✌️
This library would not exist without the existence of Github and :
- the contributors @rslopes, @rakeshbhat9, @Haizzz
- Quantopian and their incredible lectures (https://gist.github.com/ih2502mk/50d8f7feb614c8676383431b056f4291)
- the authors of codingfinance.com
- Quantconnect
- @mrmushfiq and his repo https://github.com/mrmushfiq/python_meets_finance
Documentation🚀
Call the library
First, you should do:
from trafalgar import *
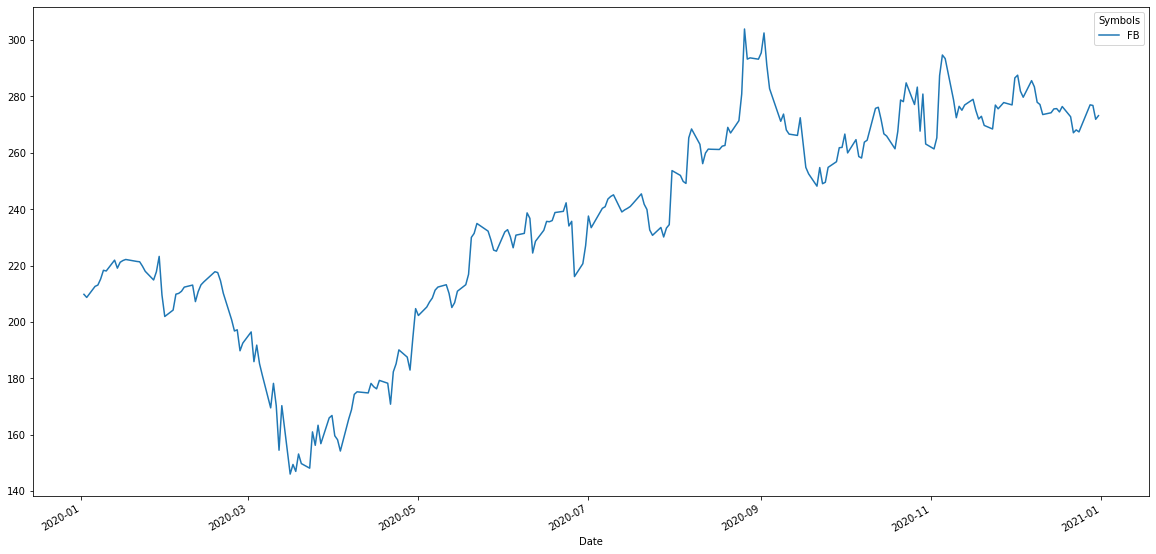
Graph of the closing price of a stock
#graph_close(stock, start_date, end_date)
graph_close(["FB"], "2020-01-01", "2021-01-01")
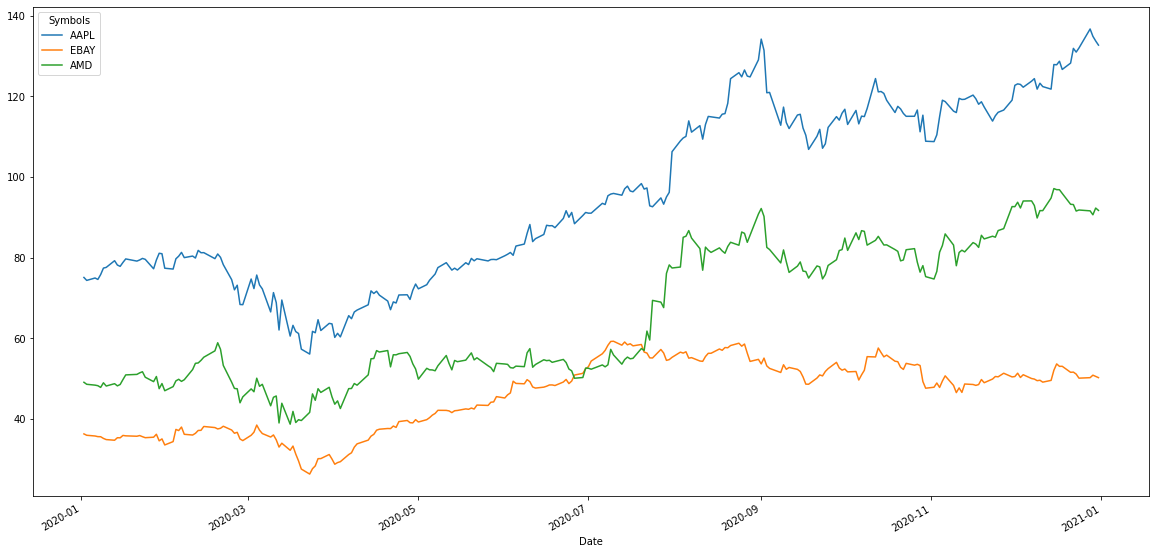
Graph of the closing price of multiple stocks
graph_close(["FB", "AAPL", "TSLA"], "2020-01-01", "2021-01-01")
Graph the volume
#graph_volume(stock, start_date, end_date)

#for one stock
graph_volume(["FB"], "2020-01-01", "2021-01-01")

#for multiple stocks
graph_volume(["FB", "AAPL", "TSLA"], "2020-01-01", "2021-01-01")
Graph the opening price
#graph_open(stock, start_date, end_date)

#for one stock
graph_open(["FB"], "2020-01-01", "2021-01-01")

#for multiple stocks
graph_open(["FB", "AAPL", "TSLA"], "2020-01-01", "2021-01-01")
Graph the adjusted closing price
#graph_adj_close(stock, start_date, end_date)

#for one stock
graph_adj_close(["FB"], "2020-01-01", "2021-01-01")

#for multiple stocks
graph_adj_close(["FB", "AAPL", "TSLA"], "2020-01-01", "2021-01-01")
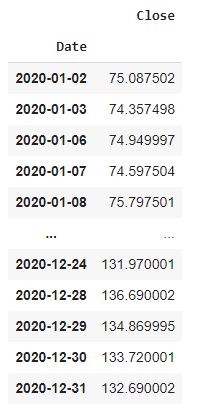
Get closing price data (in dataframe format)
#close(stock, start_date, end_date)
close(["AAPL"], "2020-01-01", "2021-01-01")
Get volume data (in dataframe format)
#volume(stock, start_date, end_date)
volume(["AAPL"], "2020-01-01", "2021-01-01")
Get opening price data (in dataframe format)
#open(stock, start_date, end_date)
open(["AAPL"], "2020-01-01", "2021-01-01")
Get adjusted closing price data (in dataframe format)
#adj_close(stock, start_date, end_date)
adj_close(["AAPL"], "2020-01-01", "2021-01-01")
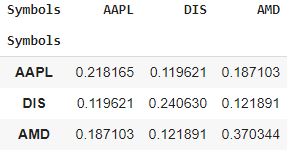
Covariance between stocks
#covariance(stocks, start_date, end_date, days) -> usually, days = 252
covariance(["AAPL", "DIS", "AMD"], "2020-01-01", "2021-01-01", 252)
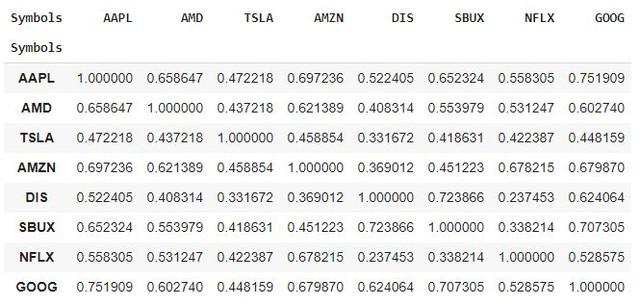
Correlation between stocks
#correlation(stocks, start_date, end_date)
correlation(["AAPL", "AMD", "TSLA", "AMZN", "DIS", "SBUX", "NFLX", "AMZN", "GOOG"], "2020-01-01", "2021-01-01")
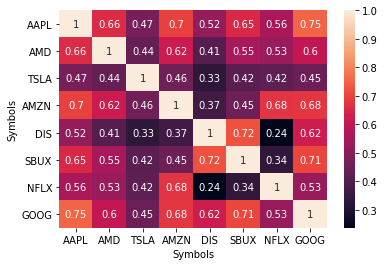
Graph correlation between stocks
#graph_correlation(stocks, start_date, end_date)
graph_correlation(["AAPL", "AMD", "TSLA", "AMZN", "DIS", "SBUX", "NFLX", "AMZN", "GOOG"], "2020-01-01", "2021-01-01")
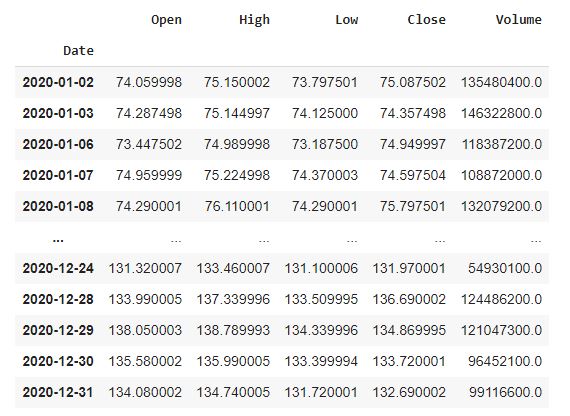
Get data from a stock in OHLCV format directly
#ohlcv(stock, start_date, end_date)
ohlcv("AAPL", "2020-01-01", "2021-01-01")
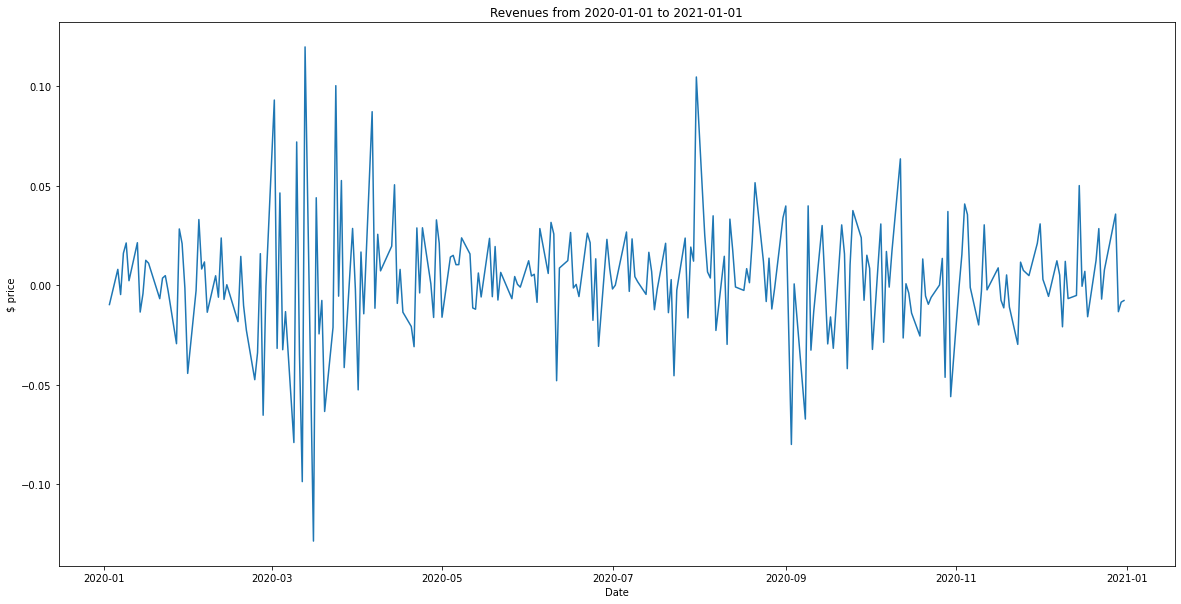
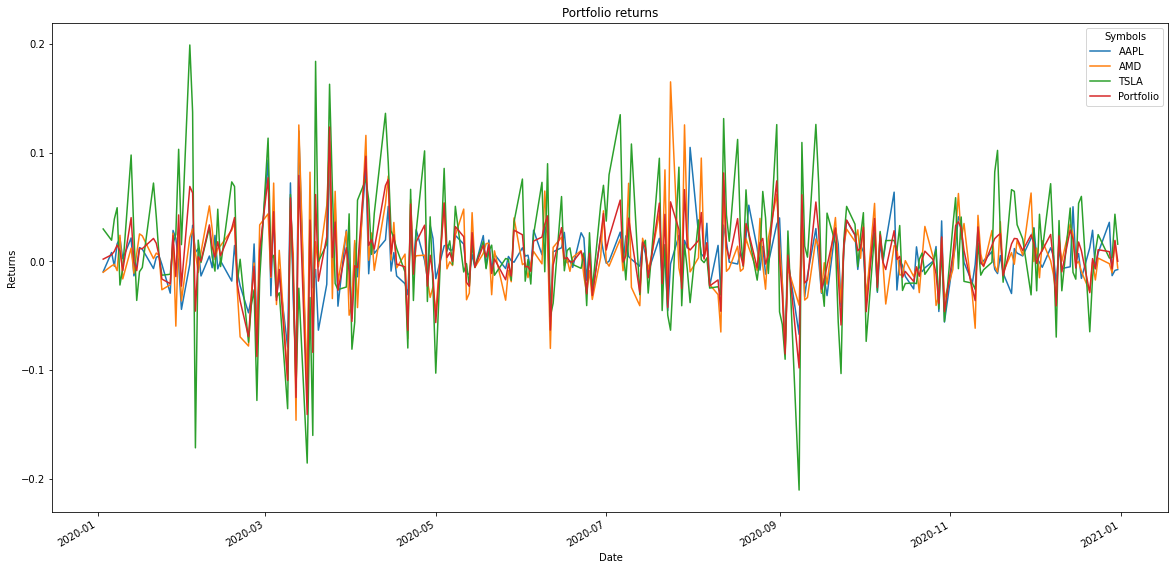
Graph the returns (for each day)
#graph_returns(stock,wts, start_date, end_date)

#for one stock
graph_returns(["AAPL"],1, "2020-01-01", "2021-01-01")
#for a portfolio
graph_returns(["AAPL", "AMD", "TSLA"], [0.25, 0.45, 0.3], "2020-01-01", "2021-01-01")
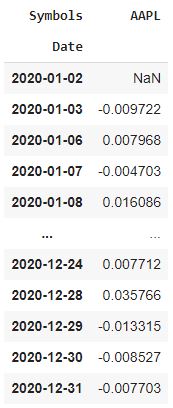
Get returns data of a stock/portfolio (in a dataframe format)
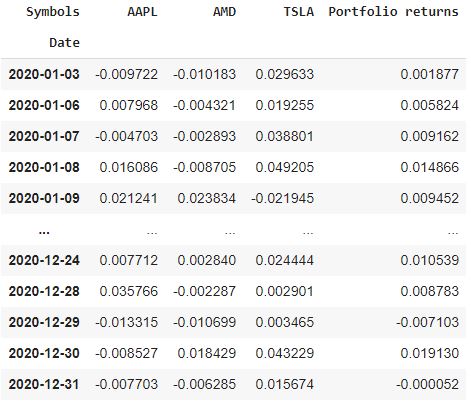
#returns(stocks,wts, start_date, end_date)
# sum of wts(weights) should always be equal to 1, it represents the allocation of shares in your portfolio (1 = 100%)

#for one stock
returns(["AAPL"],1, "2020-01-01", "2021-01-01")
#for a portfolio
returns(["AAPL", "AMD", "TSLA"], [0.25, 0.45, 0.3], "2020-01-01", "2021-01-01")
Graph the cumulative returns of a stock/portfolio
#graph_creturns(stock, wts, start_date, end_date)

#for one stock
graph_creturns(["TSLA"], 1, "2020-01-01", "2021-01-01")
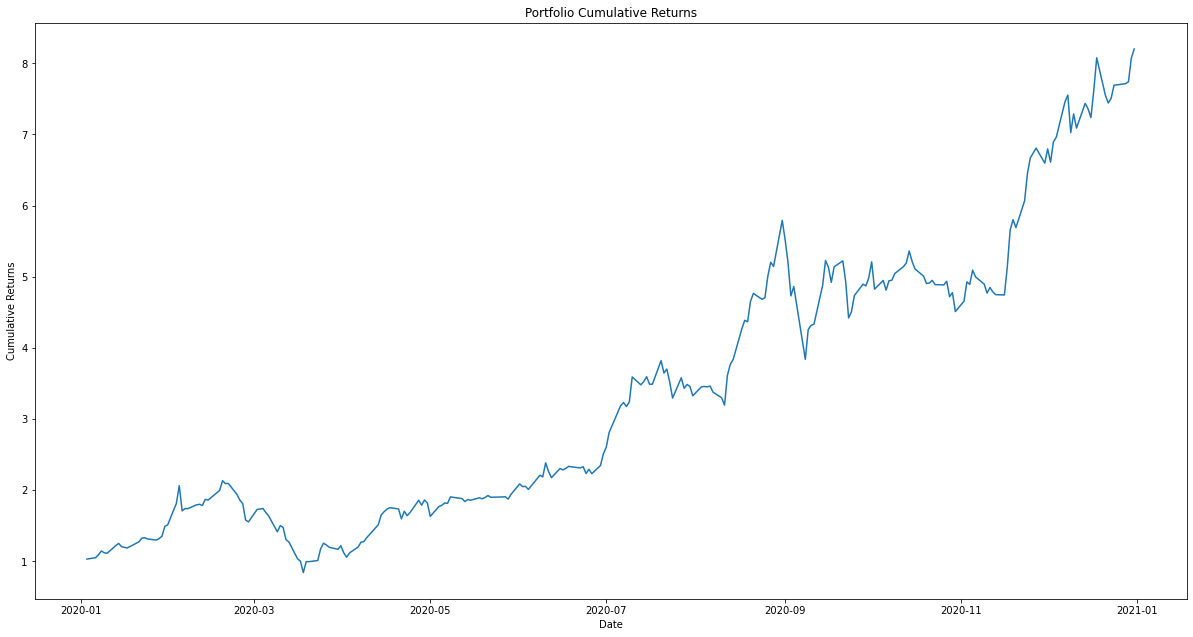
#for a portfolio
graph_creturns(["AAPL", "AMD", "TSLA"], [0.25, 0.45, 0.3], "2020-01-01", "2021-01-01")
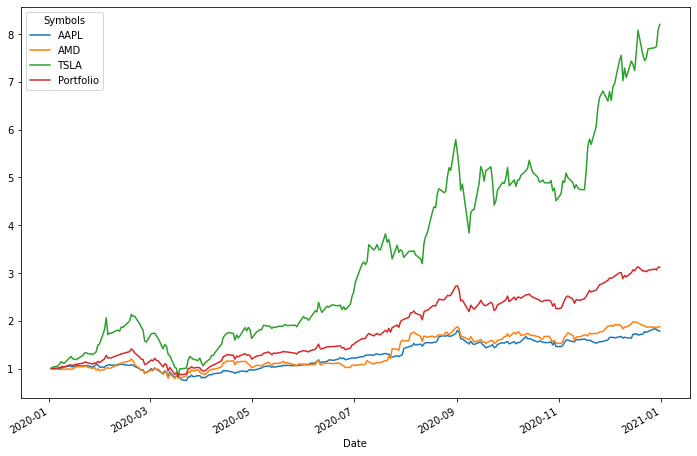
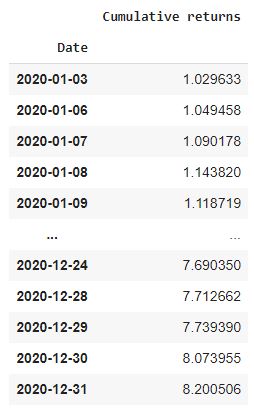
Get cumulative returns data of a stock/portfolio (in a dataframe format)
#creturns(stock, wts, start_date, end_date)

#for one stock
creturns(["TSLA"], 1, "2020-01-01", "2021-01-01")
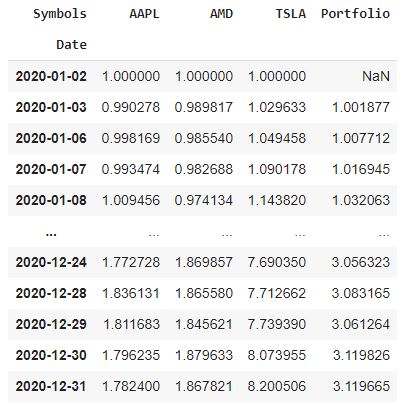
#for a portfolio
creturns(["AAPL", "AMD", "TSLA"], [0.25, 0.45, 0.3], "2020-01-01", "2021-01-01")
Annual Volatility of a portfolio/stock
#annual_volatility(stocks, wts, start_date, end_date)

#for one stock
annual_volatility(["TSLA"], 1, "2020-01-01", "2021-01-01")
#for multiple stocks
annual_volatility(["AAPL", "AMD", "TSLA"], [0.25, 0.45, 0.3], "2020-01-01", "2021-01-01")

Sharpe Ratio of a portfolio/stock
#sharpe_ratio(stocks, wts, start_date, end_date)

#for one stock
sharpe_ratio(["TSLA"], 1, "2020-01-01", "2021-01-01")
#for multiple stocks
sharpe_ratio(["AAPL", "AMD", "TSLA"], [0.25, 0.45, 0.3], "2020-01-01", "2021-01-01")

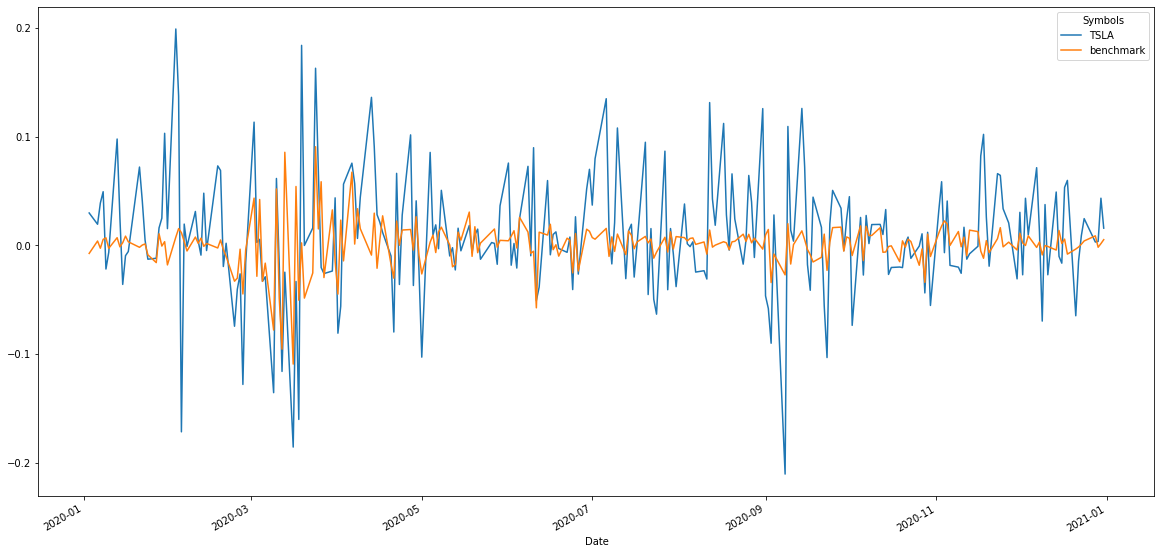
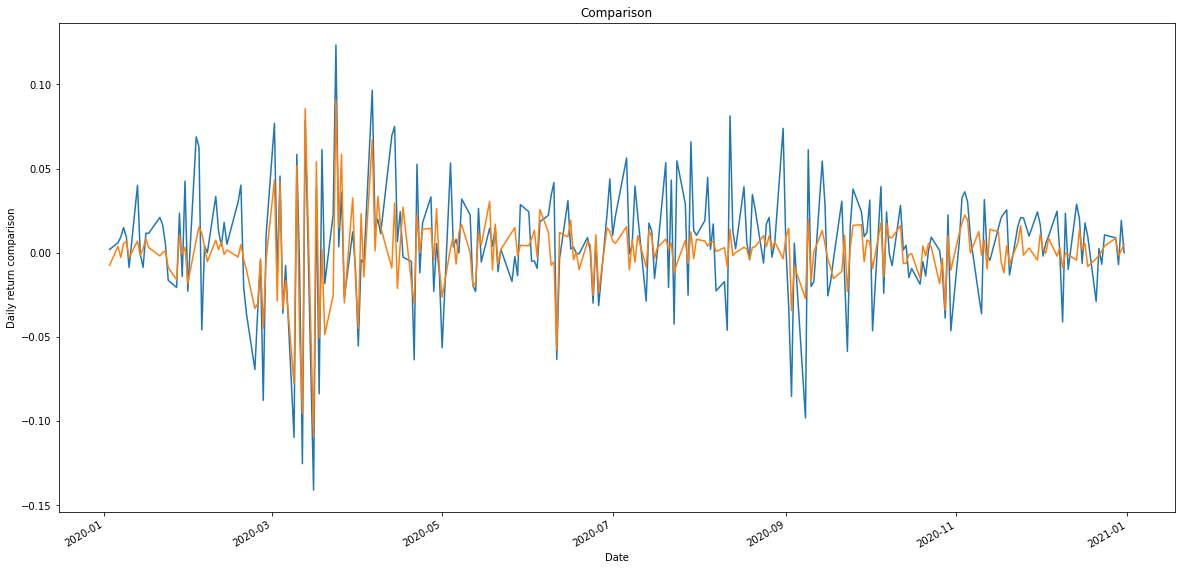
Graph the returns of a portfolio/stock to a benchmark
#graph_rbenchmark(stocks, wts, benchmark, start_date, end_date)
#for a stock
graph_rbenchmark(["TSLA"], 1, "SPY", "2020-01-01", "2021-01-01")
#for a portfolio
graph_rbenchmark(["AAPL", "AMD", "TSLA"], [0.25, 0.45, 0.3], "SPY",  "2020-01-01", "2021-01-01")
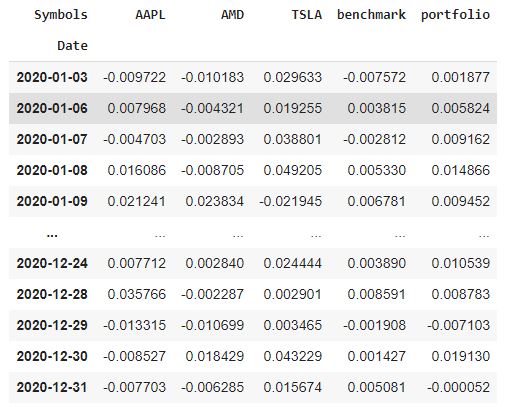
Get the data of the returns of a portfolio/stock to a benchmark
#rbenchmark(stocks, wts, benchmark, start_date, end_date)

#for one stock
rbenchmark(["TSLA"], 1, "SPY", "2020-01-01", "2021-01-01")
#for a portfolio
rbenchmark(["AAPL", "AMD", "TSLA"], [0.25, 0.45, 0.3], "SPY",  "2020-01-01", "2021-01-01")
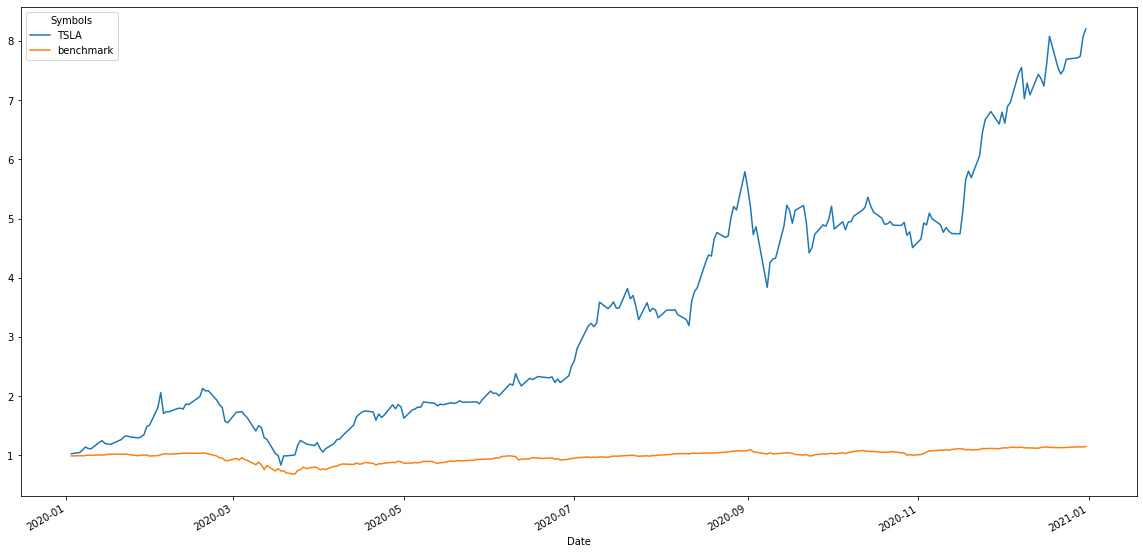
Graph the cumulative returns of a portfolio/stock to a benchmark
#graph_cbenchmark(stocks, wts, benchmark, start_date, end_date)

#for a stock
graph_cbenchmark(["TSLA"], 1, "SPY", "2020-01-01", "2021-01-01")
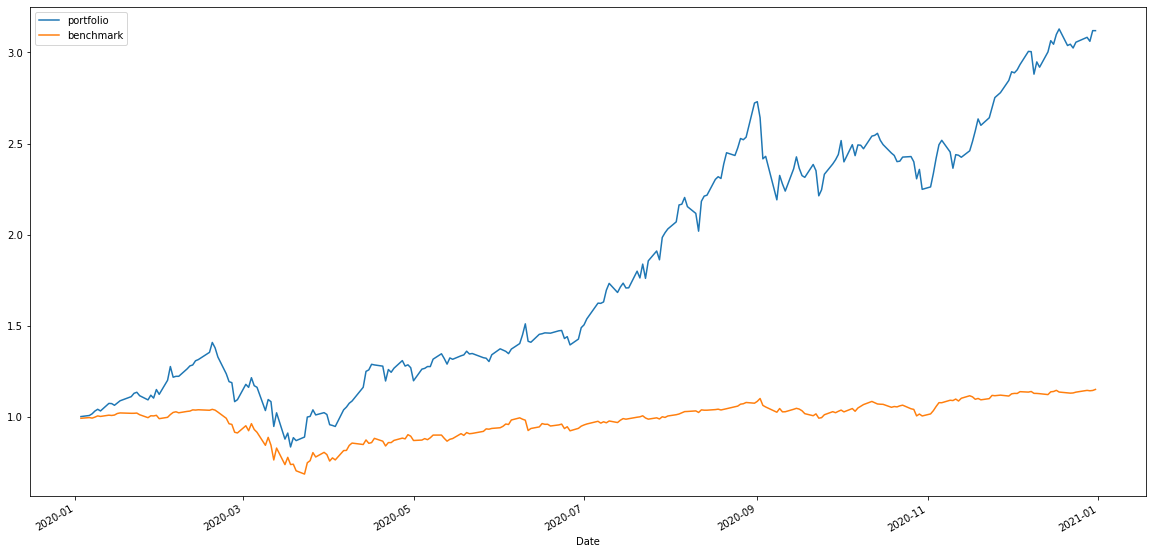
#for a portfolio
graph_cbenchmark(["AAPL", "AMD", "TSLA"], [0.25, 0.45, 0.3], "SPY",  "2020-01-01", "2021-01-01")
Get the data of the cumulative returns of a portfolio/stock to a benchmark
#cbenchmark(stocks, wts, benchmark, start_date, end_date)

#for a stock
cbenchmark(["TSLA"], 1, "SPY", "2020-01-01", "2021-01-01")
#for a portfolio
cbenchmark(["AAPL", "AMD", "TSLA"], [0.25, 0.45, 0.3], "SPY",  "2020-01-01", "2021-01-01")
Alpha of a portfolio/stock
#alpha(stocks, wts, benchmark, start_date, end_date)

#for a stock
alpha(["TSLA"], 1, "SPY", "2020-01-01", "2021-01-01")

#for a portfolio
alpha(["AAPL", "AMD", "TSLA"], [0.25, 0.45, 0.3], "SPY",  "2020-01-01", "2021-01-01")

Beta of a portfolio/stock
#beta(stocks, wts, benchmark, start_date, end_date)

#for one stock
beta(["TSLA"], 1, "SPY", "2020-01-01", "2021-01-01")
#for multiple stocks
beta(["AAPL", "AMD", "TSLA"], [0.25, 0.45, 0.3], "SPY",  "2020-01-01", "2021-01-01")

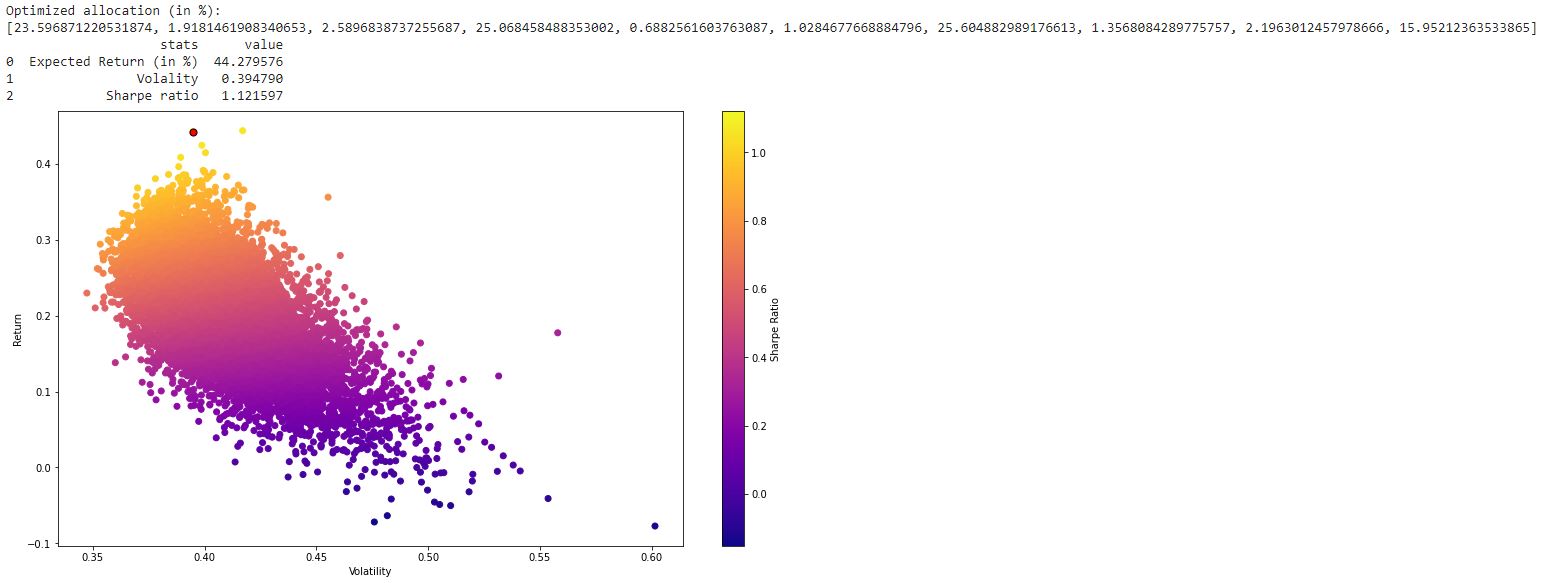
Efficient frontier to optimize allocation of shares in your portfolio
#efficient_frontier(stocks, start_date, end_date, iterations) -> iterations = 10000 is a good starting point
efficient_frontier(["AAPL", "FB", "MSFT", "AMD", "AIR", "AAL", "NFLX", "SBUX", "GOOG", "BABA"], "2020-01-01", "2021-01-01", 10000)
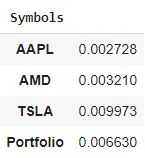
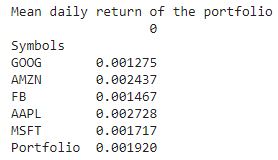
Get daily mean return of a stock/portfolio
#mean_daily_return(stocks,wts, start_date, end_date)

#for one stock
mean_daily_return(["AAPL"], 1, "2020-01-01", "2021-01-01")

#for multiple stocks
mean_daily_return(["AAPL", "AMD", "TSLA"], [0.25, 0.45, 0.3], "2020-01-01", "2021-01-01")
Value at risk of a stock/portfolio
#var(value_invested, stocks, wts, alpha, start_date, end_date)

#for one stock
var(10000, ['AAPL'], 1, 0.95, "2020-01-01", "2021-01-01")

#for multiple stocks
var(10000, ['AAPL', 'TSLA', 'AMD'], [0.4, 0.2, 0.4], 0.95, "2020-01-01", "2021-01-01")

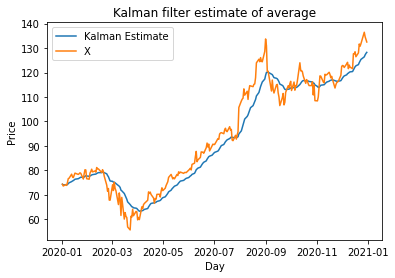
Graph closing price of stock smoothly with Kalman Filters
#graph_kalman(stocks, start_date, end_date, noise_value)
#noise_value = 0.01 is good to get started
graph_kalman("AAPL", "2020-01-01", "2021-01-01", 0.01)
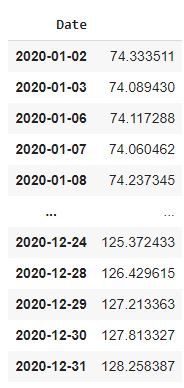
Get the smoothed closing price of a stock with Kalman Filters
#kalman(stocks, start_date, end_date, noise_value)
kalman("AAPL", "2020-01-01", "2021-01-01", 0.01)
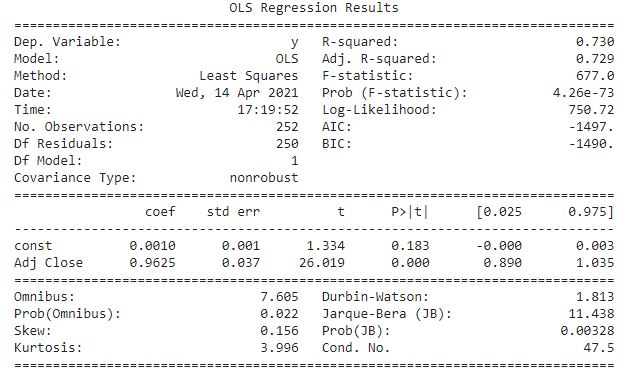
Get the Capital Asset Pricing Model
#capm(stocks, wts, start_date, end_date)
stocks = ["AAPL", "AMD", "TSLA", "MSFT"]
wts = [0.3, 0.2, 0.2, 0.3]
capm(stocks, wts, "2020-01-01", "2021-01-01")
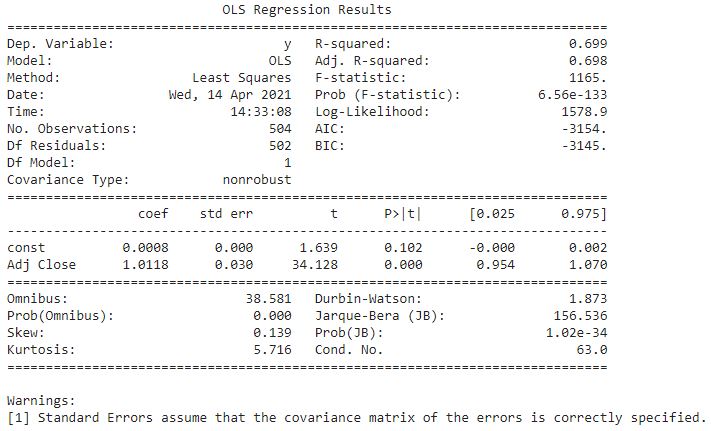
Cointegration
#cointegration(stock1, stock2, start_date, end_date)
cointegration("GOOG", "MSFT", "2012-01-01", "2021-01-01")
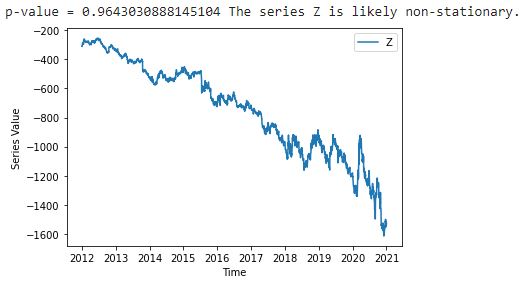
Returns Cointegration
#return_cointegration(stock1, stock2, start_date, end_date)
return_cointegration("GOOG", "MSFT", "2012-01-01", "2021-01-01")
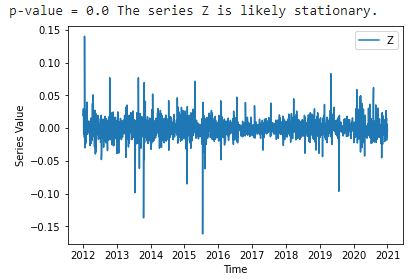
Stationarity
#stationarity(stock, start_date, end_date)
stationarity("GOOG", "2020-01-01", "2021-01-01")
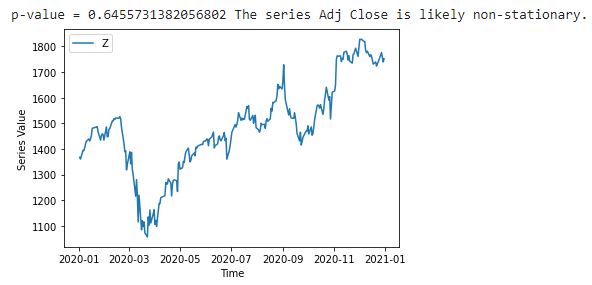
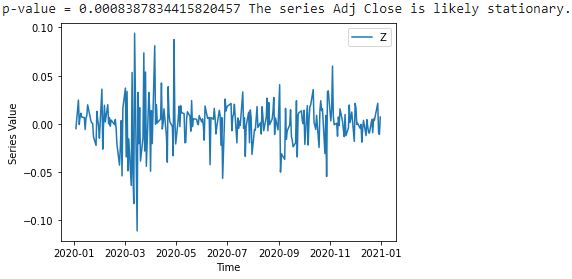
Returns Stationarity
#return_stationarity(stock, start_date, end_date)
return_stationarity("GOOG", "2020-01-01", "2021-01-01")
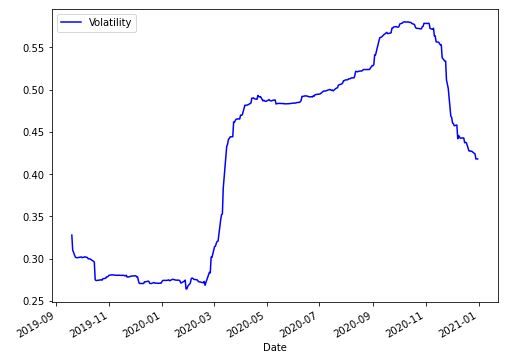
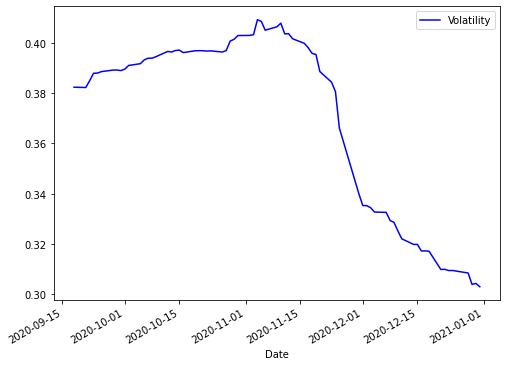
Graph rolling volatility
#graph_rvolatility(stock, wts, start_date, end_date, window_time)
#for a stock
graph_rvolatility(["TSLA"], 1, "2019-01-01", "2021-01-01", 180)

#for a portfolio
graph_rvolatility(["AAPL", "AMD", "TSLA"], [0.45, 0.45, 0.1], "2019-01-01", "2021-01-01", 180)
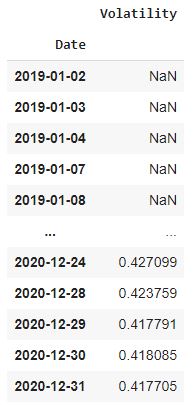
Get rolling volatility data
#rvolatility(stock, wts, start_date, end_date, window_time)
#for a stock
rvolatility(["TSLA"], 1, "2019-01-01", "2021-01-01", 180)

#for a portfolio
rvolatility(["AAPL", "AMD", "TSLA"], [0.45, 0.45, 0.1], "2019-01-01", "2021-01-01", 180)
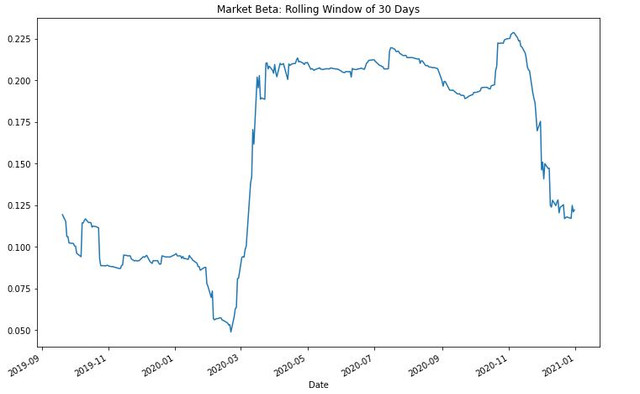
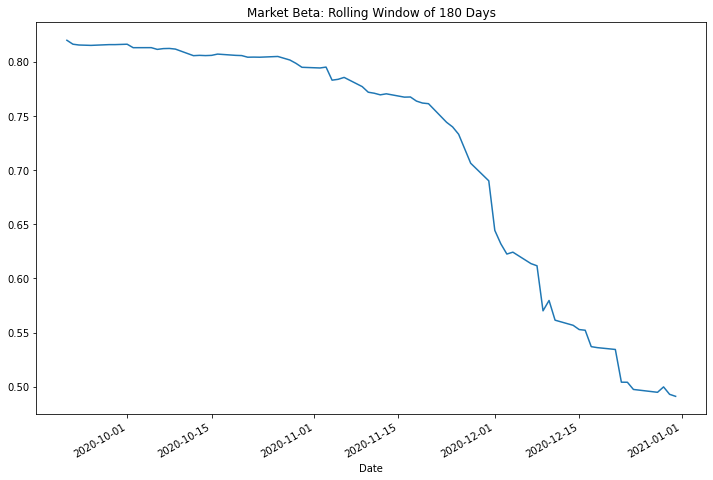
Graph rolling beta
#graph_rbeta(stock,wts, benchmark, start_date, end_date, window_time)

#for a stock
graph_rbeta(["TSLA"], 1, "SPY", "2019-01-01", "2021-01-01", 180)

#for a portfolio
graph_rbeta(["AAPL", "AMD", "GOOG"], [0.45, 0.45, 0.1], "SPY", "2019-01-01", "2021-01-01", 180)
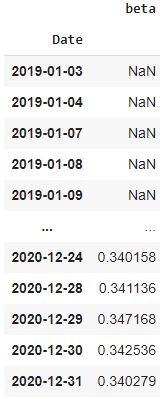
Get rolling beta data
#rbeta(stock,wts, benchmark, start_date, end_date, window_time)

#for a stock
rbeta(["TSLA"], 1, "SPY", "2019-01-01", "2021-01-01", 180)

#for a portfolio
rbeta(["AAPL", "AMD", "GOOG"], [0.45, 0.45, 0.1], "SPY", "2019-01-01", "2021-01-01", 180)
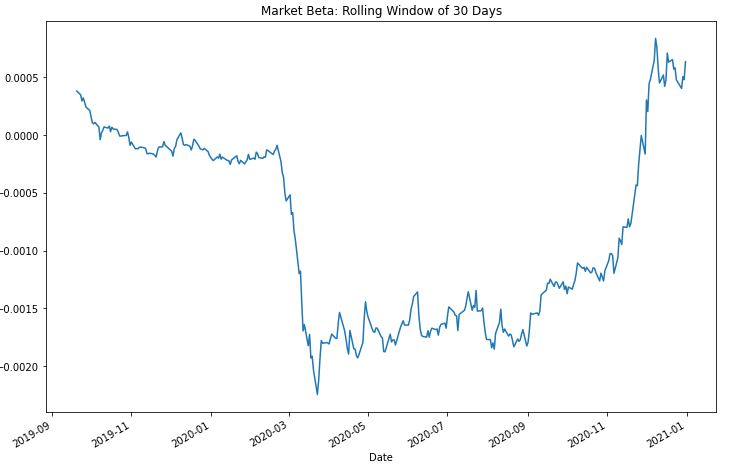
Graph rolling alpha
#graph_ralpha(stock,wts, benchmark, start_date, end_date, window_time)

#for a stock
graph_ralpha(["TSLA"], 1, "SPY", "2019-01-01", "2021-01-01", 180)

#for a portfolio
graph_ralpha(["AAPL", "AMD", "GOOG"], [0.45, 0.45, 0.1], "SPY", "2019-01-01", "2021-01-01", 180)
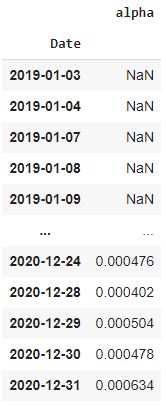
Get rolling alpha data
#ralpha(stock,wts, benchmark, start_date, end_date, window_time)

#for a stock
ralpha(["TSLA"], 1, "SPY", "2019-01-01", "2021-01-01", 180)

#for a portfolio
ralpha(["AAPL", "AMD", "GOOG"], [0.45, 0.45, 0.1], "SPY", "2019-01-01", "2021-01-01", 180)
Get implied volatility
#implied_vol(option_type, option_price, stock price, strike price, risk-free rate, the time to expiration, continuous dividend rate)
#option type : "c" (call option) or "p"(put option)

implied_vol('c', 0.3, 3, 3, 0.032, 30.0/365, 0.01)

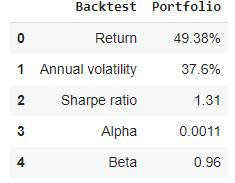
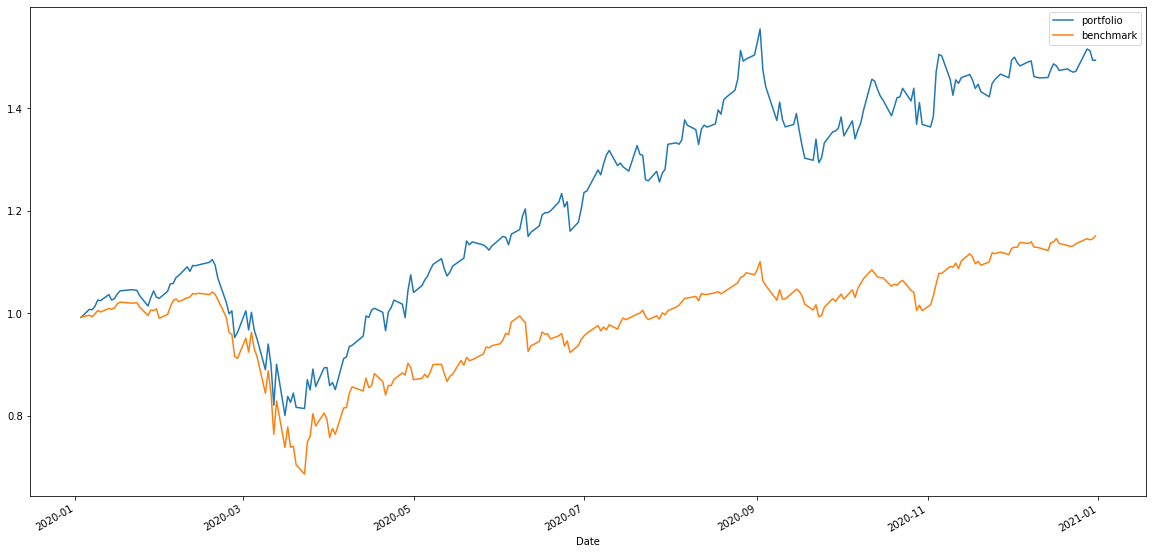
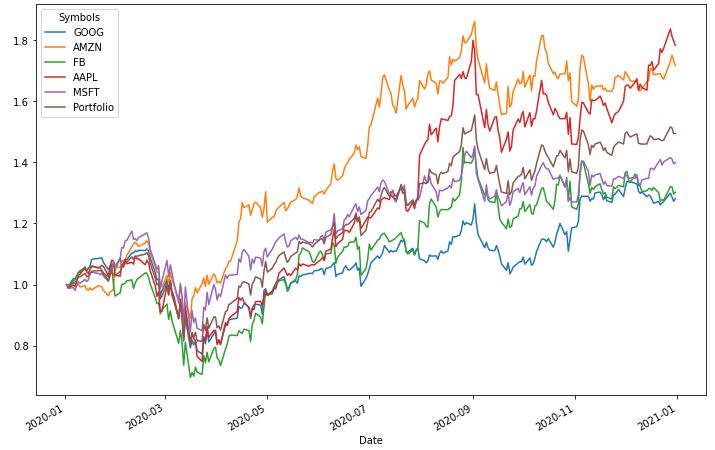
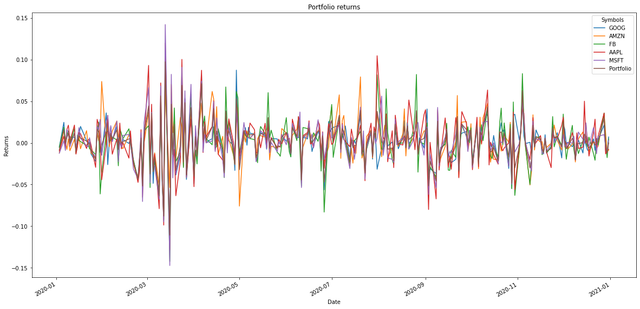
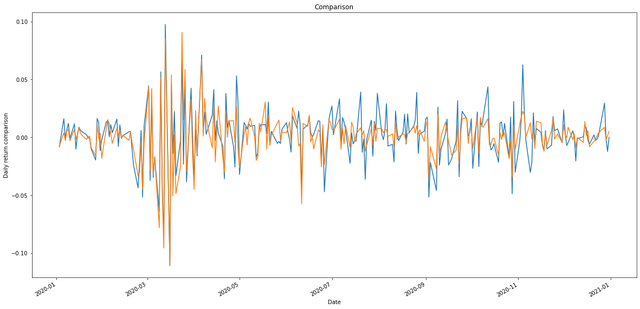
Backtest your portfolio
#backtest(stocks, wts, benchmark, start_date, end_date)
stocks = ["GOOG", "AMZN", "FB", "AAPL"]
wts = [0.25, 0.25, 0.25, 0.25]
backtest(stocks, wts, "SPY", "2019-01-01", "2021-01-01")
License
MIT
1 maintainer

Metadata
1 maintainer
Release files for trafalgar.py 0.1.7
For a detailed explanation of source distributions (sdists) and built distributions (wheels), please see the package formats documentation.
Source distribution (sdist)
| File | Size | Uploaded | |
|---|---|---|---|
| trafalgar.py-0.1.7.tar.gz | 14.9 kB | Details |
Built distribution (wheel)
| File | Interpreter | ABI | Platform | Reset |
|---|---|---|---|---|
| trafalgar.py-0.1.7-py3-none-any.whl | Python 3 | none | any | Details |
Total release size: 25.3 kB
Release files / trafalgar.py-0.1.7.tar.gz
| Download URL | trafalgar.py-0.1.7.tar.gz |
|---|---|
| Size | 14.9 kB |
| Tags | Source |
|
SHA-256 checksum How to use checksums |
0506b521406a7b2c0755bee92067831d53f7528f975177729d383858a4bf796e
|
|
BLAKE2b-256 checksum How to use checksums |
053cd626677e2a16edcde927c80d3692f184dce9f84a3ab61723bd98235d8457
|
| Upload date | |
|
Uploaded using Trusted Publishing? What is trusted publishing? |
No |
| Uploaded via |
twine/3.4.1 importlib_metadata/3.10.1 pkginfo/1.7.0 requests/2.25.1 requests-toolbelt/0.9.1 tqdm/4.56.0 CPython/3.9.0
|
Release files / trafalgar.py-0.1.7-py3-none-any.whl
| Download URL | trafalgar.py-0.1.7-py3-none-any.whl |
|---|---|
| Size | 10.4 kB |
| Tags | Python 3 |
|
SHA-256 checksum How to use checksums |
066f4c66c1e9de981113caf69caa48c54422eb339602ee474c575aac4e2b7d10
|
|
BLAKE2b-256 checksum How to use checksums |
34cfb867fe7bb79bed708ebf76abdfb39ee3ed722d0d9bf51d963eeb22a8ce3e
|
| Upload date | |
|
Uploaded using Trusted Publishing? What is trusted publishing? |
No |
| Uploaded via |
twine/3.4.1 importlib_metadata/3.10.1 pkginfo/1.7.0 requests/2.25.1 requests-toolbelt/0.9.1 tqdm/4.56.0 CPython/3.9.0
|














