
unhcrpyplotstyle

The unhcrpyplotstyle package provides Matplotlib styles following UNHCR Data Visualization Guidelines which ensures charts are professional and brand–compliant. The porpose of this package is to ease and speed up the chart creation process using Matplotlib custom stylesheets.
Getting started
The easiest way to install unhcrpyplostyle package is by using pip:
# to install the lastest PyPI release
pip install unhcrpyplotstyle

# to install the latest Github commit
pip install git+https://github.com/leichen88/unhcrpyplotstyle
The pip installation will automatically download and store all Matplotlib custom style files (*.mplstyle) in the appropriate local directory of your computer.
Use the styles
unhcrpyplotstyle is the base style of this package. It provides basic styles to the chart elements such as color, font, fontsize, and position. To use the base style you can simply call it from your local style directory after importing matplotlib library.
import matplotlib.pyplot as plt
plt.style.use('unhcrpyplotstyle')
Once the base style is applied then you can add a specific style related to the type of chart that you want to use by simply combining two styles together:
import matplotlib.pyplot as plt
plt.style.use('unhcrpyplotstyle','column')
In this case, thecolumnstyle will add some of the parameters to the base style unhcrpyplostyle in order to align all chart element styles with a standard UNHCR style column chart.
See the full list of styles based on chart types below:
areabarbubblecolumnconnected_scatterplotdonutdotplotheatmaphistogramlinelinecolumnlollipopmappiepopulation_pyramidscatterplotslopestreamgraphtreemap
Example
The chart with unhcrpyplotstyle + column styles:
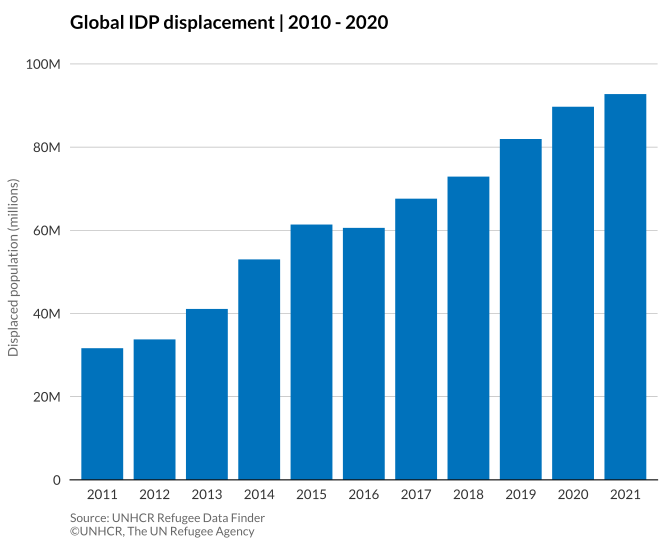
Find code example for column chart here.
The chart with unhcrpyplotstyle + bar styles:
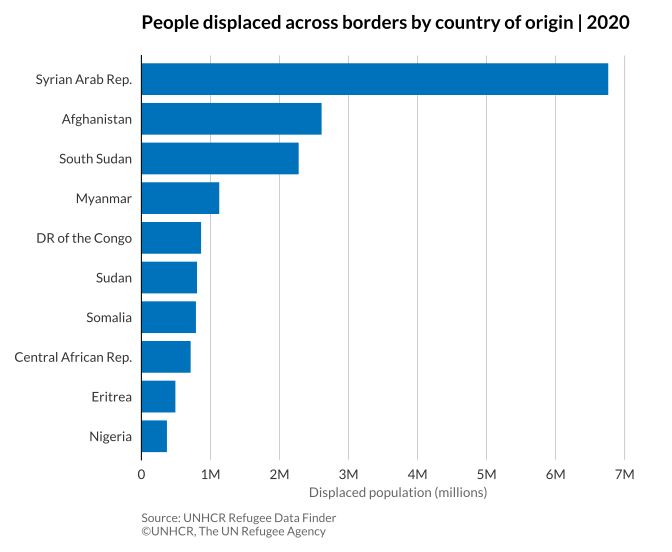
Find code example for bar chart here.
The chart with unhcrpyplotstyle + line styles:
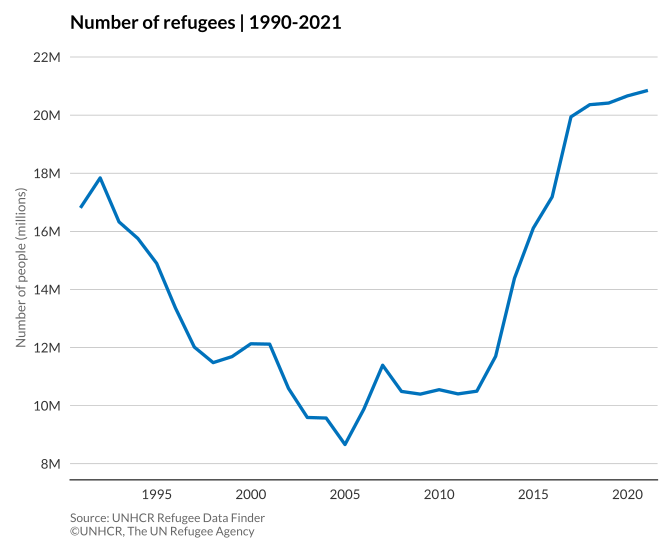
Find code example for line chart here.
The chart with unhcrpyplotstyle + scatterplot styles:
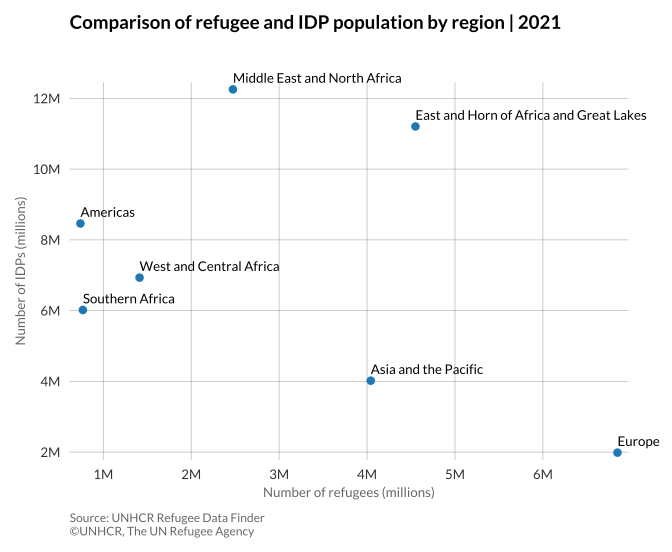
Find code example for scatterplot here.
1 maintainer

Metadata
1 maintainer
Release files for unhcrpyplotstyle 0.1.3
For a detailed explanation of source distributions (sdists) and built distributions (wheels), please see the package formats documentation.
Source distribution (sdist)
| File | Size | Uploaded | |
|---|---|---|---|
| unhcrpyplotstyle-0.1.3.tar.gz | 7.6 kB | Details |
Release files / unhcrpyplotstyle-0.1.3.tar.gz
| Download URL | unhcrpyplotstyle-0.1.3.tar.gz |
|---|---|
| Size | 7.6 kB |
| Tags | Source |
|
SHA-256 checksum How to use checksums |
23e3e2e87bccbe59e78f29ce5e06206cc0a71b84fcfecd4c484c2f894b59471e
|
|
BLAKE2b-256 checksum How to use checksums |
91d46a68f4fec417ffc3842a0ae6f411d33fc8f99caa4e37ed05a7ec9336f86e
|
| Upload date | |
|
Uploaded using Trusted Publishing? What is trusted publishing? |
No |
| Uploaded via |
twine/4.0.1 CPython/3.10.5
|














