
US Marine Energy Resource
- Overview
- Installation
- Tidal Quick Start
- Dataset Variables
- Multi-Site Comparison
- Wave Hindcast
- Command Line Interface
- Direct Downloads using the
tidal_hindcastAPI
Overview
us-marine-energy-resource is a Python library for accessing the U.S.
DOE H2O High Resolution Tidal
Hindcast
dataset, a high-resolution, 3D tidal current hindcast for five US
coastal regions, generated with the Finite Volume Community Ocean Model
(FVCOM).
[!IMPORTANT]
This library is in early development and the API is subject to change. The core functionality of downloading and visualizing tidal hindcast data at specific points is stable, but additional features and datasets are still being added. Please reach out if you have questions or would like to contribute!
[!NOTE]
This library also provides point access to the U.S. DOE WPTO High-Resolution Wave Hindcast dataset through the
mer wavecommand and theus_marine_energy_resource.wave_hindcastmodule. See Wave Hindcast below. The marine and hydrokinetic toolkit (MHKiT) offers another route through itswave.io.hindcastmodule, shown in this wave hindcast example.
Installation
uv (faster resolver, recommended):
uv add us-marine-energy-resource
pip (may be slow — pip’s dependency resolver backtracks extensively on this package’s transitive dependencies):
pip install us-marine-energy-resource
Tidal Quick Start
us_marine_energy_resource.tidal_hindcast.get_data_at_point takes a
latitude and longitude and fetches a full year of tidal current data at
the nearest grid point within the five hindcast regions listed below.
The plotting functions then visualize current speed across all 10 depth
layers over the entire hindcast year.
The dataset covers a full year at each region at hourly or half-hourly resolution across 10 terrain-following sigma layers from the sea surface to the seafloor.
| Region | Period | Timestep | Grid Points |
|---|---|---|---|
| Cook Inlet, Alaska | 2005 | hourly | 392,002 |
| Aleutian Islands, Alaska | 2010–2011 | hourly | 797,978 |
| Puget Sound, Washington | 2015 | half-hourly | 1,734,765 |
| Piscataqua River, New Hampshire | 2007 | half-hourly | 292,927 |
| Western Passage, Maine | 2017 | half-hourly | 231,208 |
Full dataset documentation, variable definitions, methodology, and validation are at us-marine-energy-resource.github.io/tidal/high_resolution_hindcast/.
import matplotlib.pyplot as plt
import pandas as pd

from us_marine_energy_resource import tidal_hindcast as tidal
from us_marine_energy_resource.tidal_hindcast import DepthMode, PlotSettings

# Cook Inlet near Nikiski AK,
lat=60.735016
lon=-151.431396
location_name = "Cook Inlet, Near Nikiski, AK"

df = tidal.get_data_at_point(lat=lat, lon=lon)
us_marine_energy_resource has functions to plot the point data at the
10 uniform depths over time. The underlying data contains speed [m/s]
and direction [deg cw from True North] calculated from the underlying
model u and v variables at each sigma layer at each time step. To
convert this to a plot this library uses the calculated sigma depth and
uniform model specification to “extract” volume data, and convert the
data from a compacted format to a format usable for engineering
analysis.
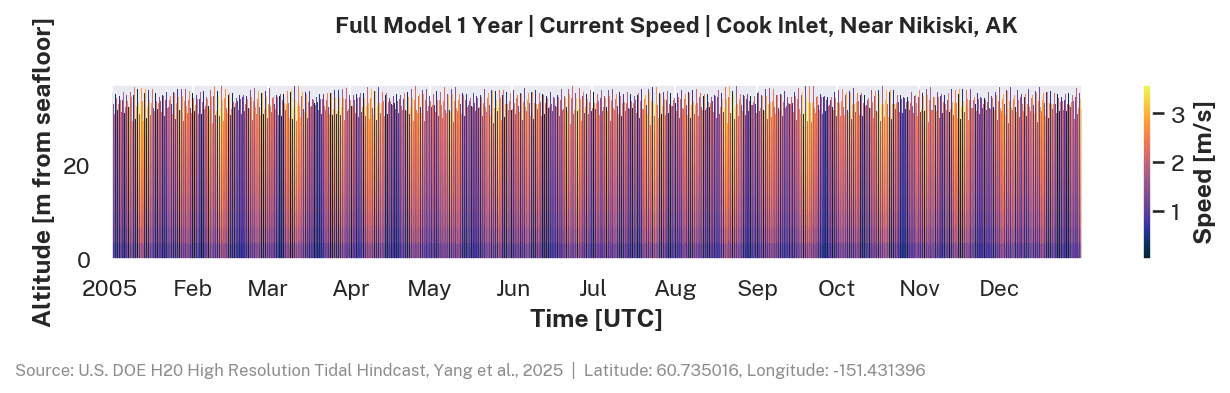
The following visualization uses plot_sigma_layers_speed function with
the downloaded and extracted pandas DataFrame, df and a PlotSettings
object (custom class for this library to control plot styling) and
outputs a visualization of speed at each volume over time.
Each horizontal band is one of 10 sigma layers model results, expanded to color an entire volume, spanning the full water column from the sea surface (top) to the seabed (bottom). Color encodes current speed in m/s. The tidal cycle and spring–neap modulation are immediately visible across the full hindcast year.
settings=PlotSettings(
    title=f"Full Model 1 Year | Current Speed | {location_name}",
    fig_width=9,
    fig_height=2.5,
    caption=f"Latitude: {lat}, Longitude: {lon}",
    save_path=img("quickstart-sigma-speed-year.png"),
)

tidal.plot_sigma_layers_speed(df, settings=settings)
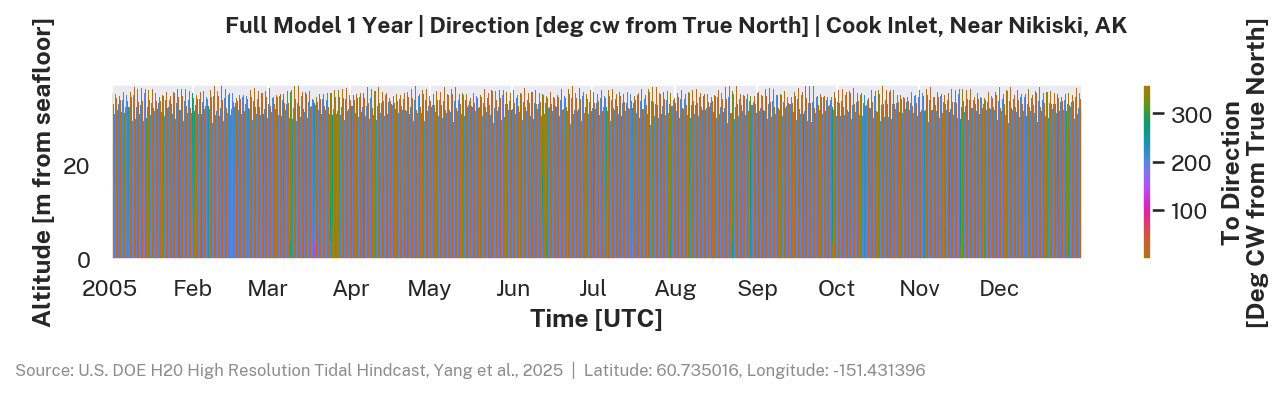
Additionally we can plot direction [deg clockwise from true north] at all depths over time.
settings.title = settings.title.replace("Current Speed", "Direction [deg cw from True North]")
settings.save_path = img("quickstart-sigma-direction-year.png")

tidal.plot_sigma_layers_direction(df, settings=settings)
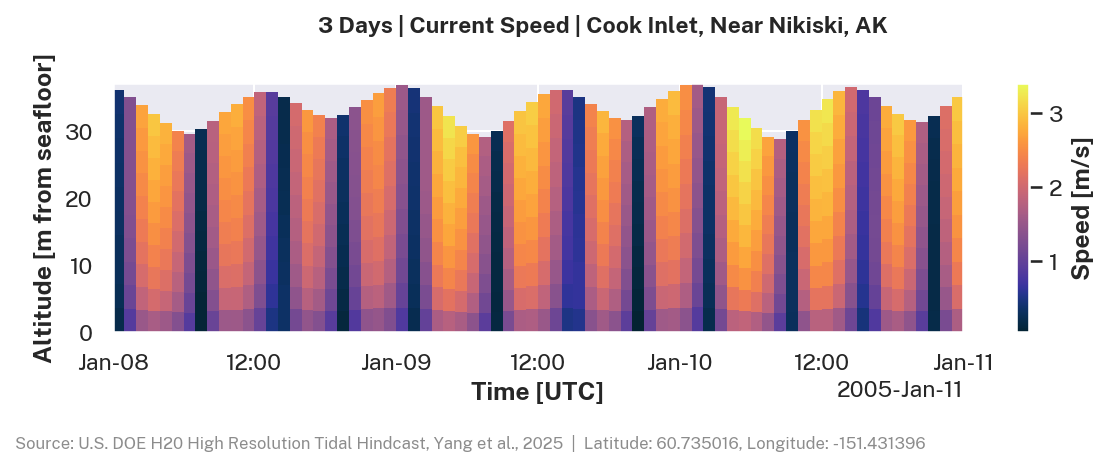
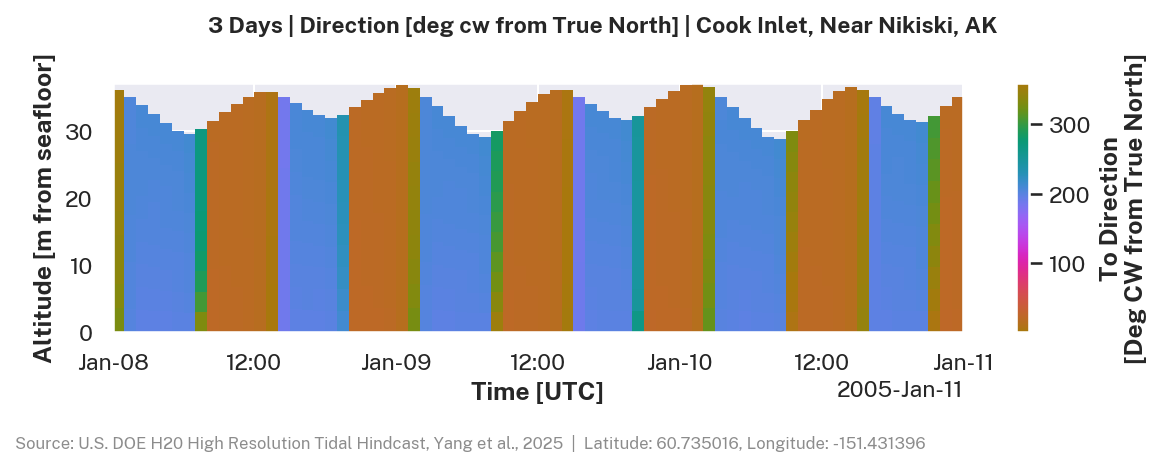
It is also possible to zoom into specific start dates within the model run. The simplest way to do this is to create time objects from the data and use variables to control the offset from the start of the dataset and the number of days visible.
n_days = 3
start_day_offset = 7
start_date=str((df.index[0] + pd.Timedelta(days=start_day_offset)).date())
end_date=str((df.index[0] + pd.Timedelta(days=start_day_offset + n_days)).date())

settings = PlotSettings(
    title=f"{n_days} Days | Current Speed | {location_name}",
    start_date=start_date,
    end_date=end_date,
    fig_width=8,
    fig_height=3,
    caption=f"Latitude: {lat}, Longitude: {lon}",
    save_path=img("quickstart-sigma-speed-3day.png"),
)

tidal.plot_sigma_layers_speed(df, settings=settings)
settings.title = settings.title.replace("Current Speed", "Direction [deg cw from True North]")
settings.save_path = img("quickstart-sigma-direction-3day.png")

tidal.plot_sigma_layers_direction(df, settings=settings)
Depth perspective
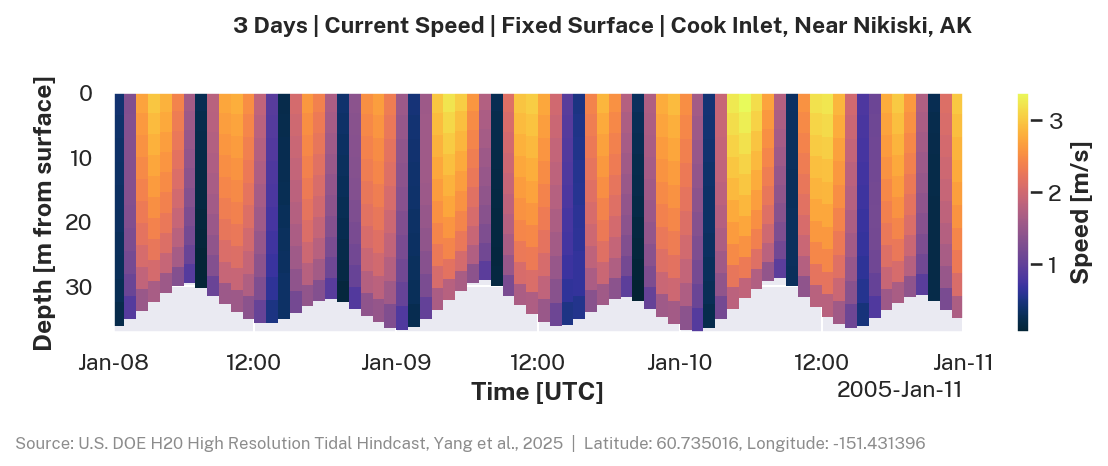
All visualizations that show depth or elevation on an axis respect a configurable depth perspective. Four reference frames are available:
| Mode | Reference | Axis direction |
|---|---|---|
DepthMode.FixedBottom |
Instantaneous seafloor | Height increases upward from 0 |
DepthMode.FixedSurface |
Instantaneous sea surface | Depth increases downward from 0 |
DepthMode.Navd88Depth |
NAVD88 datum | Depth increases downward |
DepthMode.Navd88Elevation |
NAVD88 datum | Elevation increases upward |
Pass a DepthMode via PlotSettings to control the perspective for a
single call. The example below uses FixedSurface, the classic
oceanographic convention with the sea surface at zero and depth
increasing downward:
tidal.plot_sigma_layers_speed(
    df,
    settings=PlotSettings(
        title=f"3 Days | Current Speed | Fixed Surface | {location_name}",
        start_date=start_date,
        end_date=end_date,
        fig_width=8,
        fig_height=3,
        caption=f"Latitude: {lat}, Longitude: {lon}",
        depth_perspective=DepthMode.FixedSurface,
        save_path=img("quickstart-sigma-speed-3day-surface.png"),
    ),
)
The default and recommended perspective for tidal energy work is
FixedBottom: height above the seafloor, with the seafloor anchored at
zero and the water column growing upward as the tide floods. Setting it
once at the start of a session applies it to all subsequent plots
automatically:
tidal.set_depth_perspective(DepthMode.FixedBottom)
All visualizations below use FixedBottom.
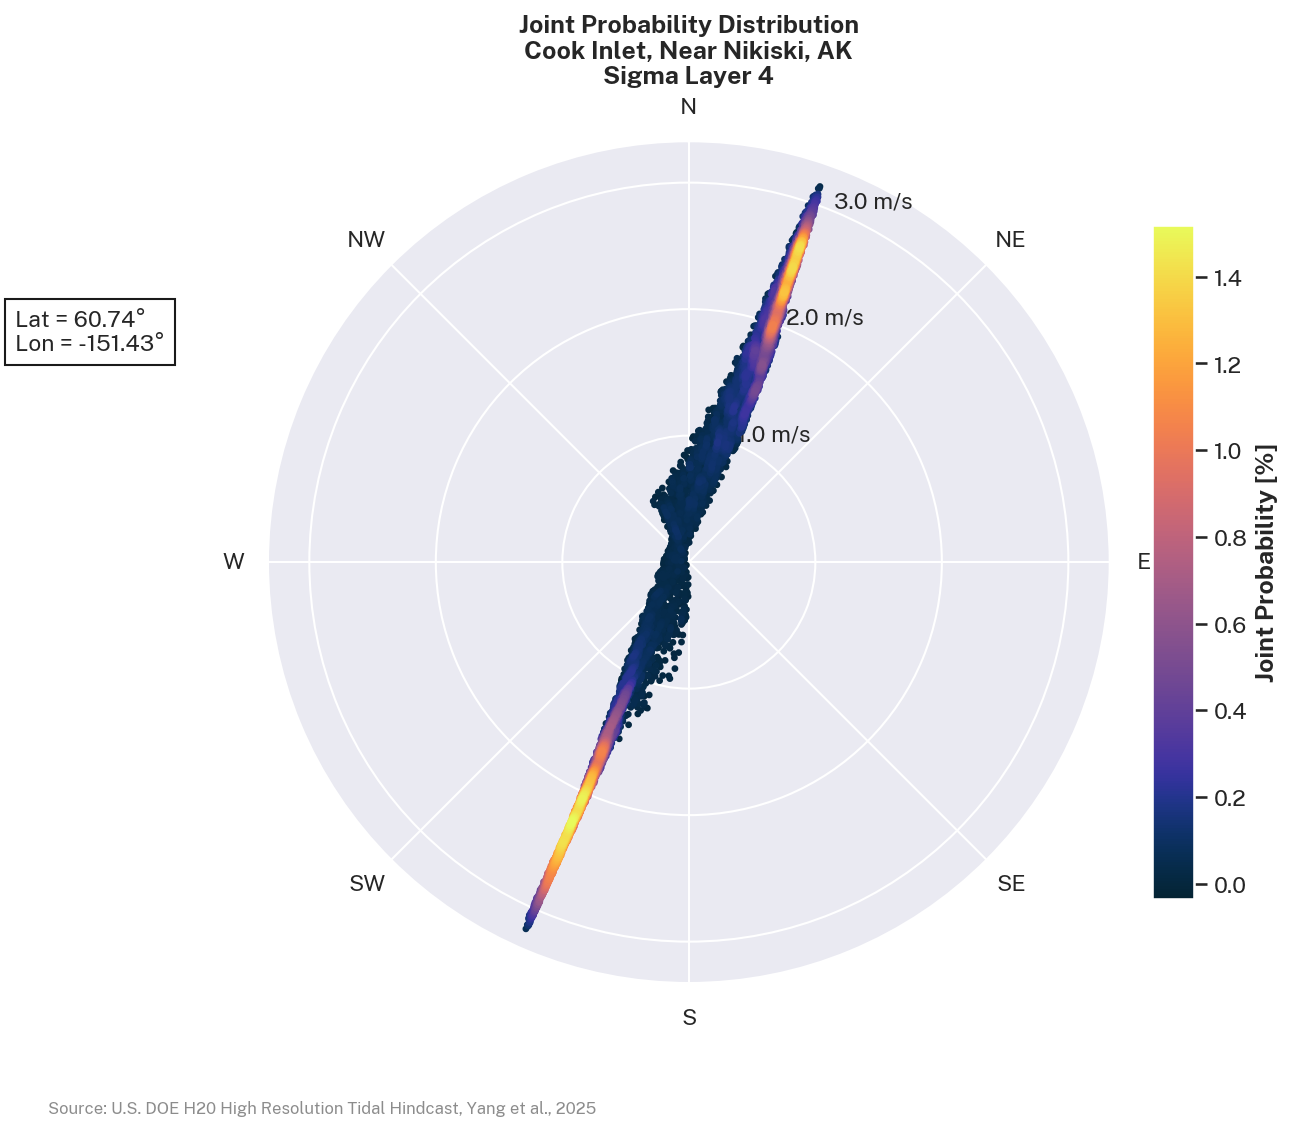
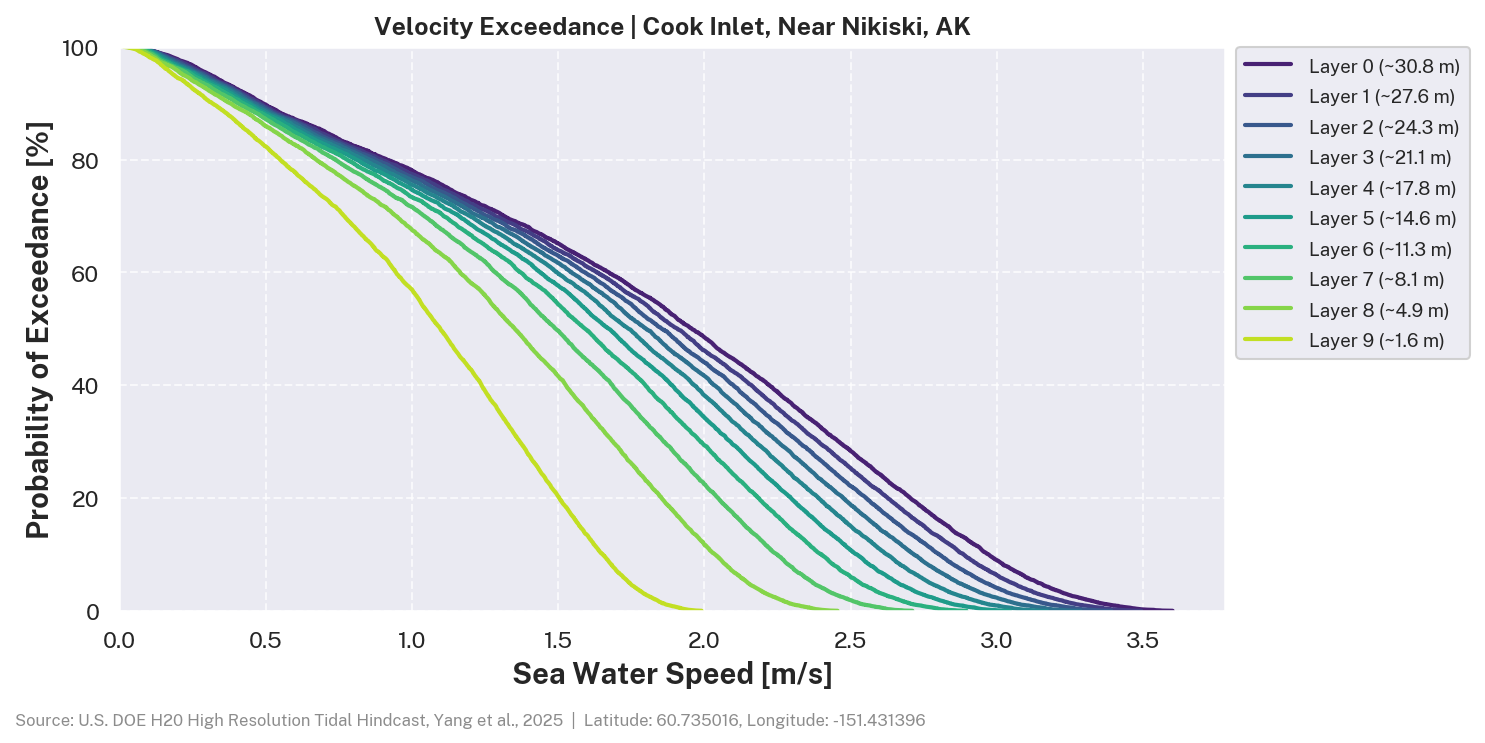
The same df can be used to visualize tidal joint probability
distributions (single sigma layer) and velocity exceedance curves
(multiple sigma layers):
tidal.generate_tidal_joint_probability(
    df,
    sigma_layer=4,
    settings=PlotSettings(
        title=f"Joint Probability Distribution\n{location_name}\nSigma Layer 4",
        fig_width=8,
        fig_height=8,
        save_path=img("quickstart-jpd-layer-4.png"),
    ),
)
_, stats = tidal.plot_velocity_exceedance(
    df,
    settings=PlotSettings(
        title=f"Velocity Exceedance | {location_name}",
        fig_width=10,
        fig_height=5,
        caption=f"Latitude: {lat}, Longitude: {lon}",
        save_path=img("quickstart-velocity-exceedance.png"),
    ),
)
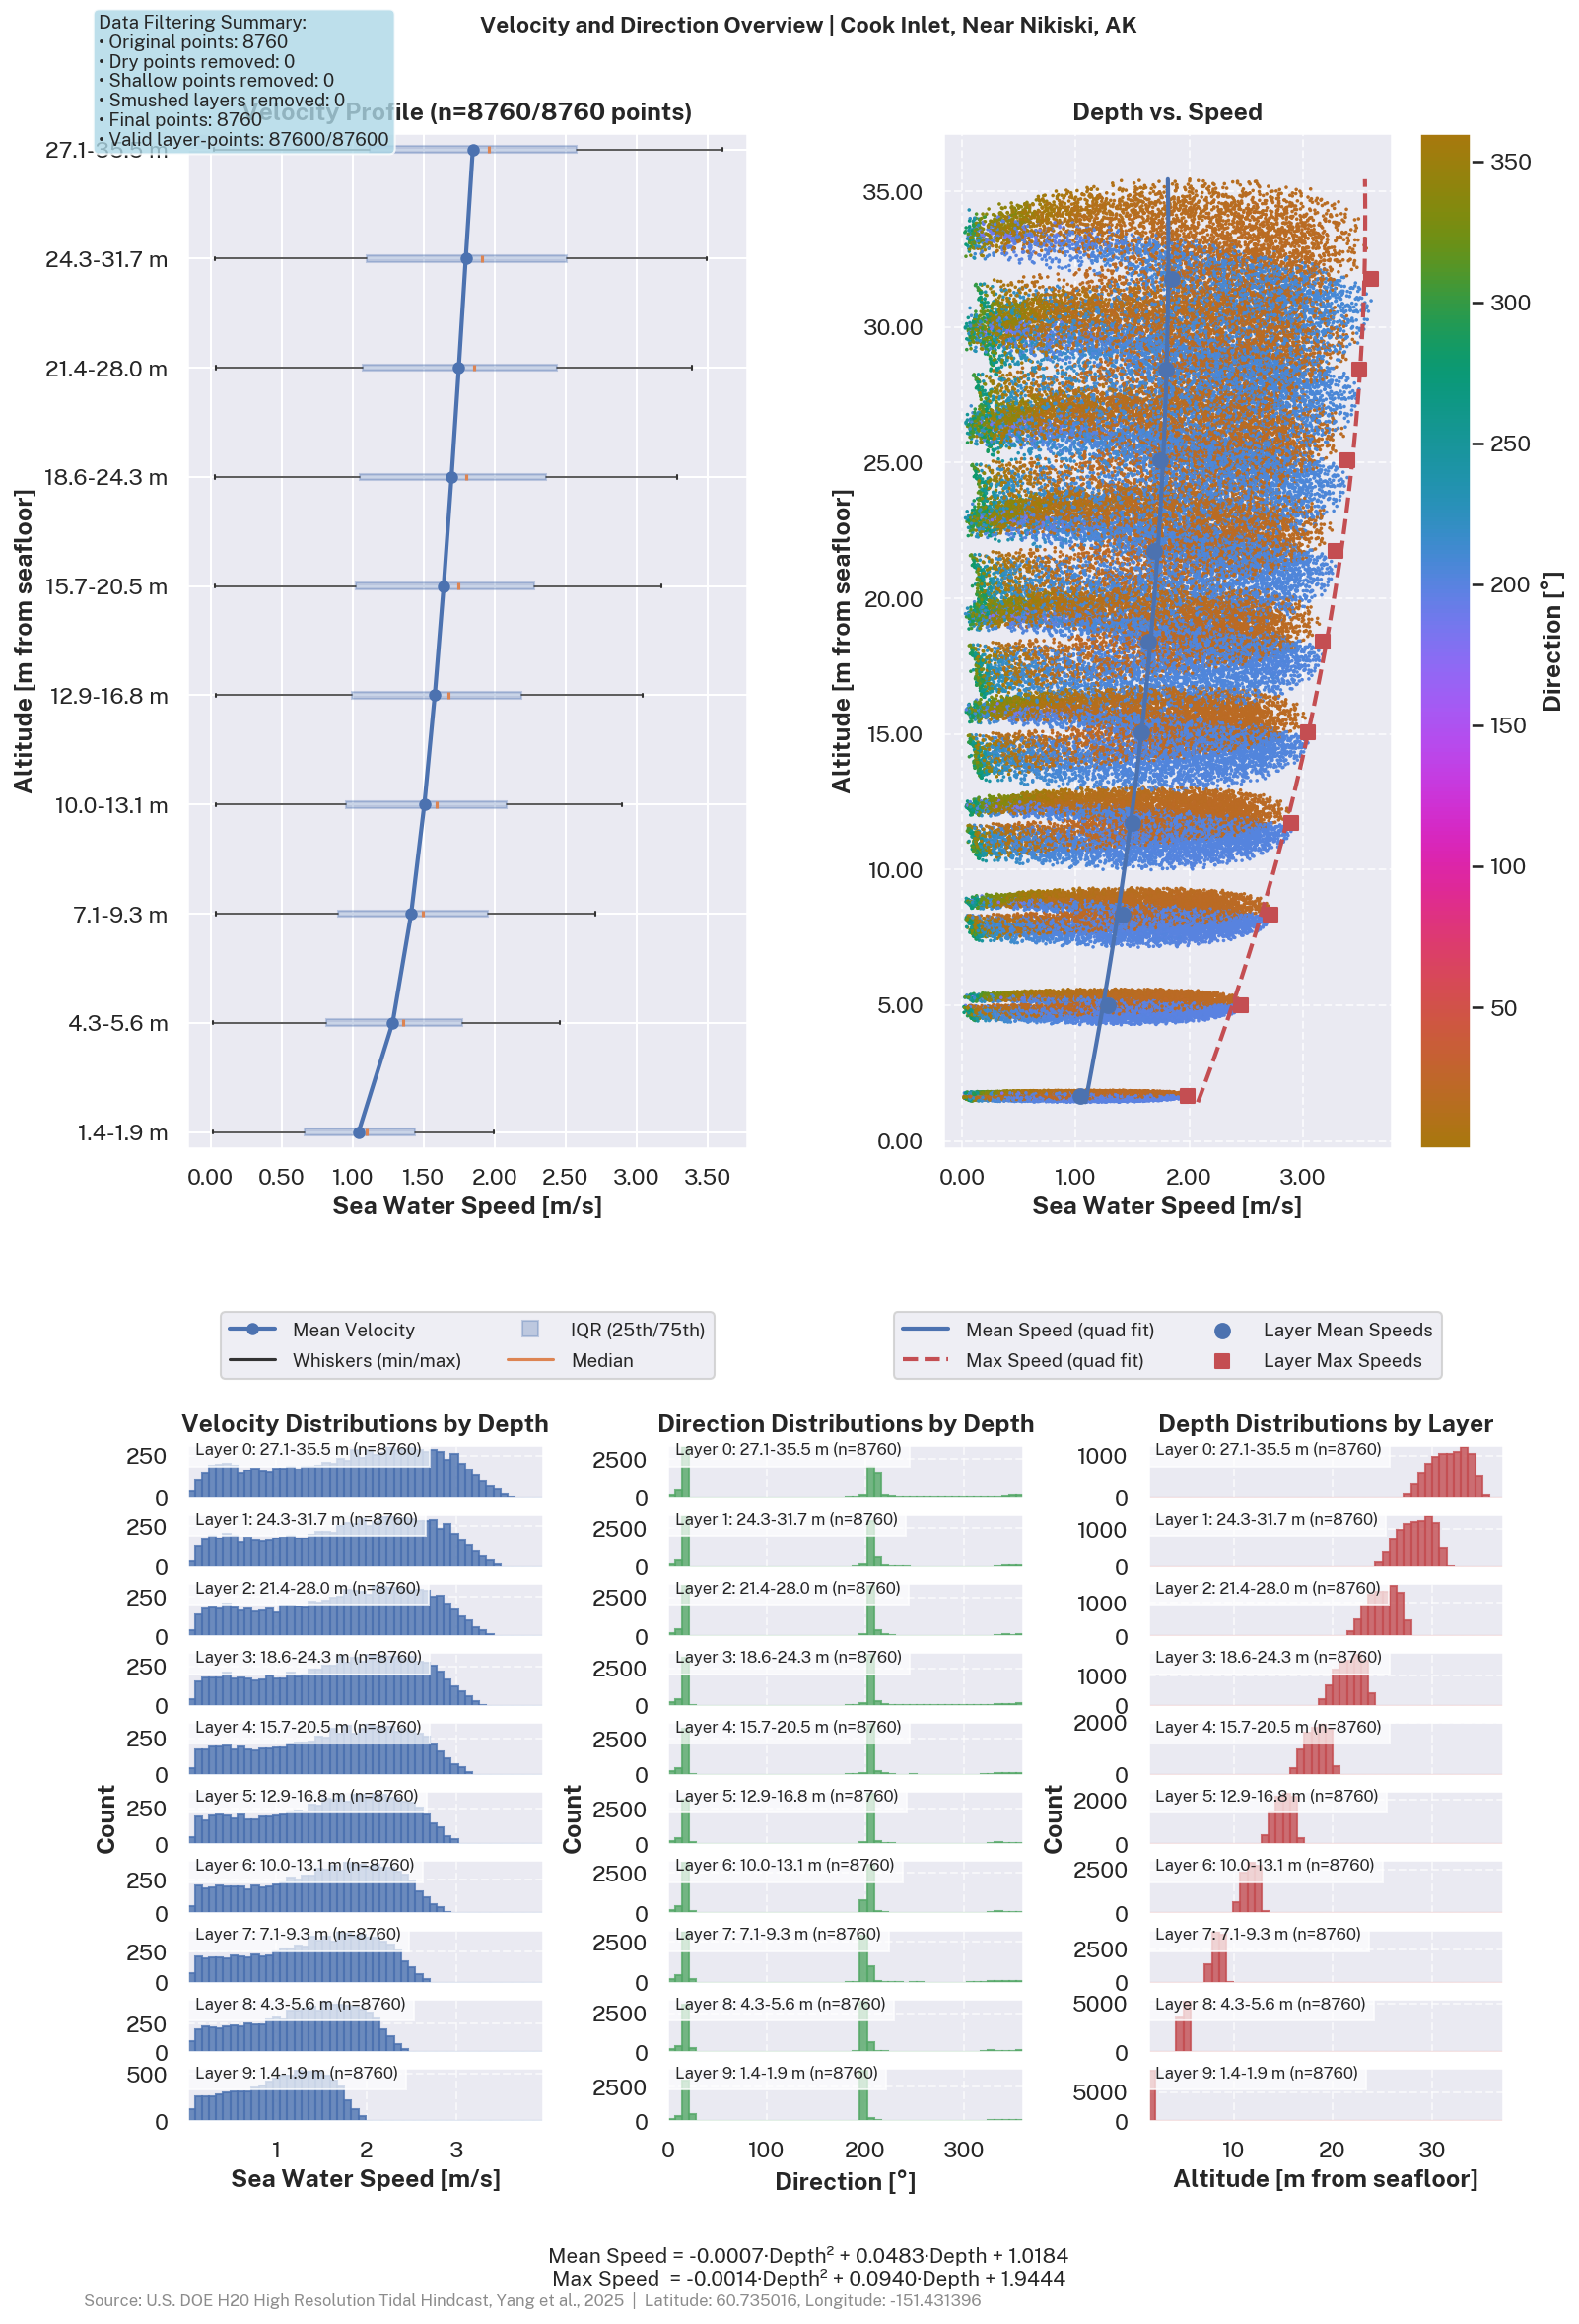
plot_velocity_profile_with_histograms produces a five-panel diagnostic
overview of the full vertical structure of the tidal resource. From left
to right: a mean velocity profile with per-layer box plots showing
spread and whiskers; a depth vs. speed scatter colored by direction with
quadratic mean and maximum fit curves; and per-layer histograms of
current speed, current direction, and sigma-layer depth. Before
plotting, dry time steps and anomalously thin (“smushed”) sigma layers
are removed; the data-quality summary in the top-left corner reports
what was filtered.
tidal.plot_velocity_profile_with_histograms(
    df,
    settings=PlotSettings(
        title=f"Velocity and Direction Overview | {location_name}",
        fig_width=10,
        fig_height=16,
        caption=f"Latitude: {lat}, Longitude: {lon}",
        save_path=img("quickstart-velocity-profile.png"),
    ),
)
Dataset Variables
The full variable reference documents every field in the dataset. The table and metadata below are generated directly from the parquet schema of the downloaded file.
Column names prefixed with vap_ are Value Added Products:
quantities derived from the raw model output (e.g. speed computed from
u/v components, power density from speed). Pass return_metadata=True
to get_data_at_point to receive CF-convention variable and file-level
metadata alongside the DataFrame.
Layered variables span all 10 sigma layers (layer 0 = sea surface, layer 9 = near-seafloor) and are collapsed to a single row.
| Variable | Label | Units |
|---|---|---|
| vap_sea_water_speed_layer_(0–9) | Sea Water Speed | m s-1 |
| vap_water_column_max_sea_water_speed | Depth maximum Sea Water Speed | m s-1 |
| vap_water_column_mean_sea_water_speed | Depth averaged Sea Water Speed | m s-1 |
| vap_sea_water_power_density_layer_(0–9) | Sea Water Power Density | W m-2 |
| vap_water_column_max_sea_water_power_density | Depth maximum Sea Water Power Density | W m-2 |
| vap_water_column_mean_sea_water_power_density | Depth averaged Sea Water Power Density | W m-2 |
| vap_sea_water_to_direction_layer_(0–9) | Sea Water Velocity To Direction | degree |
| vap_water_column_mean_sea_water_to_direction | Depth averaged Sea Water Velocity To Direction | degree |
| vap_surface_elevation | Sea Surface Elevation Relative to Mean Sea Level | m |
| u_layer_(0–9) | Eastward Water Velocity | m s-1 |
| v_layer_(0–9) | Northward Water Velocity | m s-1 |
| vap_sigma_depth_layer_(0–9) | Depth Below Sea Surface at Sigma Levels | m |
| element_corner_1_lat | Nodal Latitude | degrees_north |
| element_corner_1_lon | Nodal Longitude | degrees_east |
| element_corner_2_lat | Nodal Latitude | degrees_north |
| element_corner_2_lon | Nodal Longitude | degrees_east |
| element_corner_3_lat | Nodal Latitude | degrees_north |
| element_corner_3_lon | Nodal Longitude | degrees_east |
| vap_sea_floor_depth | Water Depth from Sea Surface to Seafloor | m |
| vap_water_column_mean_u | Depth averaged Eastward Water Velocity | m s-1 |
| vap_water_column_mean_v | Depth averaged Northward Water Velocity | m s-1 |
| vap_zeta_center | Sea Surface Height at Cell Centers from NAVD88 | m from NAVD88 |
Variable Metadata
Each column carries full CF-convention metadata accessible via
return_metadata=True. Here is the complete attribute set for
vap_sea_water_power_density_layer_0 as an example:
_, file_meta, var_meta = tidal.get_data_at_point(lat=lat, lon=lon, return_metadata=True)

pd.DataFrame(var_meta["vap_sea_water_power_density_layer_0"].items(), columns=["Attribute", "Value"])
| Attribute | Value | |
|---|---|---|
| 0 | long_name | Sea Water Power Density |
| 1 | units | W m-2 |
| 2 | grid | fvcom_grid |
| 3 | type | data |
| 4 | mesh | fvcom_mesh |
| 5 | location | face |
| 6 | coverage_content_type | modelResult |
| 7 | additional_processing | Computed using the fluid power density equatio... |
| 8 | computation | sea_water_power_density = 0.5 * rho * sea_wate... |
| 9 | input_variables | sea_water_speed (m/s), rho=`1025.0` (kg/m³) |
| 10 | citation | Haas, Kevin A., et al. 'Assessment of Energy P... |
Dataset Metadata
Each parquet file in this dataset also contains metadata that describes the dataset:
| Attribute | Value | |
|---|---|---|
| 0 | WPTO_HINDCAST_FORMAT_VERSION | 1.0 |
| 1 | WPTO_HINDCAST_METADATA_TYPE | netcdf_compatible |
| 2 | Conventions | CF-1.10, ACDD-1.3, ME Data Pipeline-1.0 |
| 3 | acknowledgement | This work was funded by the U.S. Department of... |
| 4 | code_url | https://github.com/NREL/Marine_Energy_Resource... |
| 5 | code_version | 1.0.0 |
| 6 | creator_country | USA |
| 7 | creator_email | zhaoqing.yang@pnnl.gov |
| 8 | creator_institution | Pacific Northwest National Laboratory (PNNL) |
| 9 | creator_institution_url | https://www.pnnl.gov/ |
| 10 | creator_name | Zhaoqing Yang |
| 11 | creator_sector | gov_federal |
| 12 | creator_state | Washington |
| 13 | creator_type | institution |
| 14 | creator_url | https://www.pnnl.gov/projects/ocean-dynamics-m... |
| 15 | contributor_name | Mithun Deb, Preston Spicer, Taiping Wang, Levi... |
| 16 | contributor_role | author, author, author, author, author, proces... |
| 17 | contributor_role_vocabulary | https://vocab.nerc.ac.uk/collection/G04/current/ |
| 18 | contributor_url | https://www.pnnl.gov, www.nrel.gov |
| 19 | data_level | b1 |
| 20 | dataset_name | wpto_high_res_tidal.ak_cook_inlet.v1.0.0 |
| 21 | datastream | wpto_high_res_tidal.ak_cook_inlet.b1.v1.0.0 |
| 22 | description | High-resolution tidal energy resource hindcas... |
| 23 | featureType | timeSeries |
| 24 | geospatial_lat_units | degrees_north |
| 25 | geospatial_lon_units | degrees_east |
| 26 | geospatial_vertical_origin | geoid |
| 27 | geospatial_vertical_positive | down |
| 28 | geospatial_vertical_units | m |
| 29 | history | Ran by asimms on x1003c2s1b1n1 (OS: Linux, Ker... |
| 30 | id | AK_cook_inlet.wpto_high_res_tidal.v1.0.0 |
| 31 | infoURL | https://www.github.com/nrel/marine_energy_reso... |
| 32 | inputs | ['/kfs2/projects/hindcastra/Tidal/datasets/hig... |
| 33 | keywords | OCEAN TIDES, TIDAL ENERGY, VELOCITY, SPEED, DI... |
| 34 | license | Freely Distributed |
| 35 | naming_authority | gov.nrel.water_power |
| 36 | references | Deb, Mithun, Zhaoqing Yang, and Taiping Wang. ... |
| 37 | temporal | hourly |
| 38 | date_created | 2023-02-07T20:23:00 |
| 39 | date_issued | 2025-11-12 |
| 40 | date_metadata_modified | 2025-11-20T19:46:18.682654+00:00 |
| 41 | date_modified | 2025-11-20T19:46:18.682654+00:00 |
| 42 | processing_level | b1 |
| 43 | product_version | 1.0.0 |
| 44 | program | U.S. Department of Energy (DOE) Office of Ener... |
| 45 | project | High Resolution Tidal Hindcast |
| 46 | summary | High-resolution tidal energy resource hindcas... |
| 47 | publisher_country | USA |
| 48 | publisher_email | michael.lawson@nrel.gov |
| 49 | publisher_institution | National Renewable Energy Laboratory (NREL) |
| 50 | publisher_name | Michael Lawson |
| 51 | publisher_state | Colorado |
| 52 | publisher_type | institution |
| 53 | publisher_url | https://www.nrel.gov |
| 54 | source | FVCOM_4.3.1 |
| 55 | title | High Resolution Tidal Hindcast for Cook Inlet,... |
Multi-Site Comparison
The following sections walk through data retrieval and core visualizations for a multi site comparison of multiple tidal energy sites across the US.
Site Definitions
To start we define the coordinates and names of the tidal sites we want to compare and save them in a Python list.
sites = [
    {"label": "Upper Cook Inlet, AK", "lat": 60.735016, "lon": -151.431396},
    {"label": "Tacoma Narrows, WA", "lat": 47.270191, "lon": -122.548172},
    {"label": "Admiralty Inlet, WA", "lat": 48.173931, "lon": -122.774963},
    {"label": "UNH Living Bridge, NH", "lat": 43.079498, "lon": -70.752319},
    {"label": "Moose Island, Western Passage, ME", "lat": 44.920837, "lon": -66.988762},
    {"label": "False Pass, Aleutian Islands, AK", "lat": 54.803799, "lon": -163.364441},
]

cook_inlet = sites[0]
Loading Data for All Sites
get_data_at_point finds the nearest grid point in the manifest and
downloads (or returns from cache) the full-year time-series parquet. It
returns a DataFrame with a DatetimeIndex and columns for speed,
direction, power density, and sigma-layer depth bounds at all 10
vertical levels.
site_data = {}

for site in sites:
    print(f"Loading {site['label']} …")
    site_data[site["label"]] = tidal.get_data_at_point(site["lat"], site["lon"])
    site_df = site_data[site["label"]]
    date_range = f"{site_df.index[0].date()} → {site_df.index[-1].date()}"
    print(f"  {len(site_df):,} timesteps  ({date_range})\n")
Loading Upper Cook Inlet, AK …
  8,760 timesteps  (2005-01-01 → 2005-12-31)

Loading Tacoma Narrows, WA …
  17,472 timesteps  (2015-01-01 → 2015-12-30)

Loading Admiralty Inlet, WA …
  17,472 timesteps  (2015-01-01 → 2015-12-30)

Loading UNH Living Bridge, NH …
  17,520 timesteps  (2007-01-01 → 2007-12-31)

Loading Moose Island, Western Passage, ME …
  17,520 timesteps  (2017-01-01 → 2017-12-31)

Loading False Pass, Aleutian Islands, AK …
  8,760 timesteps  (2010-06-03 → 2011-06-02)
Setup: Depth and Layer Selection
analysis_depth = 10.0  # nominal analysis depth in meters
depth_reference = "surface"  # "surface" or "sea_floor"

# Select the sigma layer closest to analysis_depth for each site.
site_layers = {}
for site in sites:
    layer, actual_depth = tidal.select_layer_for_depth(
        site_data[site["label"]],
        analysis_depth,
        relative_to=depth_reference,
    )
    site_layers[site["label"]] = (layer, actual_depth)
    print(
        f"{site['label']} layer {layer}  "
        f"({actual_depth:.1f} m)"
    )
Upper Cook Inlet, AK layer 2  (25.1 m)
Tacoma Narrows, WA layer 1  (53.2 m)
Admiralty Inlet, WA layer 1  (49.6 m)
UNH Living Bridge, NH layer 4  (11.8 m)
Moose Island, Western Passage, ME layer 2  (30.0 m)
False Pass, Aleutian Islands, AK layer 2  (34.3 m)
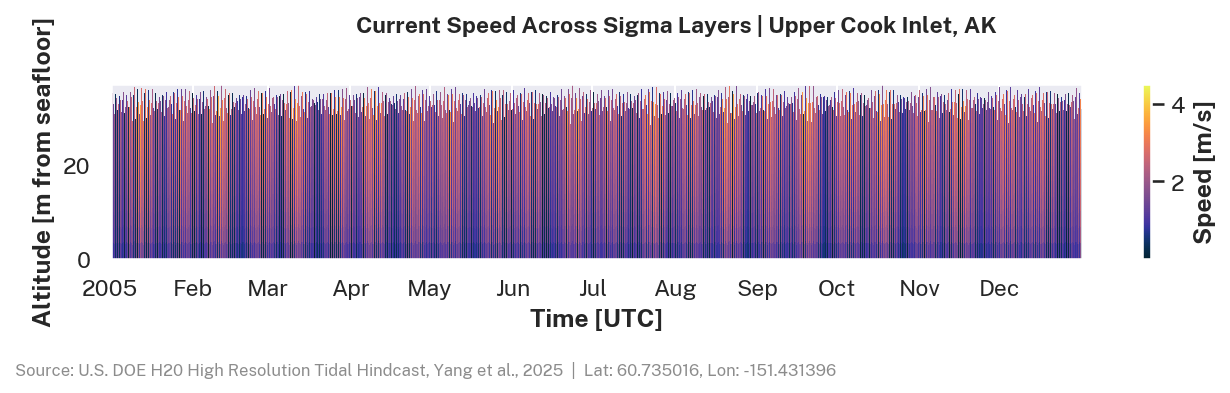
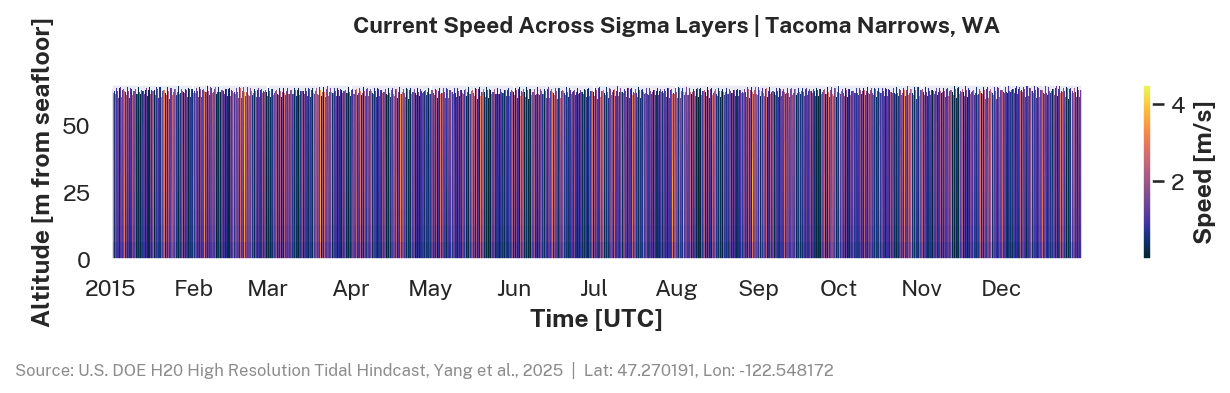
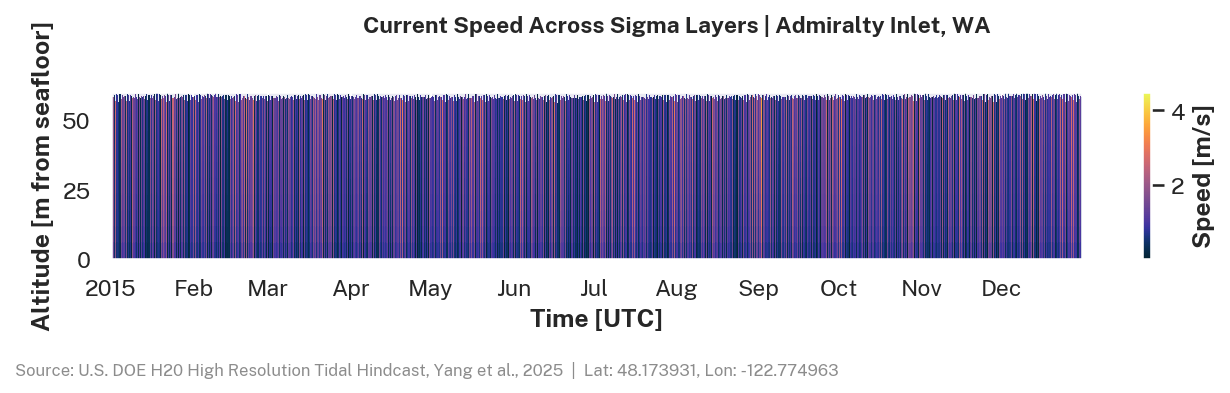
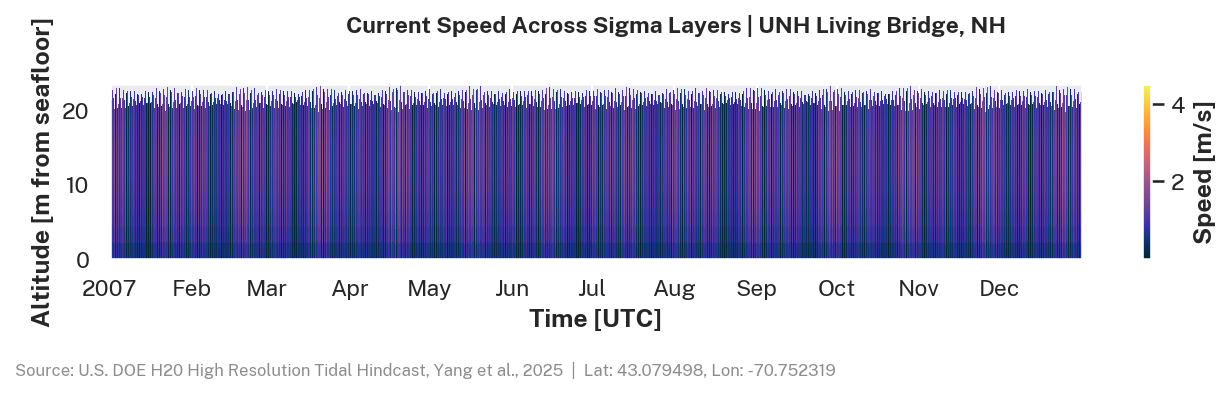
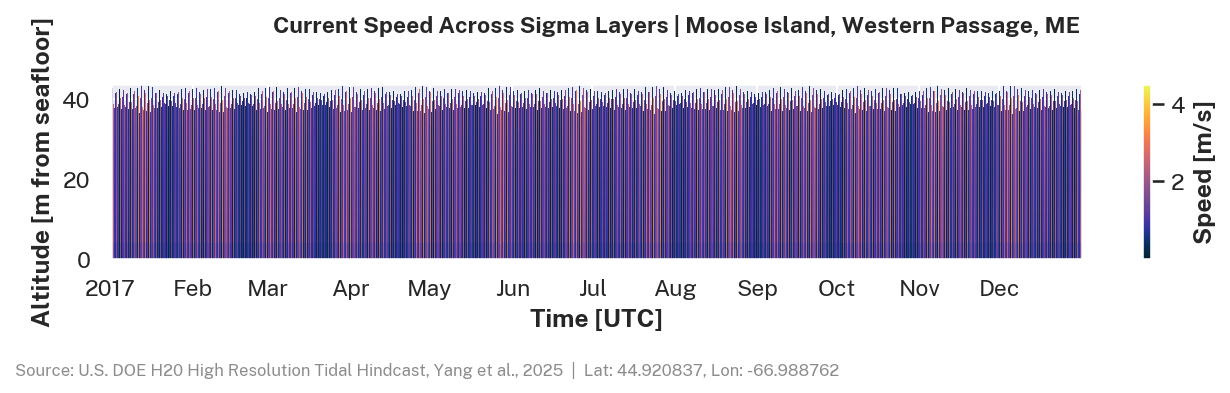
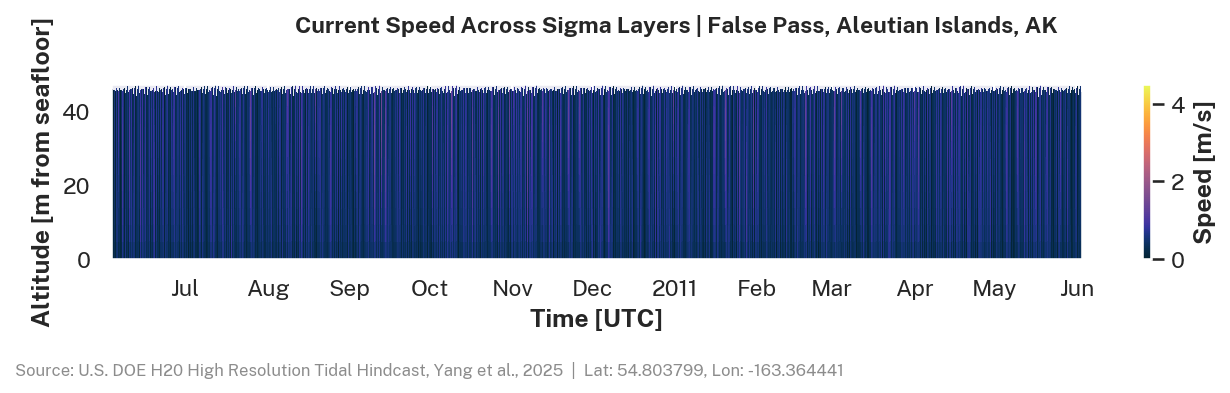
Current speed across depth and time: all sites
Each panel covers the full hindcast year at one site. The colorbar range
is shared across all six: vmax is the maximum speed in the dataset,
rounded up to the nearest 0.5 m/s.
import math

# Compute shared "nice max" colorbar limit.
all_max_speeds = [
    float(
        site_data[site["label"]][
            [f"vap_sea_water_speed_layer_{i}" for i in range(10)]
        ].max().max()
    )
    for site in sites
]
speed_vmax = math.ceil(max(all_max_speeds) / 0.5) * 0.5

for site in sites:
    slug = site["label"].lower().replace(", ", "-").replace(" ", "-").replace(".", "")
    site_df = site_data[site["label"]]
    tidal.plot_sigma_layers_speed(
        site_df,
        settings=PlotSettings(
            title=f"Current Speed Across Sigma Layers | {site['label']}",
            caption=f"Lat: {site['lat']}, Lon: {site['lon']}",
            colorbar_max=speed_vmax,
            fig_width=9,
            fig_height=2.5,
            save_path=img(f"sigma-speed-{slug}.png"),
        ),
    )
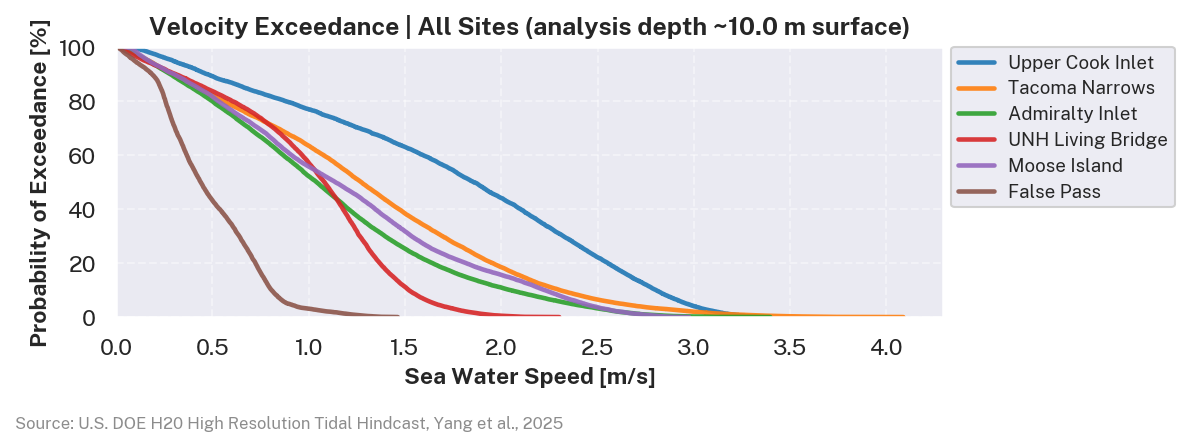
Velocity exceedance: all sites
All six sites on one figure at their respective analysis-depth layers.
colors = plt.cm.tab10.colors
site_records_exc = [
    (site["label"], site_data[site["label"]], site_layers[site["label"]][0], colors[i])
    for i, site in enumerate(sites)
]

tidal.plot_multi_site_exceedance_overlay(
    site_records_exc,
    settings=PlotSettings(
        title=f"Velocity Exceedance | All Sites (analysis depth ~{analysis_depth} m {depth_reference})",
        fig_height=3,
        fig_width=8,
        save_path=img("all-sites-exceedance-overlay.png"),
    ),
)
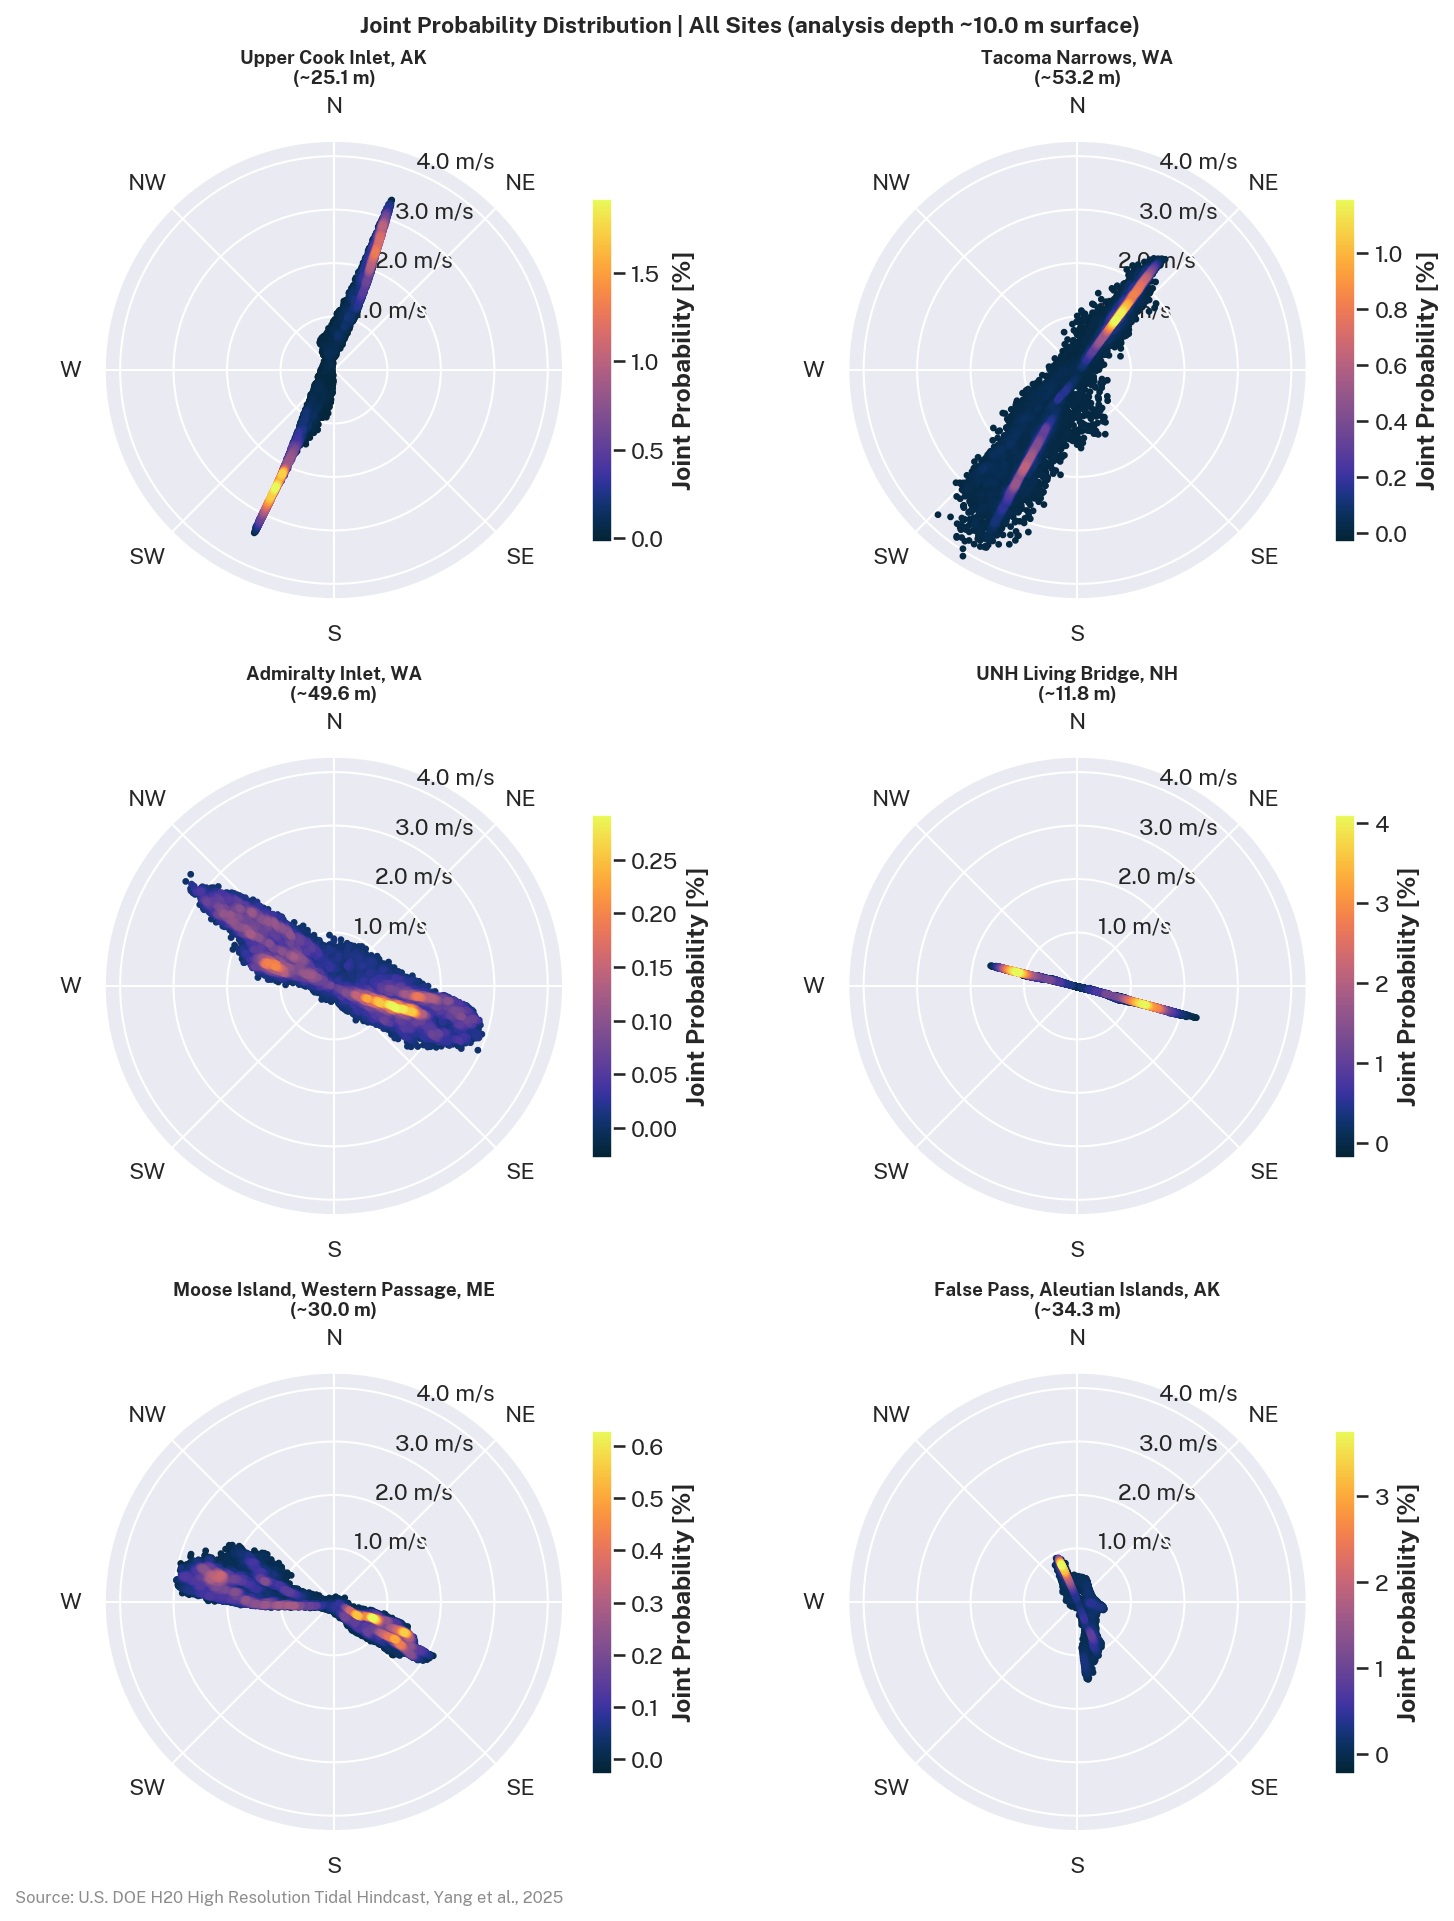
Joint probability distribution: all sites
2 × 3 grid of JPD polar histograms with a shared color scale.
site_records_jpd = [
    (site["label"], site_data[site["label"]], site_layers[site["label"]][0])
    for site in sites
]

tidal.plot_jpd_comparison_grid(
    site_records_jpd,
    ncols=2,
    settings=PlotSettings(
        title=f"Joint Probability Distribution | All Sites (analysis depth ~{analysis_depth} m {depth_reference})",
        fig_width=10,
        fig_height=13,
        save_path=img("all-sites-jpd-grid.png"),
    ),
)
Wave Hindcast
The library can also query the U.S. DOE WPTO High-Resolution Wave Hindcast at a point. The dataset covers 1979-2020 in six regions: West Coast, Atlantic, Alaska, Hawaii, Gulf of Mexico and Puerto Rico, and CNMI and Guam.
A query finds the hindcast grid node nearest the coordinate and fetches
its record. The defaults are narrow so a first look is quick: four key
variables for the most recent year, widened with --years,
--variables, or --all. Two backends serve the data and the default
picks between them by size. Small queries read straight from the
published files on S3, which needs no key or account, and large queries
switch to the NLR developer download API, which builds an archive server
side. The result is cached locally, so repeat queries read from disk.
Finding the node, describing a point, and small queries are free and need no account:
mer wave 44.57,-124.23 --info      # node, domain, years. No download
mer wave 44.57,-124.23             # shows its plan and asks first, no key needed
Large (> 3 years typically) queries are initially routed through the
api backend and need a free API key from
https://developer.nlr.gov/signup/ in NLR_DEVELOPER_API_KEY and a
contact email in NLR_DEVELOPER_EMAIL, and without a key they stay on
S3 and take longer. Set them in the environment, in a .env file in the
current directory, or in ~/.mer.env to make them work in every
directory:
cat > ~/.mer.env <<EOF
NLR_DEVELOPER_API_KEY=your_key
NLR_DEVELOPER_EMAIL=you@example.org
EOF
Download every variable and year at a single point, cli will ask for permission first
mer wave 44.57,-124.23 --all
Download every variable and year at a single point without asking permission (can be scripted)
mer wave 44.57,-124.23 --all -y
The result is saved as a CSV in the current directory (choose another
with -o DIR, or keep it only in the cache with --cache-only), and
every fetch is cached under ~/.mer_wave_cache so repeat queries read
from disk.
The same query is available in Python:
from us_marine_energy_resource import wave_hindcast

info = wave_hindcast.describe_point(44.567, -124.229)   # no download and no API key
df = wave_hindcast.get_data_at_point(44.567, -124.229)  # blocks while the data downloads
df is indexed by UTC timestamp with one column per wave variable, and
df.attrs carries the metadata: grid id, node position, and units, and
the api backend also records the water depth. Directions come back in
the meteorological convention for every region, including Hawaii, whose
published values need a correction that is applied automatically.
The raw ~80 GB yearly .h5 files remain browsable with the generic file
verbs (mer ls wave, mer explore wave/v1.0.1/West_Coast), and
mer download can fetch them when the full files are really wanted.
Command Line Interface
Installing via uv or pip includes the mer CLI for querying, exploring,
and downloading marine energy data directly from the command line
without Python. mer tidal queries and downloads the tidal hindcast,
mer wave queries the wave hindcast (see Wave
Hindcast above), mer sources lists the underlying
data sources, and the file verbs ls, info, explore, and download
work on any dataset path, s3:// prefix, or local file.
mer --help
Usage: mer [OPTIONS] COMMAND [ARGS]...

 U.S. marine energy resource (mer) tools for querying, exploring, and
 downloading data from open source data sources (see mer sources).

 Source Code:
 https://github.com/US-Marine-Energy-Resource/us-marine-energy-resource-python
 Issue Reporting:
 https://github.com/US-Marine-Energy-Resource/us-marine-energy-resource-python/
 issues

╭─ Commands ───────────────────────────────────────────────────────────────────╮
│ tidal     Query and download modeled tidal current data from the U.S. DOE    │
│           H2O High Resolution Tidal Hindcast, FVCOM simulations covering     │
│           five U.S. coastal regions: Cook Inlet AK, Aleutian Islands AK,     │
│           Salish Sea WA, Piscataqua River NH, and Western Passage ME.        │
│ wave      Query the U.S. DOE WPTO High-Resolution Wave Hindcast at a point.  │
│           The dataset covers 1979-2020 in six regions: West Coast, Atlantic, │
│           Hawaii, Alaska, Gulf of Mexico and Puerto Rico, and CNMI and Guam. │
│ sources   List the marine energy resource data sources                       │
│ ls        List the immediate children of a directory, dataset, or s3://      │
│           prefix.                                                            │
│ info      Show metadata: a prefix's sizes and a truncated tree, or a file's  │
│           global attributes plus each variable's attributes (HDF5/netCDF) or │
│           column schema (parquet). For a remote HDF5 file, add --variables   │
│           to collect every variable's attributes.                            │
│ explore   Inspect a file's contents (structure, values, statistics), or      │
│           browse a dataset's S3 layout. For a file, prints an overview by    │
│           default. --info, --tree, --attrs, --head, and --stats select a     │
│           single view.                                                       │
│ download  Download a file, or one level of a directory, with a size limit    │
│           and a progress bar.                                                │
╰──────────────────────────────────────────────────────────────────────────────╯
╭─ Options ────────────────────────────────────────────────────────────────────╮
│ --install-completion          Install completion for the current shell.      │
│ --show-completion             Show completion for the current shell, to copy │
│                               it or customize the installation.              │
╰──────────────────────────────────────────────────────────────────────────────╯
The us-tidal command from earlier releases still works as a deprecated
alias for mer tidal and will be removed in a future release.
Tidal options
mer tidal --help
Usage: mer tidal [OPTIONS] [LOCATION]

 Query and download modeled tidal current data from the U.S. DOE H2O High
 Resolution Tidal Hindcast, FVCOM simulations covering five U.S. coastal
 regions: Cook Inlet AK, Aleutian Islands AK, Salish Sea WA, Piscataqua River
 NH, and Western Passage ME.

 A point query returns the mesh face containing the coordinate. Area and
 transect queries return all faces whose triangles geometrically intersect the
 specified geometry. Each matched face downloads as a full-year, hourly or
 half-hourly time series of current speed, direction, and kinetic power density
 at 10 depth layers (sea surface to seafloor).

 Dataset citation: https://mhkdr.openei.org/submissions/632
 Documentation:
 https://github.com/US-Marine-Energy-Resource/us-marine-energy-resource-python
 AWS S3 browser:
 https://data.openei.org/s3_viewer?bucket=marine-energy-data&prefix=us-tidal%2F

 Provide exactly one geometry input: a positional lat,lon for
 a point query, or one of --coord, --bbox, --file,
 or --wkt for area queries.

╭─ Arguments ──────────────────────────────────────────────────────────────────╮
│   location      [LOCATION]  Point as lat,lon (e.g. 60.73,-151.43).           │
╰──────────────────────────────────────────────────────────────────────────────╯
╭─ Options ────────────────────────────────────────────────────────────────────╮
│ --coord            -c      TEXT   Transect waypoint as lat,lon. Repeat for   │
│                                   multi-segment lines.                       │
│ --bbox                     TEXT   Bounding box as                            │
│                                   lat_min,lon_min,lat_max,lon_max.           │
│ --file             -f      PATH   Polygon from a GeoJSON file. Draw one at   │
│                                   https://geojson.io/next/.                  │
│ --wkt                      TEXT   Polygon as a WKT POLYGON string or path to │
│                                   a .wkt file.                               │
│ --output-dir       -o      PATH   Copy downloaded parquet files to this      │
│                                   directory.                                 │
│ --csv                             Export downloaded data as CSV files.       │
│                                   Written to --output-dir if set, otherwise  │
│                                   to the current directory.                  │
│ --dry-run                         Show size estimate without downloading.    │
│ --max-size-mb              FLOAT  Abort if uncached data to download exceeds │
│                                   this limit (MB). 0 = no limit.             │
│                                   [env var: US_TIDAL_MAX_SIZE_MB]            │
│                                   [default: 500.0]                           │
│ --max-distance-km          FLOAT  Reject if nearest face is farther than     │
│                                   this (km). Point queries only.             │
│ --config                   PATH   Path to config file (default:              │
│                                   ~/.us_tidal.toml).                         │
│ --aws-profile              TEXT   Override AWS profile from config.          │
│ --cache-dir                PATH   Override local cache directory from        │
│                                   config.                                    │
│ --use-hpc                         Use HPC local filesystem instead of S3.    │
│ --hpc-base-path            TEXT   Override HPC dataset root path from        │
│                                   config.                                    │
│ --clear-cache                     Clear the local cache before running.      │
│ --help                            Show this message and exit.                │
╰──────────────────────────────────────────────────────────────────────────────╯
╭─ Dataset Info ───────────────────────────────────────────────────────────────╮
│ --info                           Show dataset metadata, schema, and          │
│                                  statistics without downloading. Reads only  │
│                                  the parquet footer (fast range requests).   │
│ --info-speed                     Show speed category info only (implies      │
│                                  --info).                                    │
│ --info-direction                 Show direction category info only (implies  │
│                                  --info).                                    │
│ --info-power                     Show power density category info only       │
│                                  (implies --info).                           │
│ --info-depth                     Show depth/water-level category info only   │
│                                  (implies --info).                           │
│ --layer                 INTEGER  Sigma layer for --info statistics           │
│                                  (0=surface, 9=near-bed). Repeat to select   │
│                                  multiple layers.                            │
│ --depth                 FLOAT    Select the sigma layer nearest to this      │
│                                  depth (m from surface) for --info           │
│                                  statistics. Approximate — uses footer depth │
│                                  stats.                                      │
│ --depth-avg                      Average --info statistics across all sigma  │
│                                  layers.                                     │
╰──────────────────────────────────────────────────────────────────────────────╯

 Examples
 mer tidal 60.73,-151.43                              Point query
 mer tidal --coord 60.7,-151.4 --coord 60.9,-151.2   Transect
 mer tidal --bbox 60.7,-151.5,60.9,-151.2            Bounding box
 mer tidal --file study_area.geojson                  Polygon from file
 mer tidal --wkt "POLYGON((-151.5 60.7,...))"         Polygon from WKT
 mer tidal 60.73,-151.43 --dry-run                    Size estimate
 mer tidal 60.73,-151.43 --info                       Dataset info (no
 download)
 mer tidal 60.73,-151.43 --info --layer 3             Layer 3 stats
 mer tidal 60.73,-151.43 --output-dir ./data          Save parquet files
 mer tidal 60.73,-151.43 --csv                        Export CSV to current dir
 Config file (~/.us_tidal.toml) sets defaults for AWS, cache, and HPC options.
Point query: nearest grid point
mer tidal accepts a positional lat,lon argument. Start with
--dry-run to check the size before committing to a download.
mer tidal 60.73,-151.43 --dry-run
face_id    00126601
 location   AK_cook_inlet
 latitude   60.7298317
 longitude  -151.4297485
 distance   0.00 km (containing cell)
 file       AK_cook_inlet/v1.0.0/b1_vap_by_point_partition/lat_deg=60/lon_deg=…
 s3         s3://marine-energy-data/us-tidal/AK_cook_inlet/v1.0.0/b1_vap_by_po…
 url        https://marine-energy-data.s3.us-west-2.amazonaws.com/us-tidal/AK_…
  Files matched          1
  Total size        3.6 MB
  Already cached    3.6 MB
  To download       0.0 MB
On first run the file is fetched from S3. Subsequent calls read from the local cache with no network traffic.
# First run - downloads from S3
mer tidal 60.73,-151.43
face_id    00126601
 location   AK_cook_inlet
 latitude   60.7298317
 longitude  -151.4297485
 distance   0.00 km (containing cell)
 file       AK_cook_inlet/v1.0.0/b1_vap_by_point_partition/lat_deg=60/lon_deg=…
 s3         s3://marine-energy-data/us-tidal/AK_cook_inlet/v1.0.0/b1_vap_by_po…
 url        https://marine-energy-data.s3.us-west-2.amazonaws.com/us-tidal/AK_…

             Statistics  (surface layer)

  metric                   mean       p90       max
 ───────────────────────────────────────────────────
  Speed (m/s)             1.963     3.165      4.04
  Power density (W/m²)   6533.1   16244.9   33806.0


  ✓  1 file cached at ~/.us_tidal_cache/marine-energy-data

  Elapsed: 2.2s  (S3 download)
# Second run - served from local cache
mer tidal 60.73,-151.43
face_id    00126601
 location   AK_cook_inlet
 latitude   60.7298317
 longitude  -151.4297485
 distance   0.00 km (containing cell)
 file       AK_cook_inlet/v1.0.0/b1_vap_by_point_partition/lat_deg=60/lon_deg=…
 s3         s3://marine-energy-data/us-tidal/AK_cook_inlet/v1.0.0/b1_vap_by_po…
 url        https://marine-energy-data.s3.us-west-2.amazonaws.com/us-tidal/AK_…

             Statistics  (surface layer)

  metric                   mean       p90       max
 ───────────────────────────────────────────────────
  Speed (m/s)             1.963     3.165      4.04
  Power density (W/m²)   6533.1   16244.9   33806.0


  ✓  1 file cached at ~/.us_tidal_cache/marine-energy-data

  Elapsed: 1.3s  (local cache)
Area query: all grid points in a bounding box
--bbox takes lat_min,lon_min,lat_max,lon_max. Use --dry-run first
because bbox queries can match thousands of faces.
mer tidal --bbox 60.725,-151.445,60.735,-151.425 --dry-run
Matched 103 faces  ·  AK_cook_inlet

  face_id    location             lat          lon   dist_km
 ────────────────────────────────────────────────────────────
  00127584   AK_cook_inlet   60.72406    -151.4444       0.0
  00126347   AK_cook_inlet   60.73291   -151.43512       0.0
  00127215   AK_cook_inlet   60.72453   -151.42508       0.0
  00127216   AK_cook_inlet   60.72458   -151.42688       0.0
  00127220   AK_cook_inlet   60.72469   -151.43073       0.0
  00127219   AK_cook_inlet   60.72481   -151.43262       0.0
  00127383   AK_cook_inlet   60.72487   -151.43976       0.0
  00127585   AK_cook_inlet    60.7249    -151.4458       0.0
  00127382   AK_cook_inlet   60.72509   -151.44177       0.0
  00127380   AK_cook_inlet   60.72521   -151.43649       0.0
  00127007   AK_cook_inlet   60.72524   -151.42371       0.0
  00127217   AK_cook_inlet   60.72542   -151.42734       0.0
  00127381   AK_cook_inlet   60.72544   -151.43842       0.0
  00127218   AK_cook_inlet   60.72548   -151.42923       0.0
  00127200   AK_cook_inlet    60.7257   -151.43311       0.0
  00127201   AK_cook_inlet   60.72588   -151.43506       0.0
  00127384   AK_cook_inlet    60.7259    -151.4422       0.0
  00127006   AK_cook_inlet    60.7261   -151.42401       0.0
  00127387   AK_cook_inlet   60.72612   -151.44556       0.0
  00127008   AK_cook_inlet   60.72623   -151.42584       0.0

  … and 83 more
  Files matched           103
  Total size        ~367.3 MB
  Already cached       3.6 MB
  To download       ~363.7 MB
# Download all matched faces (~367 MB)
mer tidal --bbox 60.725,-151.445,60.735,-151.425 --output-dir ./data
Transect query: grid points along a line
--coord defines a waypoint. Repeat it to build a multi-segment path.
All faces whose triangles geometrically intersect the path are returned.
mer tidal --coord 60.72,-151.43 --coord 60.75,-151.44 --dry-run
Matched 39 faces  ·  AK_cook_inlet

  face_id    location             lat          lon   dist_km
 ────────────────────────────────────────────────────────────
  00127818   AK_cook_inlet   60.72053   -151.43036       0.0
  00127621   AK_cook_inlet   60.72163   -151.43011       0.0
  00127622   AK_cook_inlet   60.72207   -151.43176       0.0
  00127423   AK_cook_inlet   60.72301   -151.43188       0.0
  00127422   AK_cook_inlet   60.72375   -151.43024       0.0
  00127220   AK_cook_inlet   60.72469   -151.43073       0.0
  00127219   AK_cook_inlet   60.72481   -151.43262       0.0
  00127200   AK_cook_inlet    60.7257   -151.43311       0.0
  00127012   AK_cook_inlet   60.72645   -151.43164       0.0
  00126992   AK_cook_inlet   60.72733   -151.43219       0.0
  00126807   AK_cook_inlet   60.72812   -151.43073       0.0
  00126788   AK_cook_inlet   60.72897   -151.43127       0.0
  00126787   AK_cook_inlet   60.72909   -151.43335       0.0
  00126764   AK_cook_inlet      60.73   -151.43396       0.0
  00126581   AK_cook_inlet   60.73064   -151.43268       0.0
  00126558   AK_cook_inlet   60.73155   -151.43317       0.0
  00126557   AK_cook_inlet    60.7319   -151.43494       0.0
  00126345   AK_cook_inlet   60.73349   -151.43335       0.0
  00126347   AK_cook_inlet   60.73291   -151.43512       0.0
  00126128   AK_cook_inlet    60.7345   -151.43329       0.0

  … and 19 more
  Files matched            39
  Total size        ~139.1 MB
  Already cached       0.0 MB
  To download       ~139.1 MB
# Download all matched faces (~139 MB)
mer tidal --coord 60.72,-151.43 --coord 60.75,-151.44 --output-dir ./data
Export options
# Save parquet files to a directory
mer tidal 60.73,-151.43 --output-dir ./data

# Export as CSV instead
mer tidal 60.73,-151.43 --csv --output-dir ./data
Configuration file
~/.us_tidal.toml sets persistent defaults for mer tidal: AWS
credentials, cache location, and HPC paths. Its [explore] table sets
transfer size limits for the ls, info, explore, and download
verbs. CLI flags always override the config file.
# ~/.us_tidal.toml
aws_profile   = "my-aws-profile"
cache_dir     = "/scratch/us_tidal_cache"
Direct Downloads using the tidal_hindcast API
Tidal hindcast data is accessible via multiple functions that can be
used independently of the plotting functions. This allows users to
access the underlying data at specific points, along lines, or within
rectangular areas. This downloads data to a local cache directory and
returns the path to the downloaded files, which can be loaded and
analyzed with the load_parquet and prepare_dataframe functions in
the analysis module.
tidal._state is initialized lazily on the first get_data_at_point()
call; call that once to populate the shared cache and manifest before
accessing _state directly.
from us_marine_energy_resource import tidal_hindcast as tidal
from us_marine_energy_resource.analysis import load_parquet, prepare_dataframe

# Initialize the shared cache and manifest (no-op if already done above).
tidal.get_data_at_point(lat=60.73, lon=-151.43)

# Access the underlying cache and manifest directly.
cache = tidal._state.cache
query = tidal._state.query   # TidalManifestQuery instance

# --- Spatial queries against the manifest -----------------------------------

# Single nearest point
point = query.query_nearest_point(lat=60.73, lon=-151.43)

# All faces whose triangles intersect the bounding box
area = query.query_all_within_rectangular_area(
    60.7, 60.8, -151.5, -151.4
)

# All faces whose triangles are crossed by the line segment
line = query.query_all_on_line(
    60.7, -151.4, 60.8, -151.5
)

print(
    f"Nearest point : face {point['point']['face_id']}"
    f"  ({point['point']['lat']:.4f}, {point['point']['lon']:.4f})"
    f"  -  {point['distance_km']:.3f} km"
)
print(f"Area query    : {len(area)} grid centroids in bbox")
print(f"Line query    : {len(line)} grid centroids along transect")
Nearest point : face 00126601  (60.7298, -151.4297)  -  0.000 km
Area query    : 3741 grid centroids in bbox
Line query    : 126 grid centroids along transect
# Load a specific grid point's full-year time-series parquet.
local_path = cache.get(point["point"]["file_path"])
raw_df, file_meta, var_meta = load_parquet(local_path)
df = prepare_dataframe(raw_df, file_meta)
print(f"Loaded {len(df):,} timesteps, {df.shape[1]} columns")
Loaded 8,760 timesteps, 136 columns
1 maintainer

Download files
Download the file for your platform. If you're not sure which to choose, learn more about installing packages.
Source Distribution
Built Distribution
Filter files by name, interpreter, ABI, and platform.
If you're not sure about the file name format, learn more about wheel file names.
Copy a direct link to the current filters
File details
Details for the file us_marine_energy_resource-0.5.0.tar.gz.
File metadata
- Download URL: us_marine_energy_resource-0.5.0.tar.gz
- Upload date:
- Size: 75.4 MB
- Tags: Source
- Uploaded using Trusted Publishing? Yes
- Uploaded via:
twine/6.1.0 CPython/3.13.14
File hashes
| Algorithm | Hash digest | |
|---|---|---|
| SHA256 |
0a45bcf41d42ee4497ca5a2f1fedeaf2d13ac4c05e2e2d8cd5fe044f39faa2e4
|
|
| MD5 |
ee1d4fe5a5de2a9e4db73f978d5d274f
|
|
| BLAKE2b-256 |
6ac1abbdfecbb4d72dada5e41f1b06e407819e0377d325cf8ad260d609465644
|
Provenance
The following attestation bundles were made for us_marine_energy_resource-0.5.0.tar.gz:
Publisher:
publish.yml on US-Marine-Energy-Resource/us-marine-energy-resource-python
-
Statement:
-
Statement type:
https://in-toto.io/Statement/v1 -
Predicate type:
https://docs.pypi.org/attestations/publish/v1 -
Subject name:
us_marine_energy_resource-0.5.0.tar.gz -
Subject digest:
0a45bcf41d42ee4497ca5a2f1fedeaf2d13ac4c05e2e2d8cd5fe044f39faa2e4 - Sigstore transparency entry: 2226666383
- Sigstore integration time:
-
Permalink:
US-Marine-Energy-Resource/us-marine-energy-resource-python@09c2d85127aaa0f104289f4cef279c31d8a6e2d3 -
Branch / Tag:
refs/tags/v0.5.0 - Owner: https://github.com/US-Marine-Energy-Resource
-
Access:
public
-
Token Issuer:
https://token.actions.githubusercontent.com -
Runner Environment:
github-hosted -
Publication workflow:
publish.yml@09c2d85127aaa0f104289f4cef279c31d8a6e2d3 -
Trigger Event:
release
-
Statement type:
File details
Details for the file us_marine_energy_resource-0.5.0-py3-none-any.whl.
File metadata
- Download URL: us_marine_energy_resource-0.5.0-py3-none-any.whl
- Upload date:
- Size: 72.4 MB
- Tags: Python 3
- Uploaded using Trusted Publishing? Yes
- Uploaded via:
twine/6.1.0 CPython/3.13.14
File hashes
| Algorithm | Hash digest | |
|---|---|---|
| SHA256 |
bd483541e28fc2de6d9cdc0ba375658cd2b43138a5c8540c11efc1da8a56a08c
|
|
| MD5 |
30a8568fe00f3b0bce909b6203273073
|
|
| BLAKE2b-256 |
7ab3192982fdac2d0d930dbdb0b3312791497aeee313cb56d26290f49d555a79
|
Provenance
The following attestation bundles were made for us_marine_energy_resource-0.5.0-py3-none-any.whl:
Publisher:
publish.yml on US-Marine-Energy-Resource/us-marine-energy-resource-python
-
Statement:
-
Statement type:
https://in-toto.io/Statement/v1 -
Predicate type:
https://docs.pypi.org/attestations/publish/v1 -
Subject name:
us_marine_energy_resource-0.5.0-py3-none-any.whl -
Subject digest:
bd483541e28fc2de6d9cdc0ba375658cd2b43138a5c8540c11efc1da8a56a08c - Sigstore transparency entry: 2226666925
- Sigstore integration time:
-
Permalink:
US-Marine-Energy-Resource/us-marine-energy-resource-python@09c2d85127aaa0f104289f4cef279c31d8a6e2d3 -
Branch / Tag:
refs/tags/v0.5.0 - Owner: https://github.com/US-Marine-Energy-Resource
-
Access:
public
-
Token Issuer:
https://token.actions.githubusercontent.com -
Runner Environment:
github-hosted -
Publication workflow:
publish.yml@09c2d85127aaa0f104289f4cef279c31d8a6e2d3 -
Trigger Event:
release
-
Statement type:














