X-ray Temperature Clustering


Project description
Xray TEmperature Clustering (XTEC)
- Venderley et al. (https://arxiv.org/abs/2008.03275).
Introduction
At synchrotron sources, such as the Advanced Photon Source (APS), it is now routinely possible to collect x-ray diffraction data from single crystals that contain thousands, and even tens of thousands, of Brillouin Zones, in well under half an hour. This means that detailed parametric studies, e.g., as a function of temperature or magnetic field, can be completed in well under a day. These capabilities have arisen from the coupling of high x-ray brightness with new generations of photon-counting area detectors that combine fast frame rates with high dynamic range and low backgrounds.
These experimental methods are ideal for investigating the temperature dependence of structural correlations, whether short- or long-range. For example, if there is a structural phase transition, below which new superlattice peaks emerge owing to a reduction in symmetry, these experiments will contain information on the temperature dependence both of the order parameter, i.e., the superlattice peak intensities, and the critical fluctuations above the transition. However, ensuring that all components of the order parameter, including secondary order parameters, or all relevant fluctuations have been identified is not generally possible by manual inspection alone.
To meet this challenge, the application, XRD Temperature Clustering (XTEC), uses unsupervised machine learning, in particular, the Gaussian Mixture Model, to extract from the billions of recorded pixels a reduced set of temperature trajectories that correspond to distinct physical processes in the material. The trajectories are rescaled so that we can compare trajectories at different intensities, focusing on their temperature dependence rather than their absolute scale. A technique known as label smoothing averages cluster assignments of neighboring pixels to enforce local correlations. XTEC is able to extract both the temperature dependence and the Q-dependence of emergent order parameters, such as charge-density-wave modulations, without any prior input. It has also been used to separate superlattice peaks from the critical fluctuations that surround them.
Methods
When the temperature T is lowered below a certain threshold, the system can give way to an ordered state. Hence the temperature (T) evolution of the XRD intensity for reciprocal space point q, I(q,T) , must be qualitatively different if the given reciprocal space point q reflects order parameters or their fluctuations. Tracking the temperature evolution of thousands of Brillouin zones to identify systematic trends and correlations in any comprehensive manner is impossible to achieve manually without selection bias.
X-TEC is an unsupervised and interpretable machine learning (ML) algorithm that can identify the order parameters and their fluctuations from the voluminous data by clustering the temperature series associated with a given q: I(q,T) , according to qualitative features in the temperature dependence.
At the core of XTEC is a Gaussian Mixture Model (GMM) clustering to identify disctint temperature trajectories. The figure below shows a simplified illutration of GMM clustering behind XTEC.
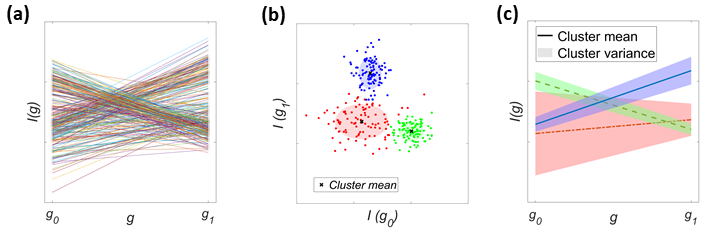
To cluster distinct I(g) trajectories given the collection of series {I(g0),I(g1),…,I(gN−1)} (N=2 in the above figure), the raw trajectories (in panel (a)) can be mapped to a simple Gaussian Mixture Model (GMM) clustering problem on a N dimensional space (panel (b)). In the above figure, GMM clustering identifies three distinct clusters color-coded as red, blue and green. From the GMM cluster mean and variance (panel (b)), we get the distinct trajectories of I(g) and their variance (panel (c)).
Note that g can be any parameter like temperature, time, energy etc. Hence apart from temperature series data, you can adapt X-TEC to analysie any other parametric dependence like time or energy series data.
Installation
Released versions of XTEC can be installed using either
$ pip install xtec
or by cloning the Git repository and installing from source:
$ git clone https://github.com/KimGroup/XTEC
Tutorials
There are three Jupyter notebooks, which can be downloaded from this
repository to see XTEC in action. They show how XTEC identifies a
charge density wave (CDW) ordering in reciprocal space from temperature
series voluminous XRD data collected at Advanced Photon Source on
Sr3Rh4Sn13: a a quasi-skutterudite
family which shows CDW ordering below a critical temperature. The
tutorials are:
-
Tutorial_XTEC-d: this performs simple GMM clustering, treating each pixel independently. This mode of XTEC can distinguish the diffuse scatering, hence ideal for probing fluctuations of order parameters. -
Tutorial_XTEC-s_with_label_smoothing: ensures the cluster assignments in neighbouring pixels are correlated (smoothed). This mode is better suited to probe order parameter peaks and their visualization in reciprocal space. -
Tutorial_XTEC-s_with_peak_averaging: Faster and cheaper version of label smoothing by assigning connected pixels of the peaks with their peak averaged intensities. Best suited to get order parameters quickly from large datasets.
Data for tutorials
The XRD data on Sr3Rh4Sn13 collected at the Advanced
Photon Source is available for download at https://dx.doi.org/10.18126/iidy-30e7.
Download the file srn0_XTEC.nxs (~32 GB) which has all the data needed for the
tutorial notebooks.
Contact info
Any questions and comments on the code, tutorials and the use of XTEC can be directed to Krishnanand Mallayya (kmm537@cornell.edu)
Release history Release notifications | RSS feed


Download files
Download the file for your platform. If you're not sure which to choose, learn more about installing packages.
Source Distribution
Built Distribution
Filter files by name, interpreter, ABI, and platform.
If you're not sure about the file name format, learn more about wheel file names.
Copy a direct link to the current filters
File details
Details for the file XTEC-0.1.1.tar.gz.
File metadata
- Download URL: XTEC-0.1.1.tar.gz
- Upload date:
- Size: 757.7 kB
- Tags: Source
- Uploaded using Trusted Publishing? No
- Uploaded via: twine/0.0.0 importlib_metadata/4.10.0 pkginfo/1.8.2 requests/2.26.0 requests-toolbelt/0.9.1 tqdm/4.62.3 CPython/3.8.12
File hashes
| Algorithm | Hash digest | |
|---|---|---|
| SHA256 |
244d146502dbe891fd0c182510393f1891ee514585e40b346b9817235d876b4b
|
|
| MD5 |
aa99610b5842add4396b35279b78b815
|
|
| BLAKE2b-256 |
47d44ac6601c457d45af1ab1d7adb02785ea73db6e14db09a8e190c32a8300c6
|
File details
Details for the file XTEC-0.1.1-py3-none-any.whl.
File metadata
- Download URL: XTEC-0.1.1-py3-none-any.whl
- Upload date:
- Size: 18.6 kB
- Tags: Python 3
- Uploaded using Trusted Publishing? No
- Uploaded via: twine/0.0.0 importlib_metadata/4.10.0 pkginfo/1.8.2 requests/2.26.0 requests-toolbelt/0.9.1 tqdm/4.62.3 CPython/3.8.12
File hashes
| Algorithm | Hash digest | |
|---|---|---|
| SHA256 |
6ebc0e29f81d208cd4912950f012e834f92f1f4cc11187f0c809e11a574e2d58
|
|
| MD5 |
923ab28d13983e70b7d3907ca48df4e4
|
|
| BLAKE2b-256 |
f8f2ae205955f198ca072fd3303b0cd674163762076a1228e50a5f92337c2aef
|


