
ZenTables - Stress-Free Descriptive Tables in Python
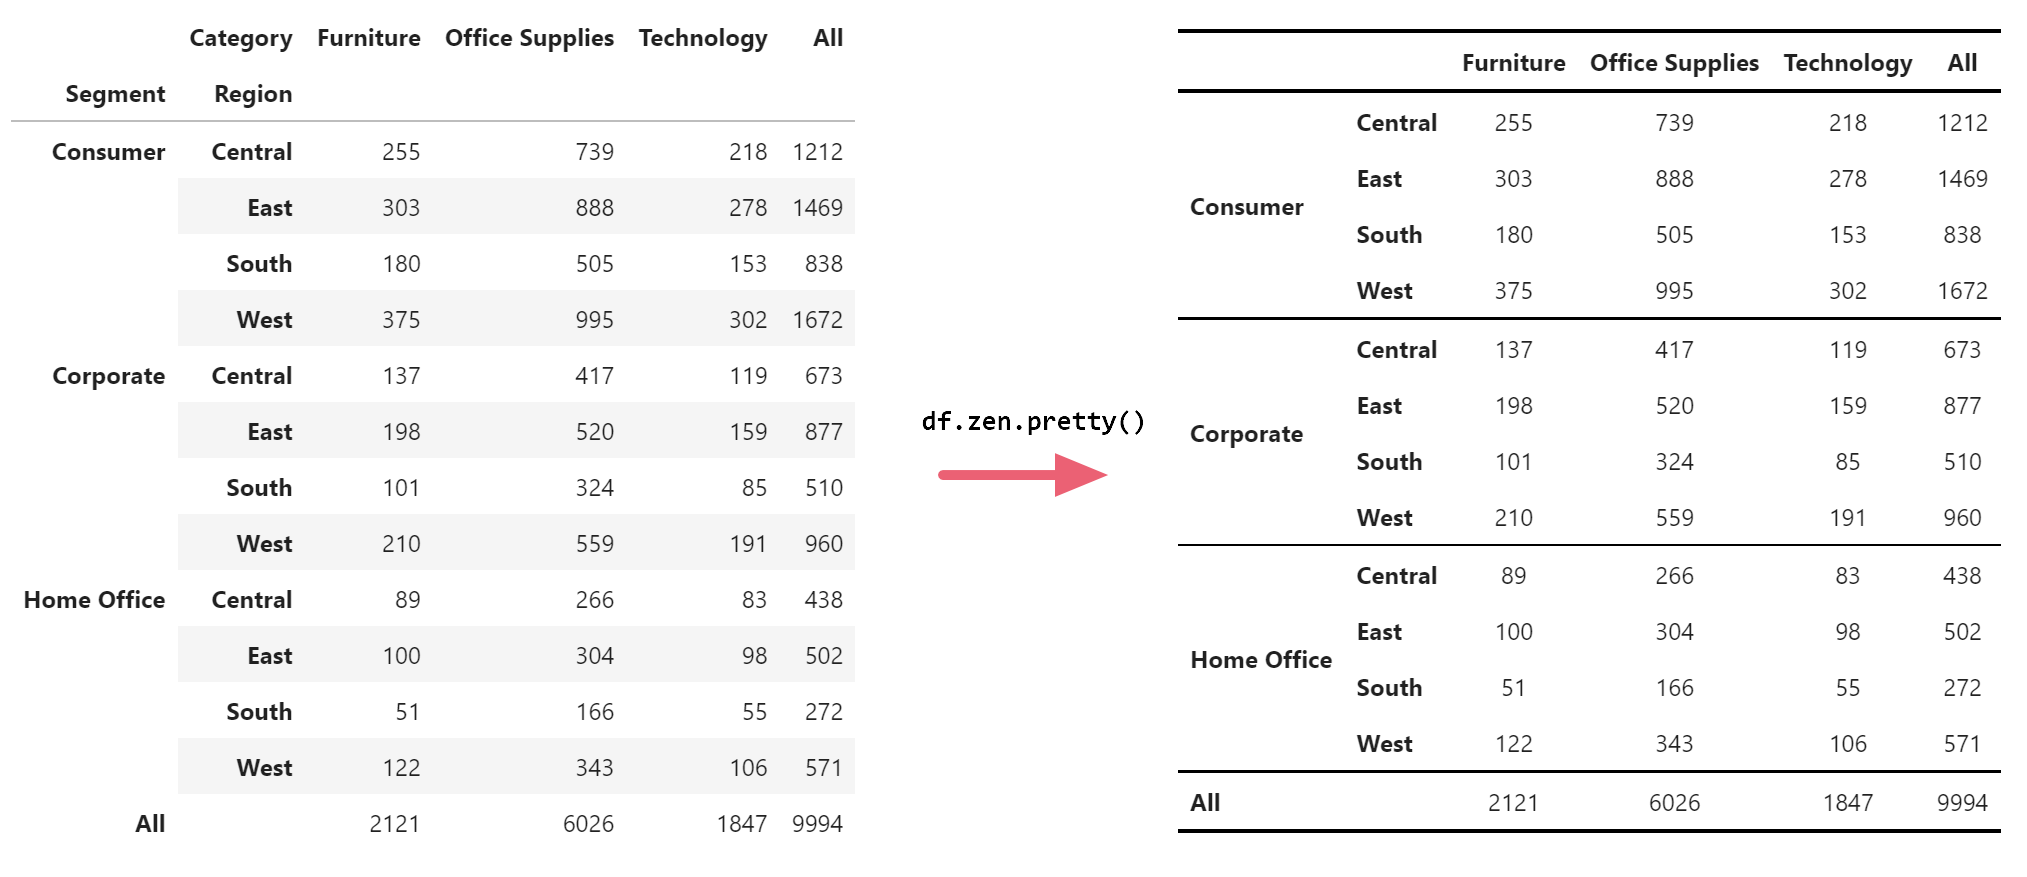
ZenTables transforms your pandas DataFrames into beautiful, publishable tables in one line of code, which you can then transfer into Google Docs and other word processors with one click. Supercharge your workflow when you are writing papers and reports.
import zentables as zen

df.zen.pretty()
Features
- Beautiful tables in one line
- Google Docs/Word ready in one click
- Descriptive statistics at varying levels of aggregation
- Control table aesthetics globally
- and many more to come....
Installation
Via pip from PyPI:
pip install zentables
Via pip from GitHub directly
pip install -U git+https://github.com/thepolicylab/ZenTables
How to use ZenTables
1. How to format any DataFrame
First, import the package alongside pandas:
import pandas as pd
import zentables as zen
Then, to format any DataFrame, simply use:
df.zen.pretty()
And this is the result:
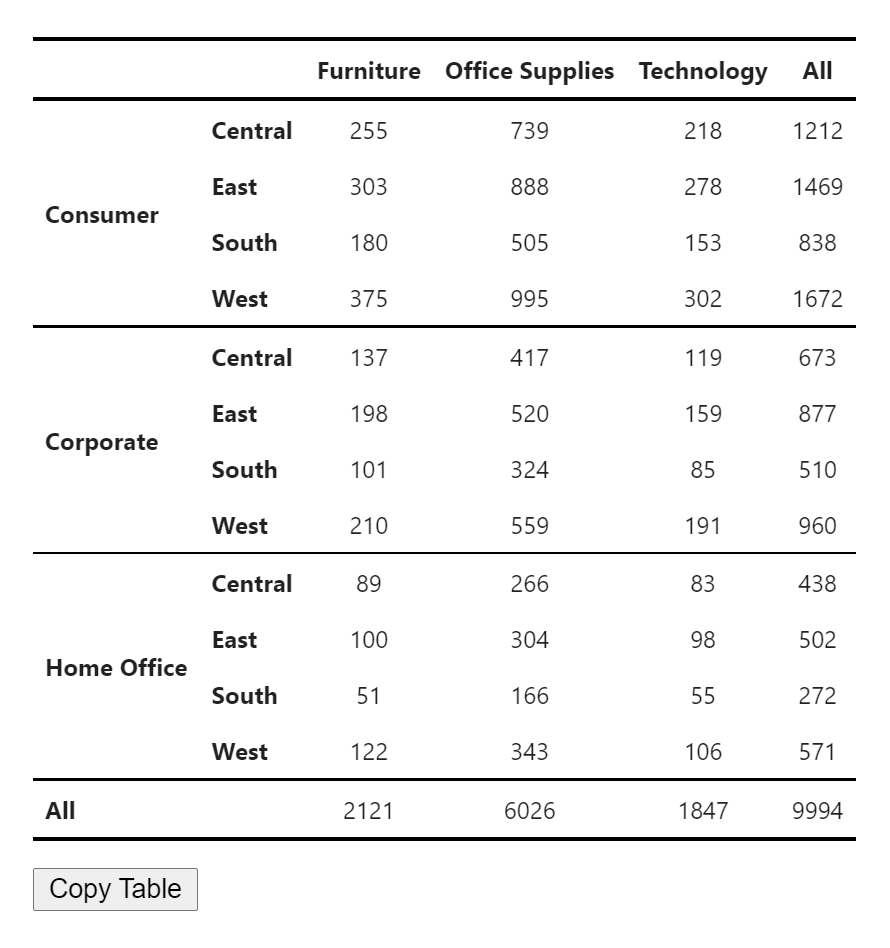
Click on the Copy Table button to transfer the table to Google Docs and Word. Formatting will be preserved.
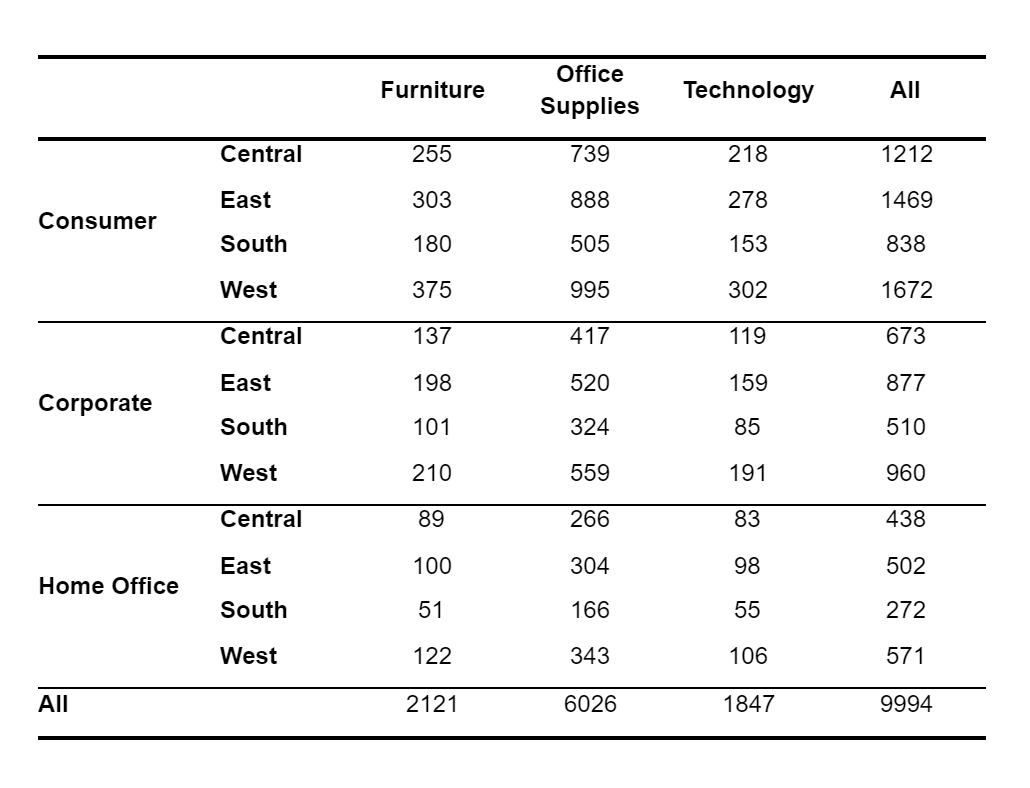
Results in Google Docs (Tested on Chrome, Firefox, and Safari):
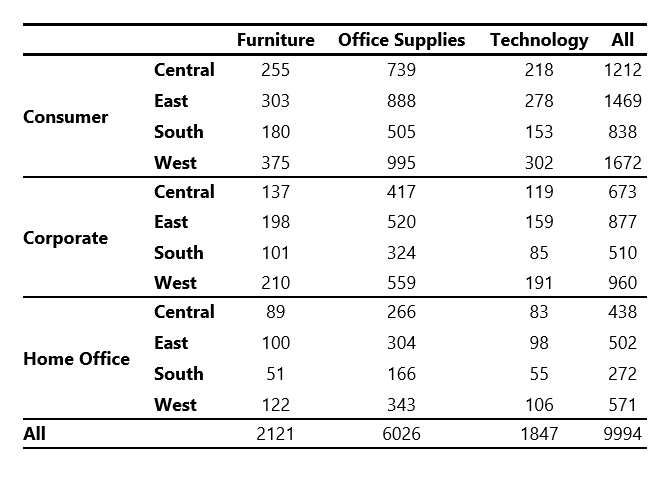
Results in Microsoft Word:
2. How to control my tables' appearance?
ZenTables provides two ways to control the aesthetics of the tables. You can use global settings to control the font and font size of the tables via:
zen.set_options(font_family="Times New Roman, serif", font_size=12)
Note: When font_size is specified as an int, it will be interpreted as points (pt). All other CSS units are accepted as a str.
Or you can override any global options by specifying font_family and font_size in zen.pretty() method:
df.zen.pretty(font_family="Times New Roman, serif", font_size="12pt")
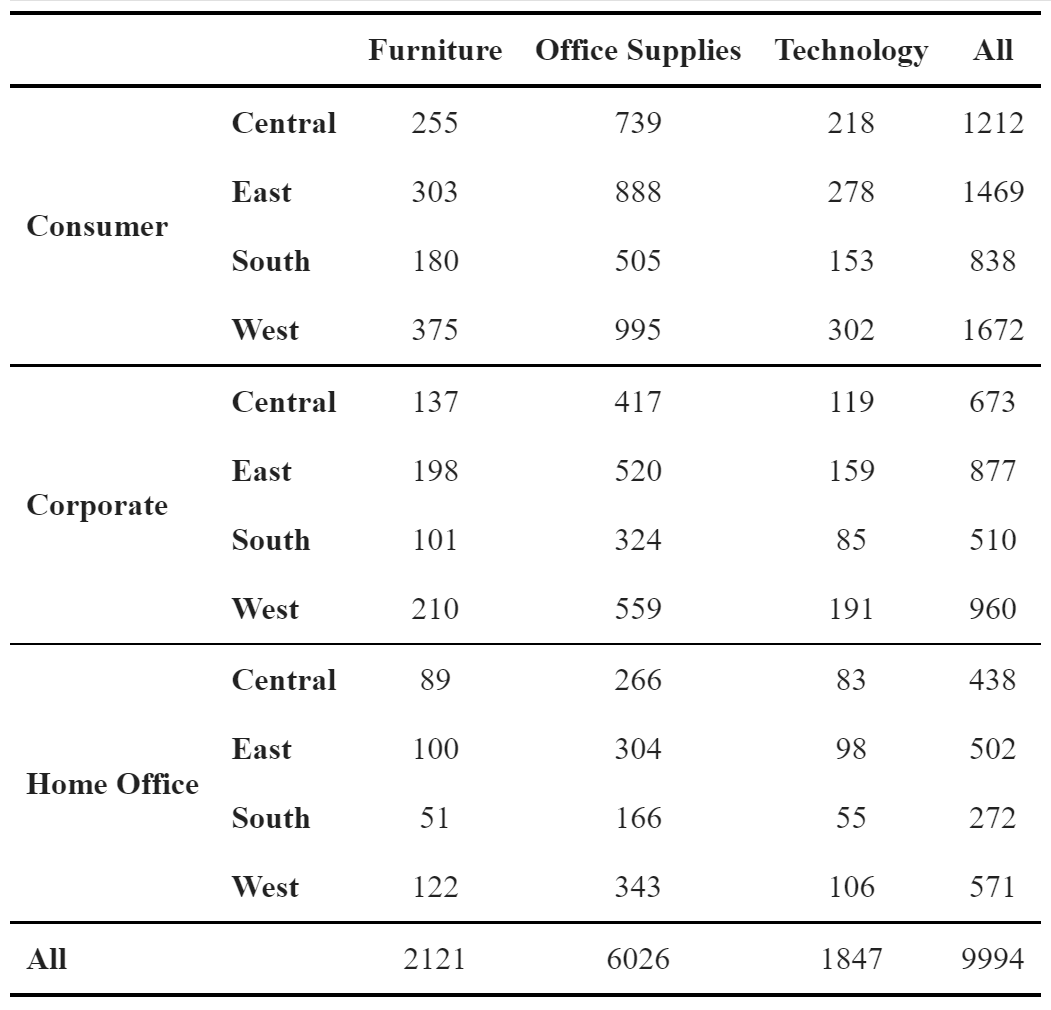
Both will result in a table that looks like this
We are working on adding more customization options in a future release.
3. How to create common descriptive tables using ZenTables?
3.1. Frequency Tables
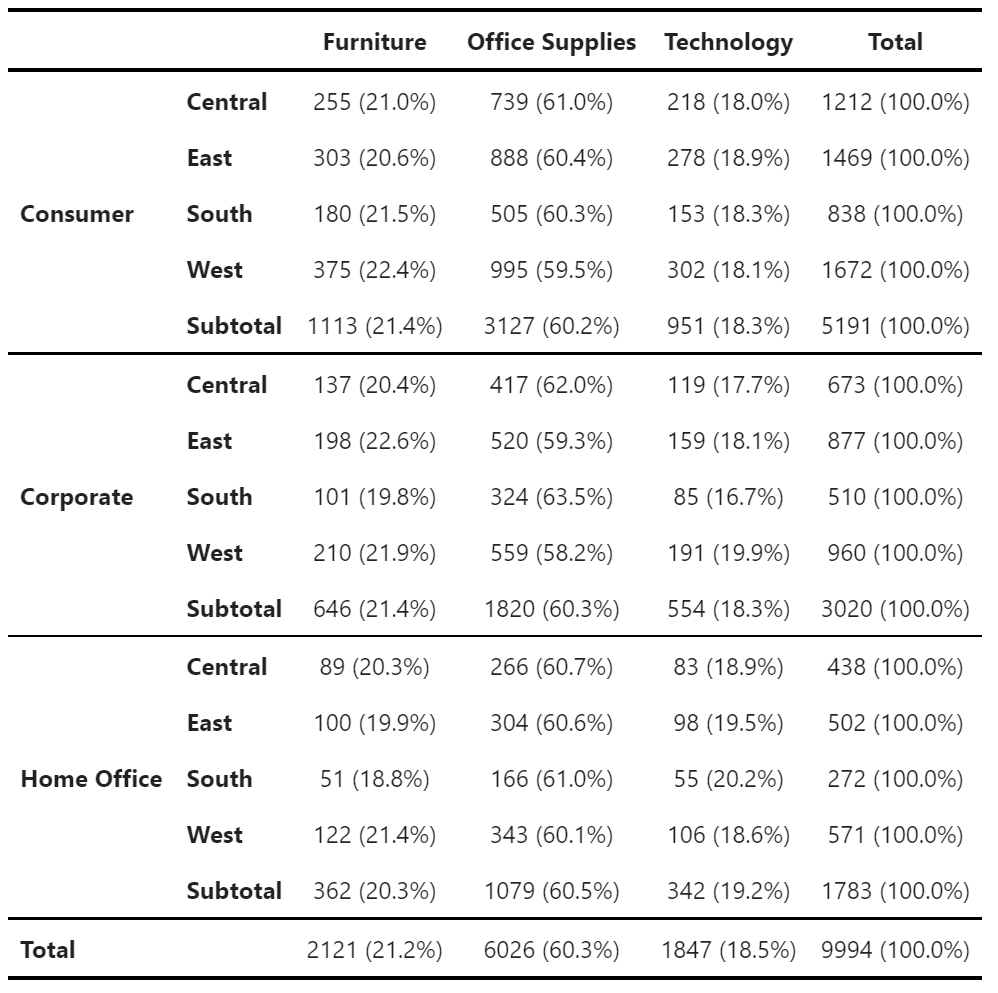
Use df.zen.freq_tables() to create simple frequency tables:
freq_table = df.zen.freq_table(
    index=["Segment", "Region"],
    columns=["Category"],
    values="Order ID",
    props="index",
    totals=True,
    subtotals=True,
    totals_names="Total"
    subtotals_names="Subtotal",
)
freq_table.zen.pretty() # You can also chain the methods
Use props to control whether to add percentages of counts. When props is not set (the default), no percentages will be added. You can also specify props to calculate percentages over "index" (rows), "columns", or "all" (over the totals of the immediate top level).
Use totals and subtotals parameters to specify whether totals and subtotals will be added. Note that when props is not None, both totals and subtotals will be True, and when subtotals is set to True, this will also override totals settings to True.
Additionally, you can control the names of the total and subtotal categories using totals_names and subtotals_names parameters.
3.2. Mean and standard deviation tables
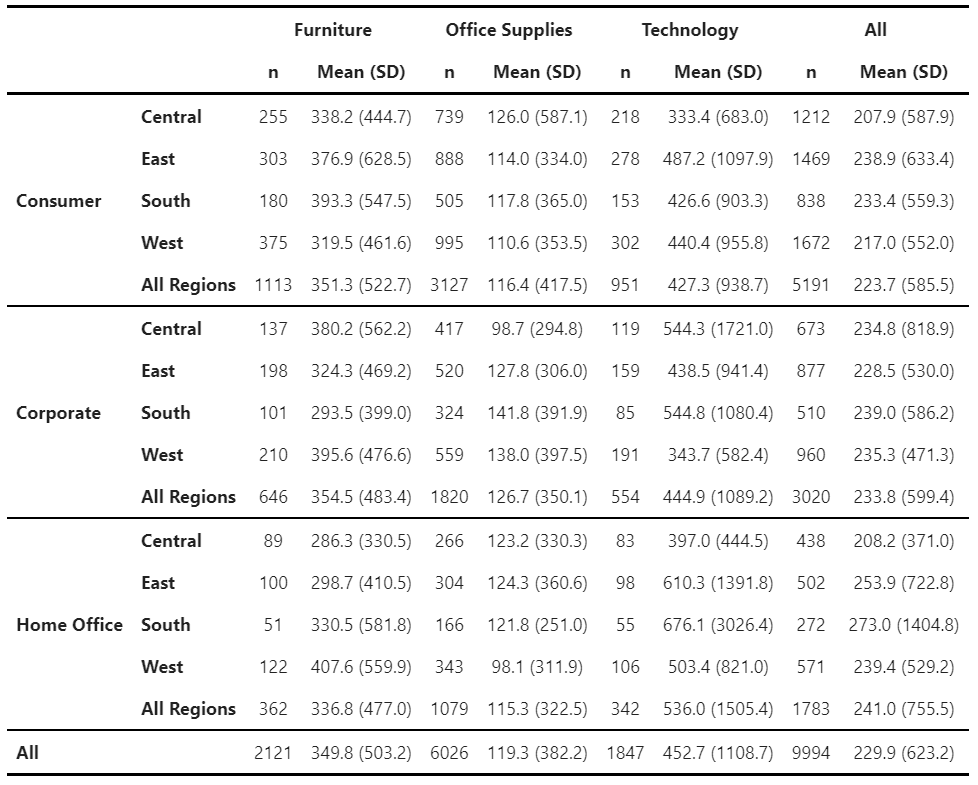
Use df.zen.mean_sd_table() to create descriptives with n, mean, and standard deviation:
mean_sd_table = df.zen.mean_sd_table(
    index=["Segment", "Region"],
    columns=["Category"],
    values="Sales",
    margins=True,
    margins_name="All",
    submargins=True,
    submargins_name="All Regions",
)
mean_sd_table.zen.pretty() # You can also chain the methods
Similar to freq_tables, you can use margins and submargins parameters to specify whether aggregations at the top and intermediate levels will be added. Additionally, you can control the names of the total and subtotal categories using margins_names and submargins_names parameters.
3.3 Other descriptive statistics tables
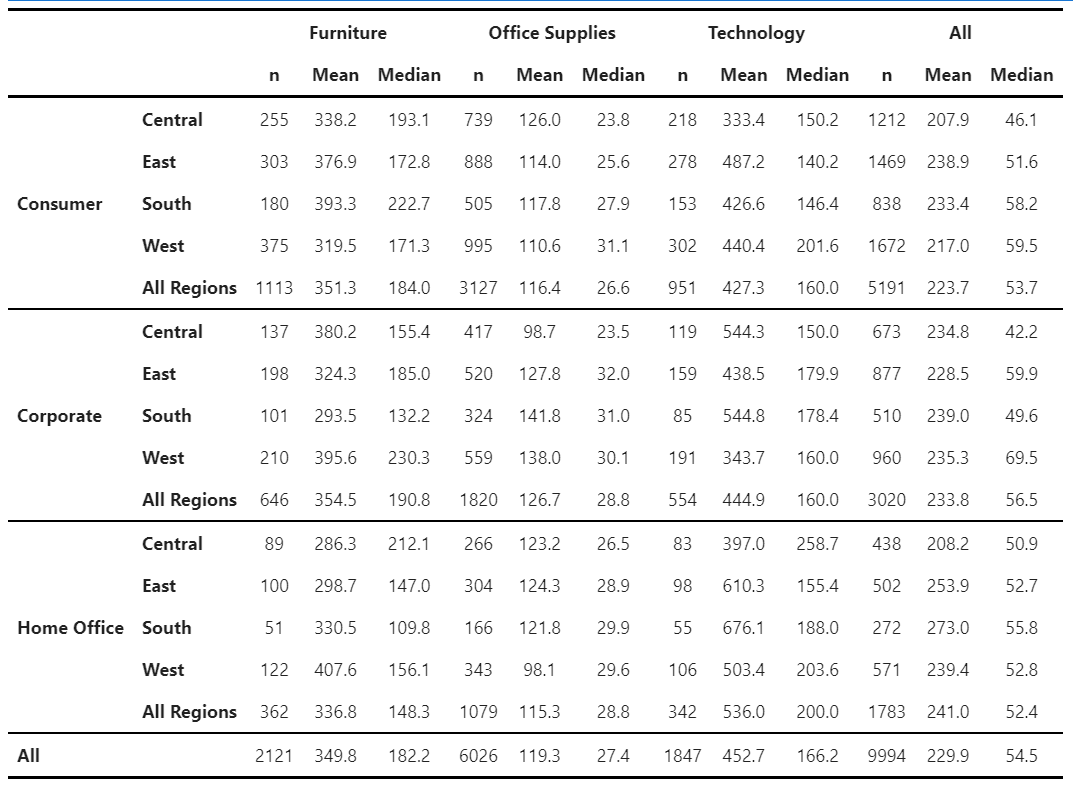
For all other types of tables, ZenTables provides its own df.zen.pivot_table() method:
mean_median_table = df.zen.pivot_table(
    index=["Segment", "Region"],
    columns=["Category"],
    values="Sales",
    aggfunc=["count", "mean", "median"],
    margins=True,
    margins_name="All",
    submargins=True,
    submargins_name="All Regions",
).rename( # rename columns
    columns={
        "count": "n",
        "mean": "Mean",
        "median": "Median",
    }
)
mean_median_table.zen.pretty().format(precision=1) # Specify level of precision
There are two differences between this pivot_table() method and the pandas pivot_table method. First, like mean_sd_table(), it provides submargins and submargins_names for creating intermediate-level aggregations. Second, results are grouped by values, columns, and aggfuncs, instead of aggfuncs, values, and columns. This provides more readability than what the pandas version provides.
4. Tips and tricks
-
df.zen.pretty()returns a subclass ofpandasStyler, which means you can chain all other methods afterdf.style.format()in the previous section is an example. For more formatting options, please see this page inpandasdocumentation -
All other methods in
ZenTablesreturns a regularDataFramethat can be modified further. -
The names of the index and columns are by default hidden. You can get them back by doing this:
df.zen.pretty().show_index_names().show_column_names()
- You can also disable the
Copy Tablebutton like this:
df.zen.pretty().hide_copy_button()
TODO
- More tests on compatibility with
Stylerinpandas - More options for customization
- A theming system
- More to come...
Contributing
Contributions are welcome, and they are greatly appreciated! If you have a new idea for a simple table that we should add, please submit an issue.
Contributors
Principally written by Paul Xu at The Policy Lab. Other contributors:
- Kevin H. Wilson
- Edward Huh
Special thanks
- All the members of The Policy Lab at Brown University for their feedback
- The
sidetablepackage for ideas and inspiration.
1 maintainer

Metadata
1 maintainer
Release files for zentables 0.2.4
For a detailed explanation of source distributions (sdists) and built distributions (wheels), please see the package formats documentation.
Source distribution (sdist)
| File | Size | Uploaded | |
|---|---|---|---|
| ZenTables-0.2.4.tar.gz | 18.6 kB | Details |
Built distribution (wheel)
| File | Interpreter | ABI | Platform | Reset |
|---|---|---|---|---|
| ZenTables-0.2.4-py3-none-any.whl | Python 3 | none | any | Details |
Total release size: 34.6 kB
Release files / ZenTables-0.2.4.tar.gz
| Download URL | ZenTables-0.2.4.tar.gz |
|---|---|
| Size | 18.6 kB |
| Tags | Source |
|
SHA-256 checksum How to use checksums |
da63be1f60fe9983880a228f10d85a808064855404c17dec7af437690ce28de9
|
|
BLAKE2b-256 checksum How to use checksums |
351a1e0ebfe71e1e6464f4f0c52deb3a2407b46967f69ad4e50db35a703e4562
|
| Upload date | |
|
Uploaded using Trusted Publishing? What is trusted publishing? |
No |
| Uploaded via |
poetry/1.1.11 CPython/3.9.6 Windows/10
|
Release files / ZenTables-0.2.4-py3-none-any.whl
| Download URL | ZenTables-0.2.4-py3-none-any.whl |
|---|---|
| Size | 16.0 kB |
| Tags | Python 3 |
|
SHA-256 checksum How to use checksums |
d1a15fa74a1b7275cd951bd61046e3b998b9a265ab4faf575bb859b660d43392
|
|
BLAKE2b-256 checksum How to use checksums |
f4daf94b743b3d01652dac8be5a89401ce1f35cb1c7e2492699744452e621ceb
|
| Upload date | |
|
Uploaded using Trusted Publishing? What is trusted publishing? |
No |
| Uploaded via |
poetry/1.1.11 CPython/3.9.6 Windows/10
|














