
AIDebug









Malware reverse-engineering CLI/TUI with deterministic offline triage, Ghidra reconstruction, optional LLM cross-checks, active local ELF debugging, guided assembly learning in the main full-screen GUI, ATT&CK candidates, YARA seeds, and analyst reports.
Current release: AIDebug v3.0.0. Its PyPI distributions were built from the immutable version-matched tag by the verified publishing workflow.
Project Maturity Evidence
| Area | Evidence |
|---|---|
| Install and package | PyPI package, pyproject.toml, Debian/Kali files in debian/ |
| Usage documentation | Quick start, Learning Mode, analyst workflow, safe examples |
| Safety and scope | Safety model, security policy, limitations |
| Quality checks | CI workflow, unit tests in tests/, package build job |
| Reviewer evidence | sample evidence index, screenshots in assets/screenshots/, mock outputs in examples/mock-output/ |
| Validation | validation plan, deterministic tests for pattern detection and JSON export |
| Maintenance | maintainers, roadmap, changelog, contributing |
| Positioning | comparison, curated-list resubmission plan |
| Release gate | release readiness, scripts/release-readiness.sh |
Curated-list resubmission should wait for additional release history and public usage evidence. This repository now documents the quality bar, but age and adoption still require time.
Published PE Analysis Guide
The companion article PE File Structure for Malware Analysis: A Practical Guide uses AIDebug to walk through PE headers, sections, imports, exports, resources, relocations, TLS callbacks, unwind data, mitigations, Authenticode, debug data, overlays, and managed .NET metadata. Use it as the guided analyst workflow for the Hex / PE workspace described below.
Screenshots
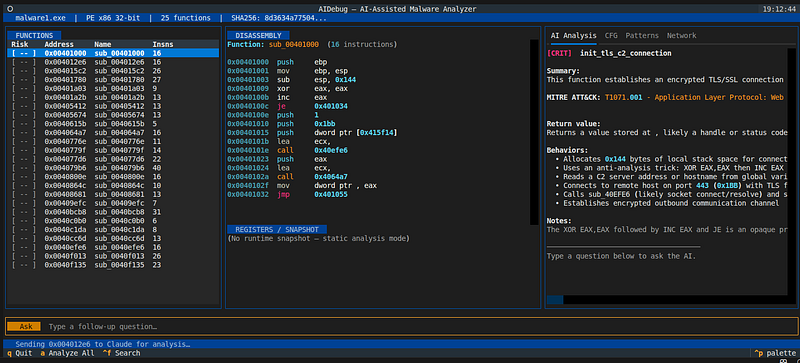
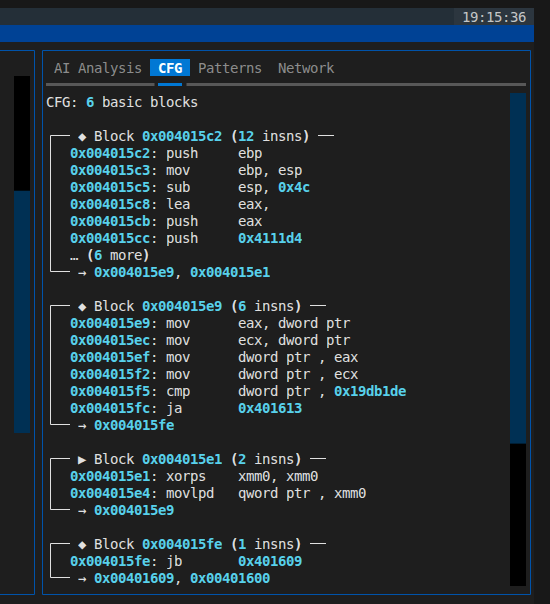
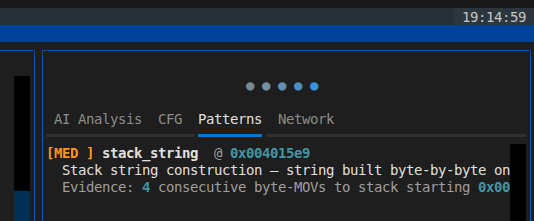
These are illustrative captures associated with the companion walkthrough article; they are not automated accuracy evidence. See the capture provenance and checksums.
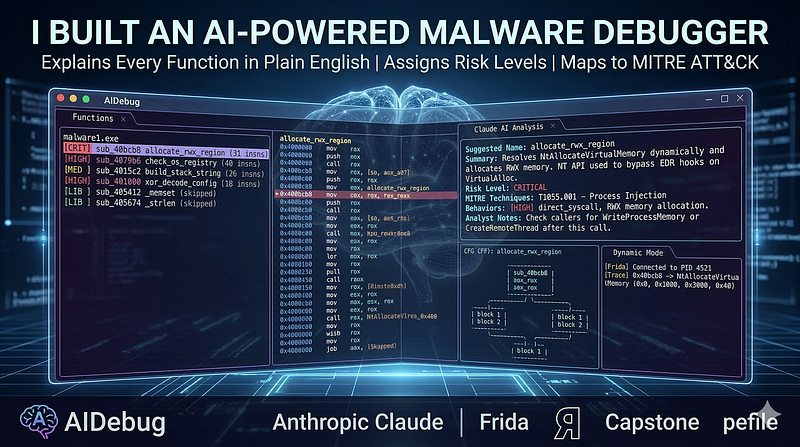
| Behavioral patterns | Control flow graph |
|---|---|
 |
 |
| Pattern detection output | Four-panel TUI |
|---|---|
 |
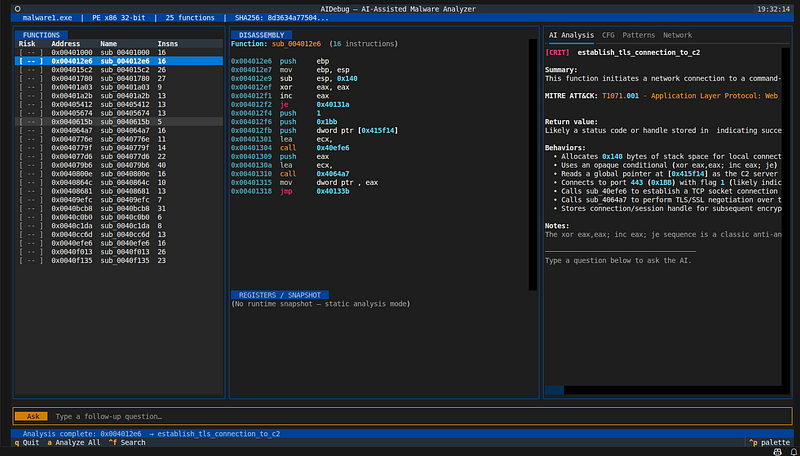 |
What This Is For
A malware analyst runs AIDebug when a sample needs fast triage before deeper reverse engineering. The goal is not magic attribution. The goal is structured behavior, technique hypotheses, and review-ready seed material.
What It Produces
| Output | Use |
|---|---|
| HTML report | Analyst review and case notes |
| Versioned JSON report | Custom SIEM/SOAR adapter input; no vendor-native or STIX schema is claimed |
| YARA candidate rules | Detection-engineering seed that must be compiled and tested |
| Heuristic IOC strings in JSON | Analyst-reviewed pivot candidates, not a standalone IOC feed |
| CFG visualization | Function-level behavior review |
| Hex / PE workspace | Read-only whole-file hex for every loaded binary; PE files additionally show native headers/directories, managed .NET/CLR metadata, imports, exports, signatures, and overlays |
| Ghidra C-like decompilation | Native-code reconstruction for function triage; not recovered original source |
| Full reconstruction file | One provenance-marked C-like file for every discovered function |
| LLM decompilation cross-check | Assembly-grounded consistency/uncertainty review for AI-analyzed functions |
| Active ELF debugger | GDB breakpoints, stepping, registers/deltas, and function I/O candidates |
| Live Learning Mode | Main-GUI exploration of 100 standalone C cases or a validated external collection, with real compiler output, AIDebug disassembly, and Ghidra reconstruction |
| Hash-indexed analysis history | Local recovery of prior sessions and compatible AI findings when the same SHA-256 is opened again |
| Remote-AI ATT&CK candidate | Technique-level hypothesis for analyst validation |
Quick Start
Current source checkout
git clone https://github.com/anpa1200/AIDebug.git
cd AIDebug
python3 -m venv .venv
source .venv/bin/activate
pip install -e .
aidebug --help
aidebug --version
aidebug --binary /path/to/sample --offline --no-tui --json-export --out-dir reports/
ELF binaries use the same static-analysis command as PE files:
aidebug --binary /path/to/sample.elf --offline --no-tui
Hex viewer and PE Structure workspace
Open a supported binary in the main GUI, then press X:
aidebug --binary /path/to/sample.exe --offline
aidebug --binary /path/to/sample.elf --offline
Every loaded binary receives a whole-file Hex view plus file metadata. When the
file is PE32 or PE32+, AIDebug automatically opens the richer PE workspace with
Overview, Hex, Headers, Sections, Directories, Imports, and Exports tabs. The
header view includes the DOS header, NT signature, COFF file header, and
optional header. The raw COFF Characteristics bitmask is preserved and each
set flag is decoded by name, including executable, DLL, system, relocation,
32-bit-machine, and large-address-aware flags. Optional-header
DllCharacteristics flags are also decoded, with cautious mitigation clues for
ASLR, high-entropy VA, DEP/NX, CFG, integrity checks, AppContainer, and SEH.
The Sections tab exposes every field in each 40-byte IMAGE_SECTION_HEADER,
including relocation and line-number pointers/counts, and decodes content,
linker, alignment, and memory-permission flags. The Resources workspace keeps
the optional-header directory table and expands the resource directory as a
navigable, bounded type → name/ID → language → data-file explorer. It displays
every parsed IMAGE_RESOURCE_DIRECTORY header and
IMAGE_RESOURCE_DATA_ENTRY, including
file offsets, RVA, declared and available sizes, code page, reserved value,
SHA-256 of complete payloads, safe byte previews, and explicit malformed-range
or traversal-limit warnings. Known numeric resource types are labelled by name.
Select a resource file and press Enter to open its complete bytes in AIDebug's
read-only, paged hex/text viewer; the payload is never launched. Press D to
download/export it with owner-only permissions under
./aidebug-resource-exports/<sample-hash>/. Existing files and symlinked output
directories are refused rather than overwritten or followed.
The same Directories explorer includes every parsed IMAGE_BASE_RELOCATION
block and pages through its relocation entries with file offset, type, offset
within the 4 KiB page, target RVA, mapped VA, and decoded relocation-type name.
Its ASLR assessment correlates DYNAMIC_BASE, HIGH_ENTROPY_VA,
RELOCS_STRIPPED, the base-relocation directory, and usable non-ABSOLUTE
entries. The result describes structural ASLR compatibility and explicitly does
not claim that a particular process was randomized at runtime.
The TLS branch exposes every field in IMAGE_TLS_DIRECTORY32 or
IMAGE_TLS_DIRECTORY64, maps the template-data, index, and callback-table VAs
back to RVAs and file offsets, hashes complete TLS template data, and provides a
safe preview. Each bounded callback-table entry includes its pointer-entry file
offset and callback VA/RVA/file offset, plus evidence of the terminating null
pointer. The interface highlights that TLS callbacks may execute before the
normal PE entry point and reports malformed, unmapped, or truncated tables.
For x64 PE files, the Exceptions & unwind branch groups the .pdata
RUNTIME_FUNCTION table into lazy 250-record folders and decodes the referenced
UNWIND_INFO. It shows function RVA/VA ranges, unwind-data and file offsets,
version and handler flags, prologue size, frame register/offset, each UWOP_*
operation and its operands, exception or termination-handler metadata,
language-specific-data location, and chained runtime functions. Invalid ranges,
unexpected versions, truncated code arrays, and unmapped handler data are
reported as evidence rather than silently ignored.
The Load configuration & mitigations branch preserves every field exposed by
the versioned IMAGE_LOAD_CONFIG_DIRECTORY32/64, including field offsets and
sizes, and maps known VA pointer fields back to RVAs and file offsets. It fully
decodes GuardFlags and correlates load-config metadata with Optional Header
and relocation evidence for ASLR, high-entropy ASLR, DEP/NX, CFG, stack cookies,
SafeSEH applicability, Return Flow Guard, EH continuation protection, XFG,
retpoline, code integrity, and AppContainer. Findings distinguish “present,”
“declared,” “not indicated,” and inconsistent/partial evidence; static metadata
is never presented as proof of effective runtime policy.
Its nested CFG evidence view correlates the Optional Header GUARD_CF bit with
CF_INSTRUMENTED, CFW_INSTRUMENTED, and CF_FUNCTION_TABLE_PRESENT; maps the
check/dispatch pointer slots and GuardCFFunctionTable; and safely parses the
complete bounded GFIDS target table. It derives the 4 + n record stride from
the high GuardFlags nibble, maps every target RVA to its VA and file offset,
decodes suppressed/export-suppressed metadata, verifies strict ordering and
uniqueness, and reports partial, truncated, unmapped, or contradictory evidence.
The Authenticode certificates & signatures branch treats the Security Directory
address correctly as a file offset, walks every quadword-aligned
WIN_CERTIFICATE, and decodes revision/type fields, PKCS#7 signer records,
signing and countersignature times, nested-signature counts, and embedded X.509
certificate subjects, issuers, serials, validity periods, fingerprints,
algorithms, and CA status. For Authenticode SignedData it extracts the embedded
SPC digest, independently calculates the PE image digest while excluding the
checksum and certificate metadata, and reports match/mismatch/unavailable as
separate evidence. It also verifies each signer's signed-content digest and
supported RSA/ECDSA/DSA PKCS#7 signature using the matched embedded certificate.
These cryptographic checks are explicitly not presented as Windows root trust,
revocation, or timestamp-authority validation. Every complete bCertificate
blob can be opened in the bounded viewer or safely exported without overwrite.
The Rich header branch searches only the bounded DOS-stub region before the PE
signature, verifies the XOR-decoded DanS marker and padding, preserves the raw
XOR key/checksum, and decodes each product ID, build number, and use count. Rich
metadata is explicitly presented as a compiler/linker clue: it is undocumented,
may be absent, and can be copied or forged, so it is not treated as attribution.
The Debug data & CodeView branch parses each 28-byte
IMAGE_DEBUG_DIRECTORY record with its characteristics, timestamp, version,
type, declared payload size, payload RVA, and payload file offset. Complete
payloads receive a SHA-256 digest and can be opened in the paged viewer or
exported safely. For CodeView RSDS records, AIDebug decodes the PDB signature
GUID using Windows GUID byte order, the PDB age, and the bounded, untrusted PDB
path; legacy NB10 records expose their age and path as well. Malformed,
unmapped, unterminated, oversized, and truncated records remain visible with
explicit warnings instead of being silently accepted.
Overlay evidence now includes the exact file offset and size, SHA-256, entropy,
and a bounded preview. Press Enter to inspect every trailing byte or D to
export the exact range under ./aidebug-overlay-exports/<sample-hash>/ with
owner-only permissions and no overwrite. An overlay may be a certificate table,
installer payload, configuration, or malicious content; its presence alone is
not classified as malicious.
The .NET / CLR assembly branch recognizes the Optional Header COM Descriptor
and parses the complete bounded IMAGE_COR20_HEADER: runtime version, CLR
flags, managed-token or native-RVA entry point, metadata, managed resources,
strong-name signature, code-manager table, VTable fixups, export jumps, and
managed-native-header directories. It decodes ILONLY, 32-bit-required/
preferred, IL-library, strong-name-signed, native-entry-point, and debug-tracking
flags while preserving unknown bits.
AIDebug validates the BSJB metadata root and enumerates #~/#-, #Strings,
#US, #GUID, #Blob, #Pdb, and nonstandard streams with exact offsets,
sizes, completeness, SHA-256, and bounded previews. The tables stream exposes
every present ECMA-335 table with row count, calculated row size, and file
offset. Module and Assembly rows provide the managed module name, assembly
name/version/culture/flags/hash algorithm; AssemblyRef rows become navigable
dependency records. Complete stream bytes open with Enter and export with D
under ./aidebug-dotnet-exports/<sample-hash>/. Strong-name presence is shown
as identity/integrity metadata, not publisher trust, and declared dependencies
are not presented as proof of runtime loading. The CLR is never initialized and
no managed code executes.
The Import descriptors tab
shows every standard 20-byte IMAGE_IMPORT_DESCRIPTOR, including INT and IAT
RVAs, timestamp, forwarder chain, DLL-name RVA, file offset, and confirmed
all-zero terminator evidence. The same paged workspace shows complete 32-byte
IMAGE_DELAYLOAD_DESCRIPTOR records, distinguishes RVA-based and legacy
VA-based forms, preserves reserved attribute bits, and confirms the all-zero
terminator. Imports include normal and delay-loaded function entries; exports
include ordinals and forwarders. Overlay offset and size are reported when
extra data follows the mapped image. P remains an additional shortcut for
analysts accustomed to opening PE Structure directly.
The Hex tab covers every byte of the exact file content AIDebug hashed. It uses
4 KiB pages instead of creating one unbounded terminal document: use
PageUp/PageDown to move, and Home/End to jump to the first or last page.
Imports and exports are likewise paged for responsive navigation. Press
Escape to return to function analysis. This workspace is offline and
read-only: it does not execute the PE or reopen its source path.
Add bounded Ghidra decompiler output to the CLI, TUI, HTML, and JSON with
--decompile. Install Ghidra first, or provide its headless launcher explicitly:
aidebug --binary /path/to/sample.elf --offline --no-tui --decompile
aidebug --binary /path/to/sample.exe --offline --no-tui --decompile \
  --ghidra-headless /opt/ghidra/support/analyzeHeadless
Reconstruct every discovered function into one file:
aidebug --binary /path/to/sample.elf --offline --no-tui \
  --decompile-all case/sample-full.c
The destination must not already exist. The combined file is created with owner-only permissions and begins with input hash, architecture, backend, and non-original-source warnings. Discovery remains bounded to 300 functions; “all” means every function AIDebug discovered within that explicit safety ceiling.
AIDebug discovers analyzeHeadless from PATH, common installation locations,
or AIDEBUG_GHIDRA_HEADLESS. It runs one isolated temporary Ghidra project and
uses Ghidra's native-code decompiler. The C-like result is reconstructed output,
not original source: inferred types, names, expressions, and structure still
require analyst review. AIDebug fails clearly when Ghidra is unavailable; it
does not substitute register-to-text heuristics and call that decompilation.
When remote AI is enabled and a function has Ghidra output, the same bounded AI
request compares that reconstruction with the supplied disassembly, calls,
strings, patterns, and optional runtime state. The result is labelled
CONSISTENT, PARTIAL, or CONTRADICTED with confidence and evidence. This is
an LLM cross-check, not proof of source correctness. Offline mode reports that
the available reconstruction was not remotely cross-checked.
Active local ELF debugging
GDB-backed active mode executes the selected program. Use it only inside an isolated analysis VM:
aidebug --binary ./sample.elf --mode debug --breakpoint main
Available commands are break LOCATION, continue, step, next, finish,
registers, changes, io, disassemble, and quit. step and next operate
at instruction granularity. io reports calling-convention register candidates
and a GDB return value or explicitly labelled ABI return-register candidate.
Use repeatable --debug-arg values for target arguments and repeatable
--debug-command values for non-interactive lab automation. Active mode
currently supports local ELF targets; use Frida dynamic mode for remote or
Windows targets. GDB is a system dependency rather than a Python package.
Learning mode
Learning Mode is integrated into AIDebug's original full-screen GUI. It is not a simulated instruction viewer: every lesson is backed by a standalone C file, a real temporary x86-64 ELF build, complete symbol disassembly, and Ghidra pseudo-code recovered from that build.
Learning Mode runs locally, does not open the session database, never sends content to an AI provider, and never executes the compiled lesson artifact.
Launch the GUI
Open the complete 100-case catalog:
aidebug --learn
Open the full catalog and immediately analyze a specific case:
aidebug --learn mov-load
aidebug --learn lea-arithmetic
aidebug --learn movsxd
aidebug --learn xchg
aidebug --learn subtract
aidebug --learn binary-search
Search by title, category, instruction, or concept to open a filtered catalog:
aidebug --learn "data movement"
aidebug --learn "loops and arrays"
An exact lesson ID keeps the entire catalog available and preselects that case. A broader search opens only matching cases.
Main GUI layout
| GUI area | Evidence shown |
|---|---|
| Learning Cases | Search result or all 100 standalone cases, with ID, category, and lesson title |
| Real Disassembly | Actual function address, instruction bytes, and compiler-generated assembly |
| Original C Source | Exact contents and repository path of the selected lesson file |
| Pseudo-code tab | Ghidra's independent C-like reconstruction from the generated ELF |
| Lesson tab | Meaning, register/flag effects, analyst clue, and common misreading |
| Build Evidence tab | Function, ELF address, compiler identity, artifact SHA-256, and execution-safety statement |
| Help tab | The live learning workflow and interpretation caveats |
Controls
| Key | Action |
|---|---|
| Arrow keys | Navigate the focused case table or scroll the focused evidence pane |
| Enter | Compile and analyze the selected case |
| Tab / Shift+Tab | Move focus between GUI controls |
| R | Recompile and reanalyze the current case |
| Q | Quit Learning Mode |
Analyzed results are cached only for the current GUI session. Returning to a
case reloads its cached result; press R when you want fresh compiler and
Ghidra output.
External collections
Open a directory of standalone external C lessons in the same GUI:
aidebug --learn --learning-collection /path/to/my-cases
aidebug --learn external-add --learning-collection /path/to/my-cases
The directory must contain case_common.h and one or more .c files. Each
file ID such as external-add.c must define a matching public function such as
learn_external_add(...). An optional collection.json controls ordering and
lesson metadata; learning/cases/ is a complete 100-case
reference collection that can also be loaded externally:
aidebug --learn --learning-collection ./learning/cases
AIDebug rejects absolute or escaping manifest paths, duplicate/invalid IDs, oversized files, non-UTF-8 input, and missing expected symbols. The generated ELF is never executed, but the local compiler still parses the supplied source; review external collections before loading them.
Evidence pipeline and safety
Every lesson is a separate file under learning/cases/.
When a case is selected, AIDebug:
- copies only that bundled C file and
case_common.hto a temporary directory; - compiles it into an x86-64 ELF shared object without running it;
- resolves the lesson's real symbol and size;
- decodes the complete compiler-generated function, including addresses and instruction bytes;
- asks the same Ghidra backend used by normal analysis to reconstruct pseudo-code from the machine code; and
- removes the temporary build directory when analysis finishes.
The panes show the exact source-file path and contents, compiler identity, artifact SHA-256, symbol address, real assembly, Ghidra output, and the non-original-source warning. There is no handwritten pseudo-code fallback. Compiler versions and optimization behavior may produce different valid instruction sequences, so always compare pseudo-code with the displayed source and assembly.
Text-only mode
For terminal output, scripts, or CI, add --no-tui:
aidebug --learn --no-tui
aidebug --learn movsxd --no-tui
Without a topic, text mode prints the catalog. An exact lesson ID compiles and analyzes that one case. A broader query prints matching catalog entries.
Requirements and toolchain overrides
Live cases require:
- an x86-64 ELF-capable
cc,gcc, orclang; - Ghidra's
analyzeHeadless; and - a terminal supported by Textual for the full-screen interface.
Override compiler or Ghidra discovery when necessary:
aidebug --learn switch-dispatch \
  --learning-compiler /usr/bin/gcc \
  --ghidra-headless /opt/ghidra/support/analyzeHeadless
C source analysis requires an ELF-capable cc, gcc, or clang plus
Bubblewrap (bwrap). AIDebug copies the selected translation unit into a
filesystem-isolated build directory, compiles a temporary ELF shared object,
analyzes it, and deletes it without execution:
aidebug --source /path/to/sample.c --offline --no-tui
On Ubuntu 24.04, AppArmor may block Bubblewrap with setting up uid map: Permission denied when the system lacks a Bubblewrap user-namespace profile.
Install and load the upstream bwrap-userns-restrict AppArmor profile rather
than disabling kernel.apparmor_restrict_unprivileged_userns globally. See the
Ubuntu 24.04 user-namespace guidance.
The C workflow accepts one .c translation unit up to 2 MiB. System headers
are available, but project-local headers and multi-file builds are not yet
supported. Dynamic mode and YARA generation are deliberately unavailable for
source inputs because their evidence comes from a temporary compiled surrogate.
The base source installation supports deterministic offline analysis. After the
next release, the PyPI distribution remains 1200km-aidebug and the command is
aidebug.
AI-assisted analysis is an optional extra with four provider paths: Anthropic, OpenAI, Google Gemini, and a local Ollama server. Install the adapters and make a private configuration file:
pip install -e ".[ai]"
cp .env.example .env
chmod 600 .env
Keep AIDEBUG_LLM_PROVIDER=auto and uncomment exactly one credential in
.env. AIDebug selects the only configured provider:
# Anthropic
ANTHROPIC_API_KEY=replace_with_your_key

# OpenAI
# OPENAI_API_KEY=replace_with_your_key

# Google Gemini
# GEMINI_API_KEY=replace_with_your_key

# Local Ollama (no cloud API key)
# OLLAMA_BASE_URL=http://127.0.0.1:11434/v1
Then start AIDebug normally:
aidebug --binary /path/to/sample
Do not paste API keys into screenshots, shell history, issue reports, or chat.
Revoke an exposed key in the Anthropic Console before creating a replacement.
The .env file is ignored by Git; .env.example contains placeholders only.
Operating-system environment variables override .env. When more than one
credential is configured, set AIDEBUG_LLM_PROVIDER explicitly to
anthropic, openai, gemini, or ollama so evidence is never silently sent
to the wrong backend.
Provider defaults are claude-opus-4-8, gpt-5.6-terra,
gemini-3.6-flash, and qwen3:8b respectively. Override only the selected
provider with AIDEBUG_ANTHROPIC_MODEL, AIDEBUG_OPENAI_MODEL,
AIDEBUG_GEMINI_MODEL, or AIDEBUG_OLLAMA_MODEL. The legacy
AIDEBUG_AI_MODEL variable remains a global override.
For Ollama, pull and serve the configured model before starting AIDebug:
ollama pull qwen3:8b
ollama serve
Ollama evidence stays on the configured local endpoint and does not require
--accept-ai-cost; remote bulk analysis still requires that acknowledgement.
Use AIDEBUG_ENV_FILE=/absolute/path/to/private.env when the configuration is
stored outside the repository. AIDebug deliberately does not auto-load .env
from the current working directory because malware-analysis directories are
untrusted.
The ai extra includes both the Anthropic SDK and yara-python: remote YARA
candidates are accepted only after local compilation and broad-rule probes.
Bulk CLI/report analysis with the remote provider also requires the explicit
--accept-ai-cost acknowledgement. Review the remote data
boundary first.
Dynamic Frida instrumentation is optional:
pip install -e ".[dynamic]"
Install both optional capabilities from the checkout with pip install -e ".[all]".
Session storage
The default SQLite database is
$XDG_STATE_HOME/aidebug/traces.db (normally
~/.local/state/aidebug/traces.db) on Linux and below %LOCALAPPDATA% on
Windows. Override it per case with --db /controlled/path/session.db or
AIDEBUG_DB_PATH. Existing repository-local traces.db files are not migrated
automatically.
Every analysis session records the sample SHA-256, mode, analyzer, lifecycle
status, function findings, decompilation, deterministic patterns, and bounded
runtime evidence. When the same bytes are opened again—even from a different
filename or path—AIDebug finds prior sessions by SHA-256. The main GUI adds a
History tab, and compatible stored function analyses are restored without a
second remote-AI request. Separate sessions are retained so a later run never
silently overwrites earlier evidence.
Query the database with either the sample file or its full SHA-256:
aidebug --history /path/to/sample.exe
aidebug --history 0123456789abcdef0123456789abcdef0123456789abcdef0123456789abcdef
The history view lists previous session metadata, evidence counts, risk counts, and stored AI function summaries. Use the displayed session ID to export every persisted field:
aidebug --session 7 --json-export --out-dir reports/
In the main GUI, press Ctrl+H to open hash-matched history. The database and
exports can contain sensitive sample evidence; protect them as case data.
Source checkout with all optional capabilities
git clone https://github.com/anpa1200/AIDebug.git
cd AIDebug
python3 -m venv .venv
source .venv/bin/activate
pip install -e ".[all]"
aidebug --binary /path/to/sample --offline --no-tui --report --json-export --out-dir reports/
Safe Examples
The examples/ directory contains safe, non-malicious demo
material:
examples/toy_xor_config.py- a benign toy XOR loop for documentation.examples/toy_c_analysis.c- a benign C fixture for sandboxed temporary-ELF analysis.learning/cases/- 100 benign, standalone C functions used by the real Learning Mode compile/disassemble/decompile pipeline.examples/mock-output/aidebug-session.json- hand-authored schema-v2 offline session example with an all-zero mock hash.
examples/mock-output/aidebug-candidate.yar- illustrative analyst-review YARA seed.
examples/mock-output/aidebug-report.html- compact illustrative HTML fragment, not a full current generated report.
These examples are not live malware and are intended for documentation, parser tests, and integration demos. They are not execution or accuracy evidence.
How It Works
flowchart LR
  Sample[PE/ELF sample] --> Parse[PE/ELF parsing]
  Parse --> HexView[Read-only whole-file hex]
  Parse --> PEView[Automatic full PE structure presentation]
  Source[C source] --> Compile[Sandboxed temporary ELF compilation]
  Compile --> Parse
  Lesson[Selected learning/cases/*.c] --> LearnCompile[Temporary non-executed x86-64 ELF]
  LearnCompile --> LearnDisasm[Real instruction bytes]
  LearnCompile --> LearnGhidra[Ghidra pseudo-code]
  LearnDisasm --> LearnGUI[Main-GUI Learning Mode]
  LearnGhidra --> LearnGUI
  Parse --> Disasm[Capstone disassembly]
  Disasm --> Ghidra[Ghidra reconstruction]
  Disasm --> Patterns[Malware pattern detection]
  Patterns --> Offline[Offline evidence summary]
  Patterns --> Remote[Optional remote AI hypothesis]
  Ghidra --> Remote
  Remote --> Attack[ATT&CK candidate]
  Offline --> Report[HTML/JSON/YARA candidates]
  Attack --> Report
How AIDebug Feeds Detection Engineering
AIDebug records function-level evidence, produces deterministic pattern summaries offline, and can ask a remote model for explanations and ATT&CK candidates. JSON contains heuristic strings from higher-risk functions for analyst review. It is not STIX, an OpenCTI connector, a vendor-native SIEM integration, or final truth.
Coverage
| Area | Coverage |
|---|---|
| Malware patterns | XOR loops, stack strings, API hashing, RDTSC timing, direct syscalls, NOP sleds, null-safe XOR, Base64 tables |
| Formats | PE32, PE64, ELF, and one-file C source compiled to a temporary ELF |
| File inspection | Main-GUI whole-file hex for loaded binaries; PE files add DOS/NT/optional headers, sections, data directories, imports/delay imports, exports/forwarders, and overlays |
| Architectures | Parser/disassembler paths for x86, x86-64, ARM, AArch64, and RISC-V; coverage varies by format and fixture |
| Dynamic mode | Optional local/remote Frida hooks with readiness/error reporting; operator-managed sandbox/network controls |
| Active debug | Local ELF execution through GDB/MI with analyst-controlled breakpoints and instruction stepping |
| Learning | 100 bundled or externally loaded x86-64 source cases in the main GUI, with exact C, real assembly, build evidence, and Ghidra output |
| Reports | HTML, versioned AIDebug JSON, and YARA candidates |
Safety
Use AIDebug only in an isolated malware-analysis VM or lab. Do not run unknown samples on your host OS. Static analysis can inspect PE/ELF files directly. C inputs are compiled inside a Bubblewrap filesystem sandbox and the generated ELF is never executed. Dynamic mode attaches Frida to a running process or sandbox; active debug mode launches a local ELF through GDB. Both dynamic paths should be used only with authorization and isolation.
Limitations And Honesty
AIDebug accelerates triage. It does not replace manual reverse engineering, sandbox validation, or analyst judgment. Discovery is bounded and can miss indirect, packed, overlaid, stripped, or unreachable code. Heuristic library identification can collide. ATT&CK, risk, IOC, and YARA outputs require review. Dynamic static-to-runtime address mapping can be incomplete under ASLR/PIE. The optional Ghidra integration produces bounded C-like reconstruction from machine code. It is compiler-grade decompiler output, but it is still not recovered original source and must be checked against disassembly and behavior. An LLM cross-check can identify inconsistencies in the bounded evidence it receives, but it cannot prove semantic equivalence or repair missing discovery coverage. Tracer startup reports whether each observer is ready and how many hooks are installed at that moment; a zero count can increase when a watched module loads later and is not evidence that any target call was captured.
Session databases and exports can contain sensitive sample and runtime evidence and are not encrypted by AIDebug. See the safety and privacy model.
Current protective defaults reject binary samples above 128 MiB and C source
above 2 MiB, cap C compilation at 30 seconds, cap discovery at 300
functions and 250 instructions per function, scan at most 100,000 symbols, cap
stored import/export candidates at 50,000 each, cap dynamic instrumentation at 50
function hooks, cap one YARA ruleset at the requested --max-functions value,
and cap persisted API, network, and runtime records at 10,000 per category per
session. These are resource guards, not coverage or retention guarantees.
Generated filenames include the session ID so separate analyses of identically
named samples do not silently overwrite one another in the same output folder.
Companion Article
Community
- Use GitHub Issues for reproducible bugs and feature requests.
- Use GitHub Discussions for workflow questions, integration ideas, and analyst usage patterns.
- Do not upload live malware samples to issues or discussions.
Discovery And Launch Material
Use DISCOVERY.md for canonical links, platform-specific launch
copy, newsletter pitch text, and current external submission tracking.
Citation
See CITATION.cff.
License
MIT.
Security Policy
See SECURITY.md.
1200km Ecosystem
This project is part of the 1200km security research ecosystem. Use AdversaryGraph for CTI-to-detection workflows, ATT&CK/ATLAS mapping, actor relevance, IOC enrichment, and analyst-ready reporting.
1 maintainer

Download files
Download the file for your platform. If you're not sure which to choose, learn more about installing packages.
Source Distribution
Built Distribution
Filter files by name, interpreter, ABI, and platform.
If you're not sure about the file name format, learn more about wheel file names.
Copy a direct link to the current filters
File details
Details for the file 1200km_aidebug-3.0.0.tar.gz.
File metadata
- Download URL: 1200km_aidebug-3.0.0.tar.gz
- Upload date:
- Size: 1.6 MB
- Tags: Source
- Uploaded using Trusted Publishing? Yes
- Uploaded via:
twine/7.0.0 CPython/3.13.14
File hashes
| Algorithm | Hash digest | |
|---|---|---|
| SHA256 |
5f2de4abcb47d64f7bb4c632357973ff20801720808e7f829396d552b417445f
|
|
| MD5 |
219c9f47d5dee628e748198a7636c6eb
|
|
| BLAKE2b-256 |
9f2e8e2f7aa2e4f81ebd2cfeb7d674282bd91b693cee2690f60879c439fc8af1
|
Provenance
The following attestation bundles were made for 1200km_aidebug-3.0.0.tar.gz:
Publisher:
publish.yml on anpa1200/AIDebug
-
Statement:
-
Statement type:
https://in-toto.io/Statement/v1 -
Predicate type:
https://docs.pypi.org/attestations/publish/v1 -
Subject name:
1200km_aidebug-3.0.0.tar.gz -
Subject digest:
5f2de4abcb47d64f7bb4c632357973ff20801720808e7f829396d552b417445f - Sigstore transparency entry: 2411410607
- Sigstore integration time:
-
Permalink:
anpa1200/AIDebug@54fdbf74b5f2e2964f2bb6855a2d25fc8d90c618 -
Branch / Tag:
refs/tags/v3.0.0 - Owner: https://github.com/anpa1200
-
Access:
public
-
Token Issuer:
https://token.actions.githubusercontent.com -
Runner Environment:
github-hosted -
Publication workflow:
publish.yml@54fdbf74b5f2e2964f2bb6855a2d25fc8d90c618 -
Trigger Event:
release
-
Statement type:
File details
Details for the file 1200km_aidebug-3.0.0-py3-none-any.whl.
File metadata
- Download URL: 1200km_aidebug-3.0.0-py3-none-any.whl
- Upload date:
- Size: 237.7 kB
- Tags: Python 3
- Uploaded using Trusted Publishing? Yes
- Uploaded via:
twine/7.0.0 CPython/3.13.14
File hashes
| Algorithm | Hash digest | |
|---|---|---|
| SHA256 |
1073ea0d6ac7101a4b5c36e8eace2f8ed8350c4534bb67c1a4e4dafe8275eb3c
|
|
| MD5 |
9c6fd0ba97ba0706288d22ca70dcc6c8
|
|
| BLAKE2b-256 |
bab403936a3cb590fae856aa747548856962d979afd7ff5228726b3fa81d3c6f
|
Provenance
The following attestation bundles were made for 1200km_aidebug-3.0.0-py3-none-any.whl:
Publisher:
publish.yml on anpa1200/AIDebug
-
Statement:
-
Statement type:
https://in-toto.io/Statement/v1 -
Predicate type:
https://docs.pypi.org/attestations/publish/v1 -
Subject name:
1200km_aidebug-3.0.0-py3-none-any.whl -
Subject digest:
1073ea0d6ac7101a4b5c36e8eace2f8ed8350c4534bb67c1a4e4dafe8275eb3c - Sigstore transparency entry: 2411410711
- Sigstore integration time:
-
Permalink:
anpa1200/AIDebug@54fdbf74b5f2e2964f2bb6855a2d25fc8d90c618 -
Branch / Tag:
refs/tags/v3.0.0 - Owner: https://github.com/anpa1200
-
Access:
public
-
Token Issuer:
https://token.actions.githubusercontent.com -
Runner Environment:
github-hosted -
Publication workflow:
publish.yml@54fdbf74b5f2e2964f2bb6855a2d25fc8d90c618 -
Trigger Event:
release
-
Statement type:







