A library that generalizes the original 2-dimensional CLUE

Project description
CLUEstering — High-Performance Density-Based Weighted Clustering for Heterogeneous Computing


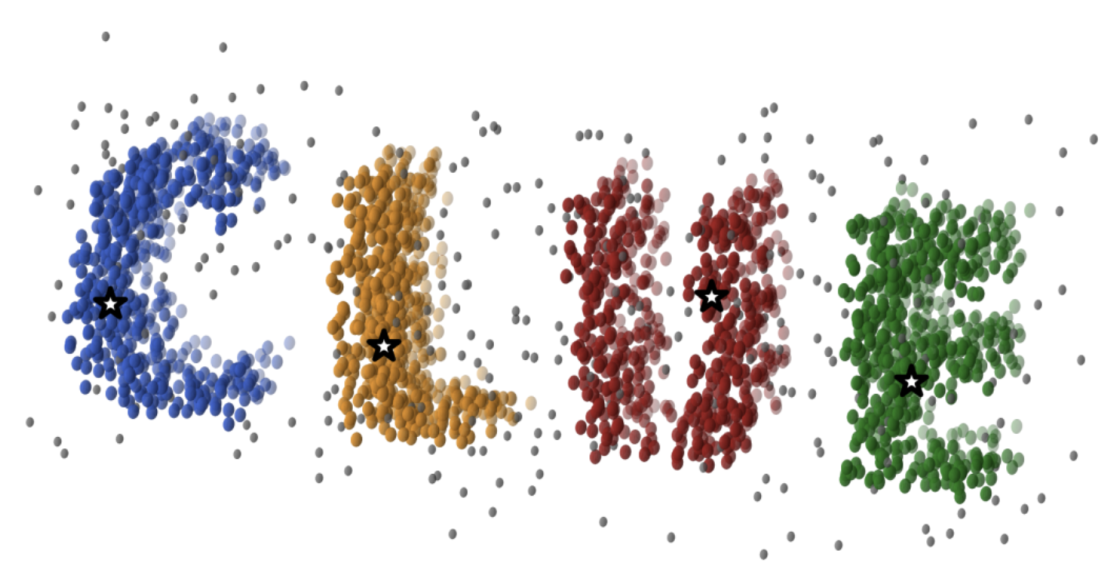
CLUEstering is a general-purpose, density-based, weighted clustering library designed for high-performance scientific computing.
It is written in C++20 and provides both C++ and Python interfaces.
CLUEstering is based on CLUE, a clustering algorithm developed at CERN. CLUE combines the flexibility of density-based clustering with the generality of weighted clustering. Unlike traditional density-based methods, CLUE integrates point weights directly into the computation of local densities—making weights an intrinsic part of the clustering logic rather than an external modifier.
CLUE is also designed for parallel execution, scaling linearly with problem size and performing efficiently on massively parallel architectures such as GPUs and FPGAs.
To maximize hardware portability and performance, CLUEstering’s backend is implemented using alpaka,
a high-efficiency abstraction library for performance portability across CPUs, GPUs, and other accelerators.
Installation
C++ API
CLUEstering can be installed via CMake. It requires a C++20 compliant compiler and CMake 3.16 or higher. To install CLUEstering globally on your system, first clone the repository or download on the the release tarballs from the archive, then install with the following commands:
cd <CLUEstering-folder> && mkdir build
cmake -B build -DCMAKE_INSTALL_PREFIX=/desired/installation/path
cmake --install build
where the installation step may require sudo privileges depending on the chosen installation path.
Then you can link CLUEstering to your project using CMake's find_package:
find_package(CLUEstering REQUIRED)
add_executable(your_target your_source.cpp)
target_link_libraries(your_target PRIVATE CLUEstering::CLUEstering)
target_compile_options(your_target PRIVATE ALPAKA_FLAG)
where the ALPAKA_FLAG is a CMake variable used to specify the desired alpaka backend. For the list of available backends and their corresponding flags,
please look at the subsetion below.
Python API
From PyPi
CLUEstering is available on the PyPi repository, and can be easily installed with:
pip install -v CLUEstering
From source
CLUEstering can also be compiled and installed from source. To do so, first clone the repository
recursively or download one of the release tarballs from archive.
Then, inside the root directory install it using pip:
pip install -v .
where the -v flag is optional but suggested because provides more details during the compilation process.
This will automatically fetch the build dependencies and compile all the supported backends.
Heterogeneous backends support
CLUEstering leverages the alpaka library to provide support for multiple backends without any code duplications.
The table below lists the currently supported backends and the corresponding CMake flags to enable them:
| Backend | CMake Flag |
|---|---|
| Serial | ALPAKA_ACC_CPU_B_SEQ_T_SEQ_ENABLED |
| OpenMP | ALPAKA_ACC_CPU_B_OMP2_T_SEQ_ENABLED |
| TBB | ALPAKA_ACC_CPU_B_TBB_T_SEQ_ENABLED |
| CUDA | ALPAKA_ACC_GPU_CUDA_T_SEQ_ENABLED |
| HIP | ALPAKA_ACC_GPU_HIP_T_SEQ_ENABLED |
For the list of supported compiler versions for each backend, please refer to the alpaka documentation.
Quick example
C++ API
Here is basic example of how to use CLUEstering in C++:
#include <CLUEstering/CLUEstering.hpp>

int main() {
  // Obtain the queue, which is used for allocations and kernel launches.
  auto queue = clue::get_queue(0u);

  // Allocate the points on the host
  clue::PointsHost<2> points = clue::read_csv<2>(queue, "data.csv");

  // Define the parameters for the clustering and construct the clusterer.
  const float distance = 20.f, density_cutoff = 10.f;
  clue::Clusterer<2> clusterer(queue, distance, density_cutoff);

  // Launch the clustering
  // The results will be stored in the `clue::PointsHost` object
  clusterer.make_clusters(queue, points);
  auto clusters_indexes = h_points.clusterIndexes();  // Get the cluster index for each points
  auto clusters = h_points.clusters();                // Get the clusters-to-point associations
}
This example reads a set of 2D points from a CSV file, performs clustering using CLUE, and retrieves the cluster assignments for each point. For more detailed examples and usage instructions, please refer to the documentation.
Python API
Here is a basic example of how to use CLUEstering in Python:
import CLUEstering as clue

clusterer = clue.clusterer(1., 5.)
clusterer.read_data(data)
clusterer.run_clue()
clusterer.cluster_plotter()
clusterer.to_csv('output_folder', 'data_results.csv')
The data can be provided in many different formats, including numpy arrays, pandas DataFrames, and CSV files.
References and citing
- M. Rovere et al., CLUE: A Fast Parallel Clustering Algorithm for High-Density Environments, Front. Big Data (2020)
- S. Balducci, CLUEstering: a high-performance density-based clustering library for scientific computing, UNIBO Master Thesis (2024)
- S. Balducci et al., CLUE: A Scalable Clustering Algorithm for the Data Challenges of Tomorrow, CERN EP newsletter (2025)
- S. Balducci et al., CLUEstering: a novel high-performance clustering library for scientific computing, 23rd International Workshop on Advanced Computing and Analysis Techniques in Physics Research (ACAT 2025)
Release history Release notifications | RSS feed


Download files
Download the file for your platform. If you're not sure which to choose, learn more about installing packages.
Source Distribution
File details
Details for the file cluestering-2.9.0.tar.gz.
File metadata
- Download URL: cluestering-2.9.0.tar.gz
- Upload date:
- Size: 16.0 MB
- Tags: Source
- Uploaded using Trusted Publishing? No
- Uploaded via: twine/6.2.0 CPython/3.13.7
File hashes
| Algorithm | Hash digest | |
|---|---|---|
| SHA256 |
f29c4eee1f770eb3067d4c2bd9d80136ca9535ccbb652a2e405d3be1a992c7e7
|
|
| MD5 |
da465116d0e5aaad4559875307e9b6d6
|
|
| BLAKE2b-256 |
b358201681c5446c229b44a444f5719367a0c9e626b0dcefb1690a37e424a110
|


