A modern, smooth, and dynamic charting library for Python using pure Tkinter

Project description


ChartForgeTK
A powerful and intuitive Python charting library built purely on Tkinter. ChartForgeTK brings modern, interactive data visualization to desktop applications with zero external dependencies.
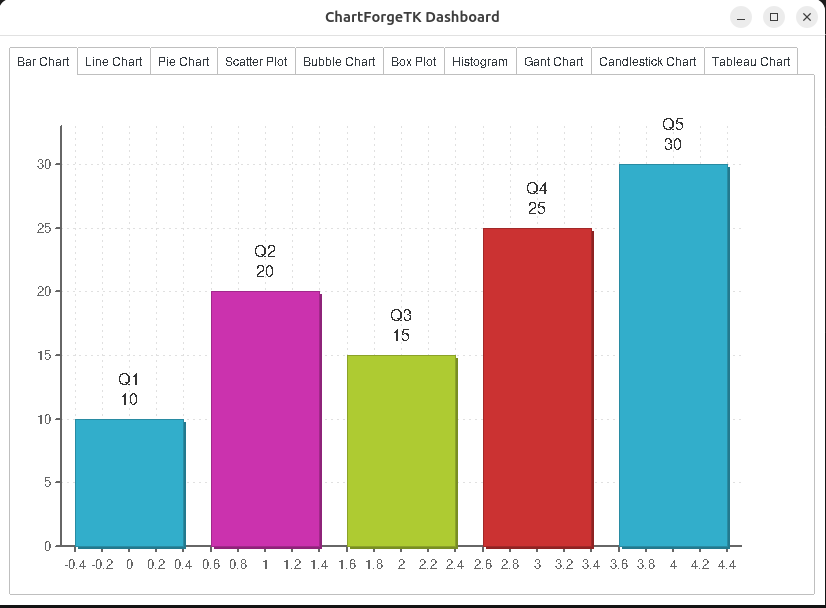
Table of Contents
- Why ChartForgeTK?
- Features
- Installation
- Quick Start
- Chart Types
- Pandas Integration
- API Reference
- Utility Classes
- Customization
- Stability & Reliability
- Examples
- Roadmap
- Contributing
- License
🚀 Why ChartForgeTK?
| Feature | ChartForgeTK |
|---|---|
| Dependencies | Zero external dependencies - pure Tkinter |
| Chart Types | 12+ chart types for any visualization need |
| Customization | Light/Dark themes, flexible sizing |
| Interactivity | Tooltips, hover effects, click events |
| Data Sources | Lists, pandas DataFrames, pandas Series |
| Performance | Lightweight, fast rendering with animations |
| Stability | Comprehensive input validation (v2.0) |
✨ Features
Chart Types
| Chart | Description | Best For |
|---|---|---|
| Bar Chart | Vertical bars with animations | Categorical comparisons |
| Line Chart | Multi-series with markers | Trends, time-series |
| Pie Chart | 2D/3D with slice selection | Proportions |
| Scatter Plot | X-Y coordinate plotting | Correlations |
| Bubble Chart | Scatter with size encoding | 3-variable data |
| Box Plot | Statistical distribution | Outlier detection |
| Histogram | Frequency distribution | Data distribution |
| Gantt Chart | Timeline visualization | Project planning |
| Candlestick | OHLC financial data | Stock analysis |
| Heat Map | Color-coded matrices | Pattern recognition |
| Network Graph | Node-edge visualization | Relationships |
| Tableau Chart | Enhanced data tables | Tabular display |
Interactive Features
- Animated chart rendering with smooth transitions
- Hover tooltips with detailed information
- Click-to-select functionality (pie charts)
- Dynamic data refresh without flickering
- Responsive layouts with auto-resize support
Pandas Integration (New!)
import pandas as pd
from ChartForgeTK import BarChart

df = pd.DataFrame({
    'quarter': ['Q1', 'Q2', 'Q3', 'Q4'],
    'sales': [150, 200, 175, 225]
})

chart = BarChart(root, width=600, height=400)
chart.plot(df, value_column='sales', label_column='quarter')
📦 Installation
pip install ChartForgeTK
Requirements
- Python 3.8+
- Tkinter (included with Python)
- Optional: pandas (for DataFrame support)
🚀 Quick Start
import tkinter as tk
from ChartForgeTK import BarChart

# Create window
root = tk.Tk()
root.title("My First Chart")
root.geometry("800x600")

# Create chart
chart = BarChart(root, width=780, height=520)
chart.pack(fill="both", expand=True)

# Plot data
chart.plot(
    data=[10, 20, 15, 25, 30],
    labels=["Q1", "Q2", "Q3", "Q4", "Q5"]
)

root.mainloop()
📊 Chart Types
Bar Chart
from ChartForgeTK import BarChart

chart = BarChart(parent, width=600, height=400, theme='light')
chart.plot([10, 20, 15, 25], ["A", "B", "C", "D"])
Line Chart
from ChartForgeTK import LineChart

# Single series
chart = LineChart(parent, width=600, height=400)
chart.plot([10, 15, 13, 18, 16, 20])

# Multiple series
chart.plot([
    {'data': [10, 15, 13, 18], 'color': '#FF0000', 'label': 'Series A'},
    {'data': [5, 8, 12, 10], 'color': '#00FF00', 'label': 'Series B'}
])
Pie Chart
from ChartForgeTK import PieChart

# 2D Pie Chart
chart = PieChart(parent, width=600, height=400)
chart.plot([30, 20, 15, 35], ["A", "B", "C", "D"])

# 3D Pie Chart
chart_3d = PieChart(parent, width=600, height=400, is_3d=True)
chart_3d.plot([30, 20, 15, 35], ["A", "B", "C", "D"])
Scatter Plot
from ChartForgeTK import ScatterPlot

chart = ScatterPlot(parent, width=600, height=400)
chart.plot([(1, 10), (2, 15), (3, 13), (4, 18), (5, 16)])
Box Plot
from ChartForgeTK import BoxPlot

data = [
    [1, 2, 3, 4, 5, 6, 7],
    [2, 4, 6, 8, 10, 12, 14],
    [1, 3, 5, 7, 9, 11, 20]
]
chart = BoxPlot(parent, width=600, height=400)
chart.plot(data, ["Group A", "Group B", "Group C"])
Histogram
from ChartForgeTK import Histogram

data = [1, 1.5, 2, 2, 2.5, 3, 3, 3.5, 4, 4.5, 5]
chart = Histogram(parent, width=600, height=400)
chart.plot(data, bins=5)
Candlestick Chart
from ChartForgeTK import CandlestickChart

# Format: (index, open, high, low, close)
data = [
    (1, 100, 105, 98, 103),
    (2, 103, 108, 101, 106),
    (3, 106, 110, 104, 108)
]
chart = CandlestickChart(parent, width=600, height=400)
chart.plot(data)
🐼 Pandas Integration
ChartForgeTK seamlessly integrates with pandas DataFrames and Series.
DataFrame with BarChart
import pandas as pd
from ChartForgeTK import BarChart

df = pd.DataFrame({
    'category': ['Q1', 'Q2', 'Q3', 'Q4'],
    'sales': [150, 200, 175, 225]
})

chart = BarChart(parent, width=600, height=400)
chart.plot(df, value_column='sales', label_column='category')
Series with PieChart
import pandas as pd
from ChartForgeTK import PieChart

series = pd.Series(
    [30, 25, 20, 15, 10],
    index=['Product A', 'Product B', 'Product C', 'Product D', 'Product E']
)

chart = PieChart(parent, width=600, height=400)
chart.plot(series)  # Index becomes labels automatically
Multi-Series LineChart from DataFrame
import pandas as pd
from ChartForgeTK import LineChart

df = pd.DataFrame({
    'month': ['Jan', 'Feb', 'Mar', 'Apr', 'May'],
    'revenue': [100, 120, 115, 130, 145],
    'expenses': [80, 85, 90, 95, 100],
    'profit': [20, 35, 25, 35, 45]
})

chart = LineChart(parent, width=600, height=400)
chart.plot(df, y_columns=['revenue', 'expenses', 'profit'], label_column='month')
ScatterPlot from DataFrame
import pandas as pd
from ChartForgeTK import ScatterPlot

df = pd.DataFrame({
    'height': [160, 165, 170, 175, 180],
    'weight': [55, 60, 65, 70, 75]
})

chart = ScatterPlot(parent, width=600, height=400)
chart.plot(df, x_column='height', y_column='weight')
📖 API Reference
Common Parameters
All chart constructors accept these parameters:
| Parameter | Type | Default | Description |
|---|---|---|---|
parent |
Widget | None | Parent Tkinter widget |
width |
int | 800 | Chart width in pixels |
height |
int | 600 | Chart height in pixels |
theme |
str | 'light' | Color theme ('light' or 'dark') |
display_mode |
str | 'frame' | Display mode |
BarChart.plot()
chart.plot(
    data,                    # List[float] or DataFrame
    labels=None,             # Optional[List[str]]
    value_column=None,       # Column name for DataFrame
    label_column=None        # Column name for DataFrame labels
)
LineChart.plot()
chart.plot(
    data,                    # List[float], List[Dict], or DataFrame
    x_min=None,              # Optional axis limits
    x_max=None,
    y_min=None,
    y_max=None,
    y_columns=None,          # List of column names for multi-series
    label_column=None        # Column name for x-axis labels
)
PieChart.plot()
chart.plot(
    data,                    # List[float], Series, or DataFrame
    labels=None,             # Optional[List[str]]
    value_column=None,       # Column name for DataFrame
    label_column=None        # Column name for DataFrame labels
)
🔧 Utility Classes
DataValidator
Validate chart inputs before plotting:
from ChartForgeTK import DataValidator

# Validate numeric data
data = DataValidator.validate_numeric_list([1, 2, 3, 4, 5])

# Validate dimensions
width, height = DataValidator.validate_dimensions(800, 600)

# Validate colors
color = DataValidator.validate_color("#FF5733")

# Validate labels
labels = DataValidator.validate_labels(["A", "B", "C"], expected_length=3)
ResourceManager
Manage chart resources for proper cleanup:
from ChartForgeTK import ResourceManager

# ResourceManager is automatically used by charts
# Access it for manual resource management
chart.resource_manager.cancel_animations()
chart.resource_manager.cleanup_tooltips()
chart.resource_manager.cleanup()
CoordinateTransformer
Handle coordinate transformations:
from ChartForgeTK import CoordinateTransformer

transformer = CoordinateTransformer(width=400, height=300, padding=40)
x_min, x_max, y_min, y_max = transformer.calculate_ranges(0, 100, 0, 50)

# Convert data coordinates to pixel coordinates
pixel_x = transformer.data_to_pixel_x(50)
pixel_y = transformer.data_to_pixel_y(25)
🎨 Customization
Themes
# Light theme (default)
chart = BarChart(parent, theme='light')

# Dark theme
chart = BarChart(parent, theme='dark')
Line Chart Options
chart = LineChart(
    parent,
    width=800,
    height=600,
    show_point_labels=True,           # Show/hide value labels
    use_container_width_height=True   # Auto-resize with parent
)
Multi-Series Styling
chart.plot([
    {
        'data': [10, 15, 13, 18],
        'color': '#FF5733',      # Custom color
        'shape': 'circle',       # circle, square, triangle, diamond
        'label': 'Series A'      # Legend label
    },
    {
        'data': [5, 8, 12, 10],
        'color': '#33FF57',
        'shape': 'square',
        'label': 'Series B'
    }
])
Reference Lines
# Add horizontal reference line
chart.add_bar('horizontal', value=15, color='#FF0000', label='Target')

# Add vertical reference line
chart.add_bar('vertical', value=3, color='#0000FF', dash=(4, 2))
🛡️ Stability & Reliability (v2.0)
ChartForgeTK v2.0 introduces comprehensive stability improvements:
Input Validation
- Type checking for all chart inputs
- Clear, descriptive error messages
- Automatic handling of edge cases (empty data, NaN, infinity)
# These will raise helpful error messages:
chart.plot([])                    # ValueError: data cannot be empty
chart.plot(None)                  # TypeError: data cannot be None
chart.plot([1, 2], ["A"])         # ValueError: labels length mismatch
chart.plot([-1, -2])              # ValueError: negative values (bar chart)
Edge Case Handling
- Single data point rendering
- Identical value handling with meaningful axis ranges
- Zero-range data protection against division errors
- All-zero pie chart detection
Resource Management
- Proper cleanup of tooltips and animation callbacks
- Memory leak prevention for long-running applications
- Safe animation cancellation on chart updates
📝 Examples
Complete Dashboard
import tkinter as tk
from tkinter import ttk
from ChartForgeTK import BarChart, LineChart, PieChart
import random

class Dashboard(tk.Tk):
    def __init__(self):
        super().__init__()
        self.title("Sales Dashboard")
        self.geometry("1000x700")

        notebook = ttk.Notebook(self)
        notebook.pack(fill='both', expand=True, padx=10, pady=10)

        # Bar Chart Tab
        bar_frame = ttk.Frame(notebook)
        notebook.add(bar_frame, text="Quarterly Sales")

        self.bar_chart = BarChart(bar_frame, width=950, height=550)
        self.bar_chart.pack(fill='both', expand=True)
        self.bar_chart.plot([150, 200, 175, 225], ["Q1", "Q2", "Q3", "Q4"])

        ttk.Button(bar_frame, text="Refresh",
                   command=self.refresh_bar).pack(pady=5)

        # Line Chart Tab
        line_frame = ttk.Frame(notebook)
        notebook.add(line_frame, text="Trends")

        self.line_chart = LineChart(line_frame, width=950, height=550)
        self.line_chart.pack(fill='both', expand=True)
        self.line_chart.plot([
            {'data': [10, 15, 13, 18, 16, 20], 'color': '#2563EB', 'label': 'Revenue'},
            {'data': [8, 10, 9, 12, 11, 14], 'color': '#DC2626', 'label': 'Costs'}
        ])

        # Pie Chart Tab
        pie_frame = ttk.Frame(notebook)
        notebook.add(pie_frame, text="Market Share")

        self.pie_chart = PieChart(pie_frame, width=950, height=550)
        self.pie_chart.pack(fill='both', expand=True)
        self.pie_chart.plot([35, 25, 20, 15, 5],
                           ["Product A", "Product B", "Product C", "Product D", "Other"])

    def refresh_bar(self):
        new_data = [random.randint(100, 300) for _ in range(4)]
        self.bar_chart.plot(new_data, ["Q1", "Q2", "Q3", "Q4"])

if __name__ == "__main__":
    app = Dashboard()
    app.mainloop()
For more examples, see showcase.py.
🔮 Roadmap
- Stability improvements (v2.0)
- Pandas DataFrame support
- Resource management
- Radar Charts
- Tree Maps
- Drag & Drop support
- Export to PNG/SVG
- Additional themes
🤝 Contributing
Contributions are welcome!
- Fork the repository
- Create a feature branch (
git checkout -b feature/amazing-feature) - Commit your changes (
git commit -m 'Add amazing feature') - Push to the branch (
git push origin feature/amazing-feature) - Open a Pull Request
📄 License
ChartForgeTK is open-source and released under the MIT License.
📬 Contact & Support
- Report Issues
- Source Code
- Author: Ghassen Saidi
Bring your Tkinter apps to life with ChartForgeTK! 🚀


Download files
Download the file for your platform. If you're not sure which to choose, learn more about installing packages.
Source Distribution
Built Distribution
Filter files by name, interpreter, ABI, and platform.
If you're not sure about the file name format, learn more about wheel file names.
Copy a direct link to the current filters
File details
Details for the file chartforgetk-2.0.0.tar.gz.
File metadata
- Download URL: chartforgetk-2.0.0.tar.gz
- Upload date:
- Size: 84.3 kB
- Tags: Source
- Uploaded using Trusted Publishing? No
- Uploaded via: twine/6.2.0 CPython/3.10.12
File hashes
| Algorithm | Hash digest | |
|---|---|---|
| SHA256 |
467a368cf0c2bd604d886801452ee0989a98f66ff8ef69a829251b138cd33a42
|
|
| MD5 |
26aea1aa3ba4a7c383548f621d905caf
|
|
| BLAKE2b-256 |
5a667ae74f82298875414fe3f5c1aaebe1a0b6113cac01d727c0a03ed134a8da
|
File details
Details for the file chartforgetk-2.0.0-py3-none-any.whl.
File metadata
- Download URL: chartforgetk-2.0.0-py3-none-any.whl
- Upload date:
- Size: 102.6 kB
- Tags: Python 3
- Uploaded using Trusted Publishing? No
- Uploaded via: twine/6.2.0 CPython/3.10.12
File hashes
| Algorithm | Hash digest | |
|---|---|---|
| SHA256 |
1661cf61402300c9e7eaf0dc5f626e07e91ef17fd394e86bd766e5f74ff79aef
|
|
| MD5 |
feca4f8857e841d72c93e9c6039606cb
|
|
| BLAKE2b-256 |
a3e4e3676b409dbf3c24abf0119a0b00bd10d95785d073138842851f629a1f91
|


