

🌌 DataNova
DataNova — Quickly explore your data in a few lines of code!
🛠️ Installation
pip install DataNova
🚀 Features
- Data Profile: Assess the quality of your data
profile(df) - Bar Graph: Shows the top 5 most common values
bar(df, 'Column_Name') - Histogram: Plots the distribution
hist(df, 'Column_Name') - Exploratory Data Analysis:
EDA(df) - Simple Linear Regression:
lm(df, x_var, y_var)
what's next?
- Logistic Regression (coming soon!)
Examples
Examples below use a dataset provided in the package called WINE_DF
from datanova import *
profile( WINE_DF )
- Most of our data is not blank, expect for 'price' (only 5% blank).
| Variable Name | Variable Type | Missing Count | % Blank | Unique Values | Most Frequent Value | Mean | Standard Deviation | Min | 25% | Median | 75% | Max | |
|---|---|---|---|---|---|---|---|---|---|---|---|---|---|
| 0 | country | object | 0 | 0 | 24 | US | |||||||
| 1 | province | object | 0 | 0 | 120 | California | |||||||
| 2 | points | int64 | 0 | 0 | 13 | 90 | 89.55 | 2.32 | 84.0 | 88.0 | 90.0 | 91.0 | 96.0 |
| 3 | price | float64 | 88 | 5 | 110 | 20.0 | 38.71 | 29.39 | 7.0 | 20.0 | 30.0 | 48.0 | 500.0 |
| 4 | variety | object | 0 | 0 | 161 | Pinot Noir |
$$\:$$ $$\:$$
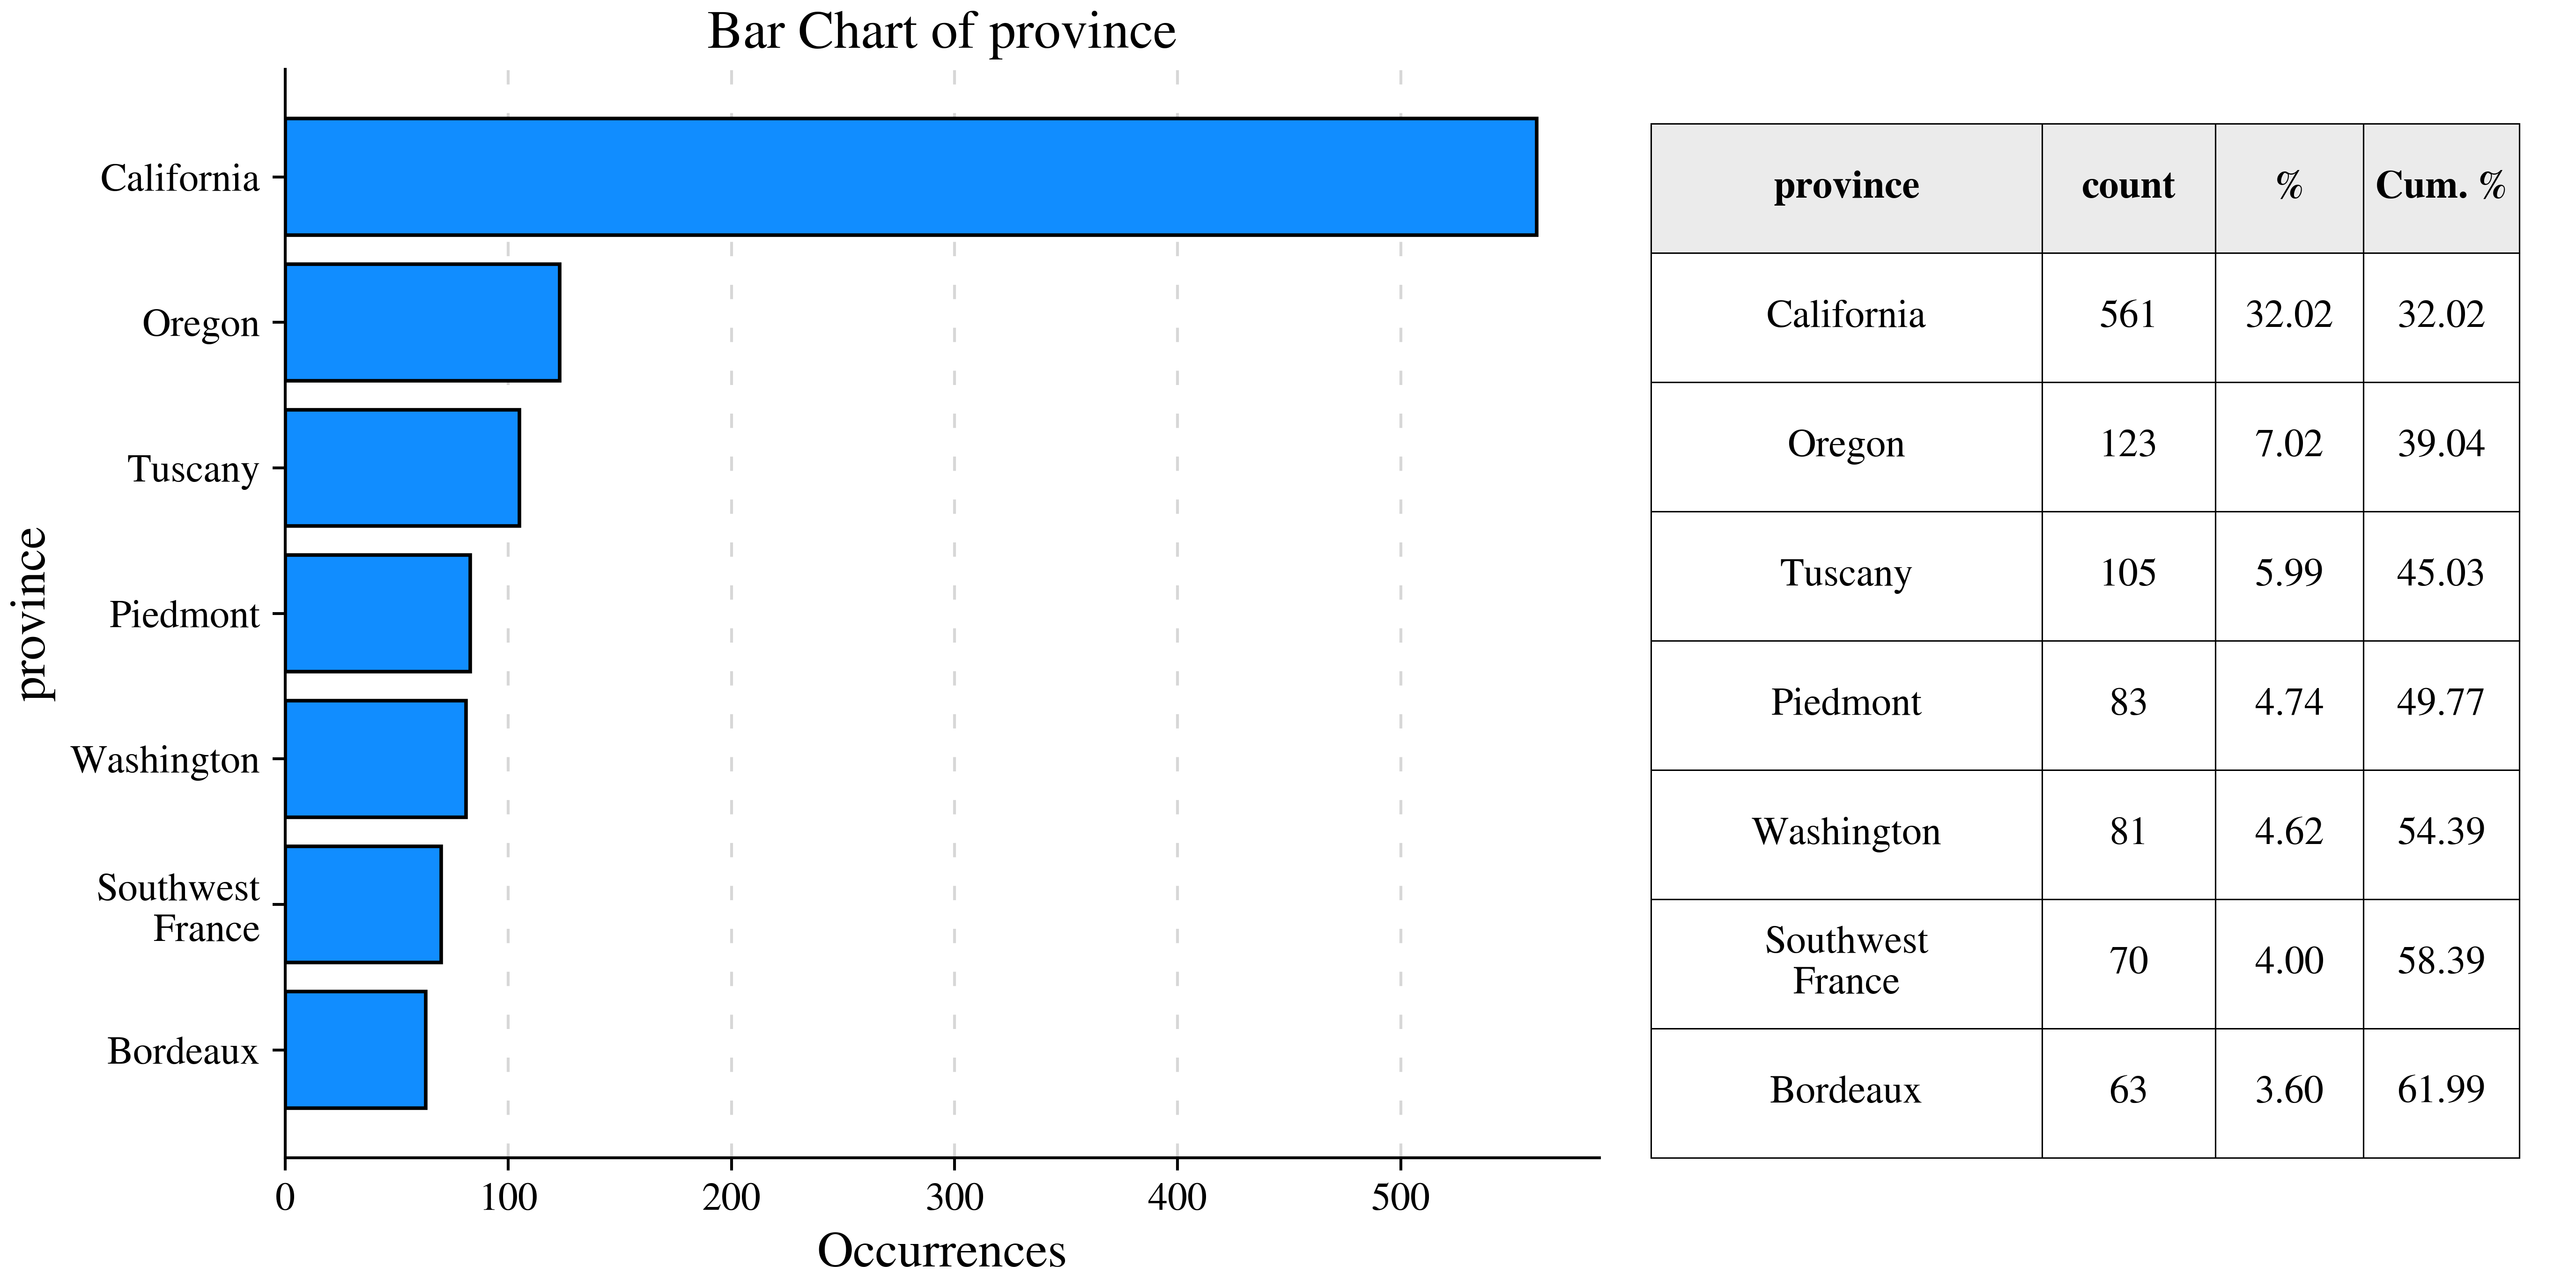
bar( WINE_DF , 'province', top_n=7)
- California accounts for 32% of total wine sales, and the top five regions collectively contribute over half of all sales.
$$\:$$ $$\:$$
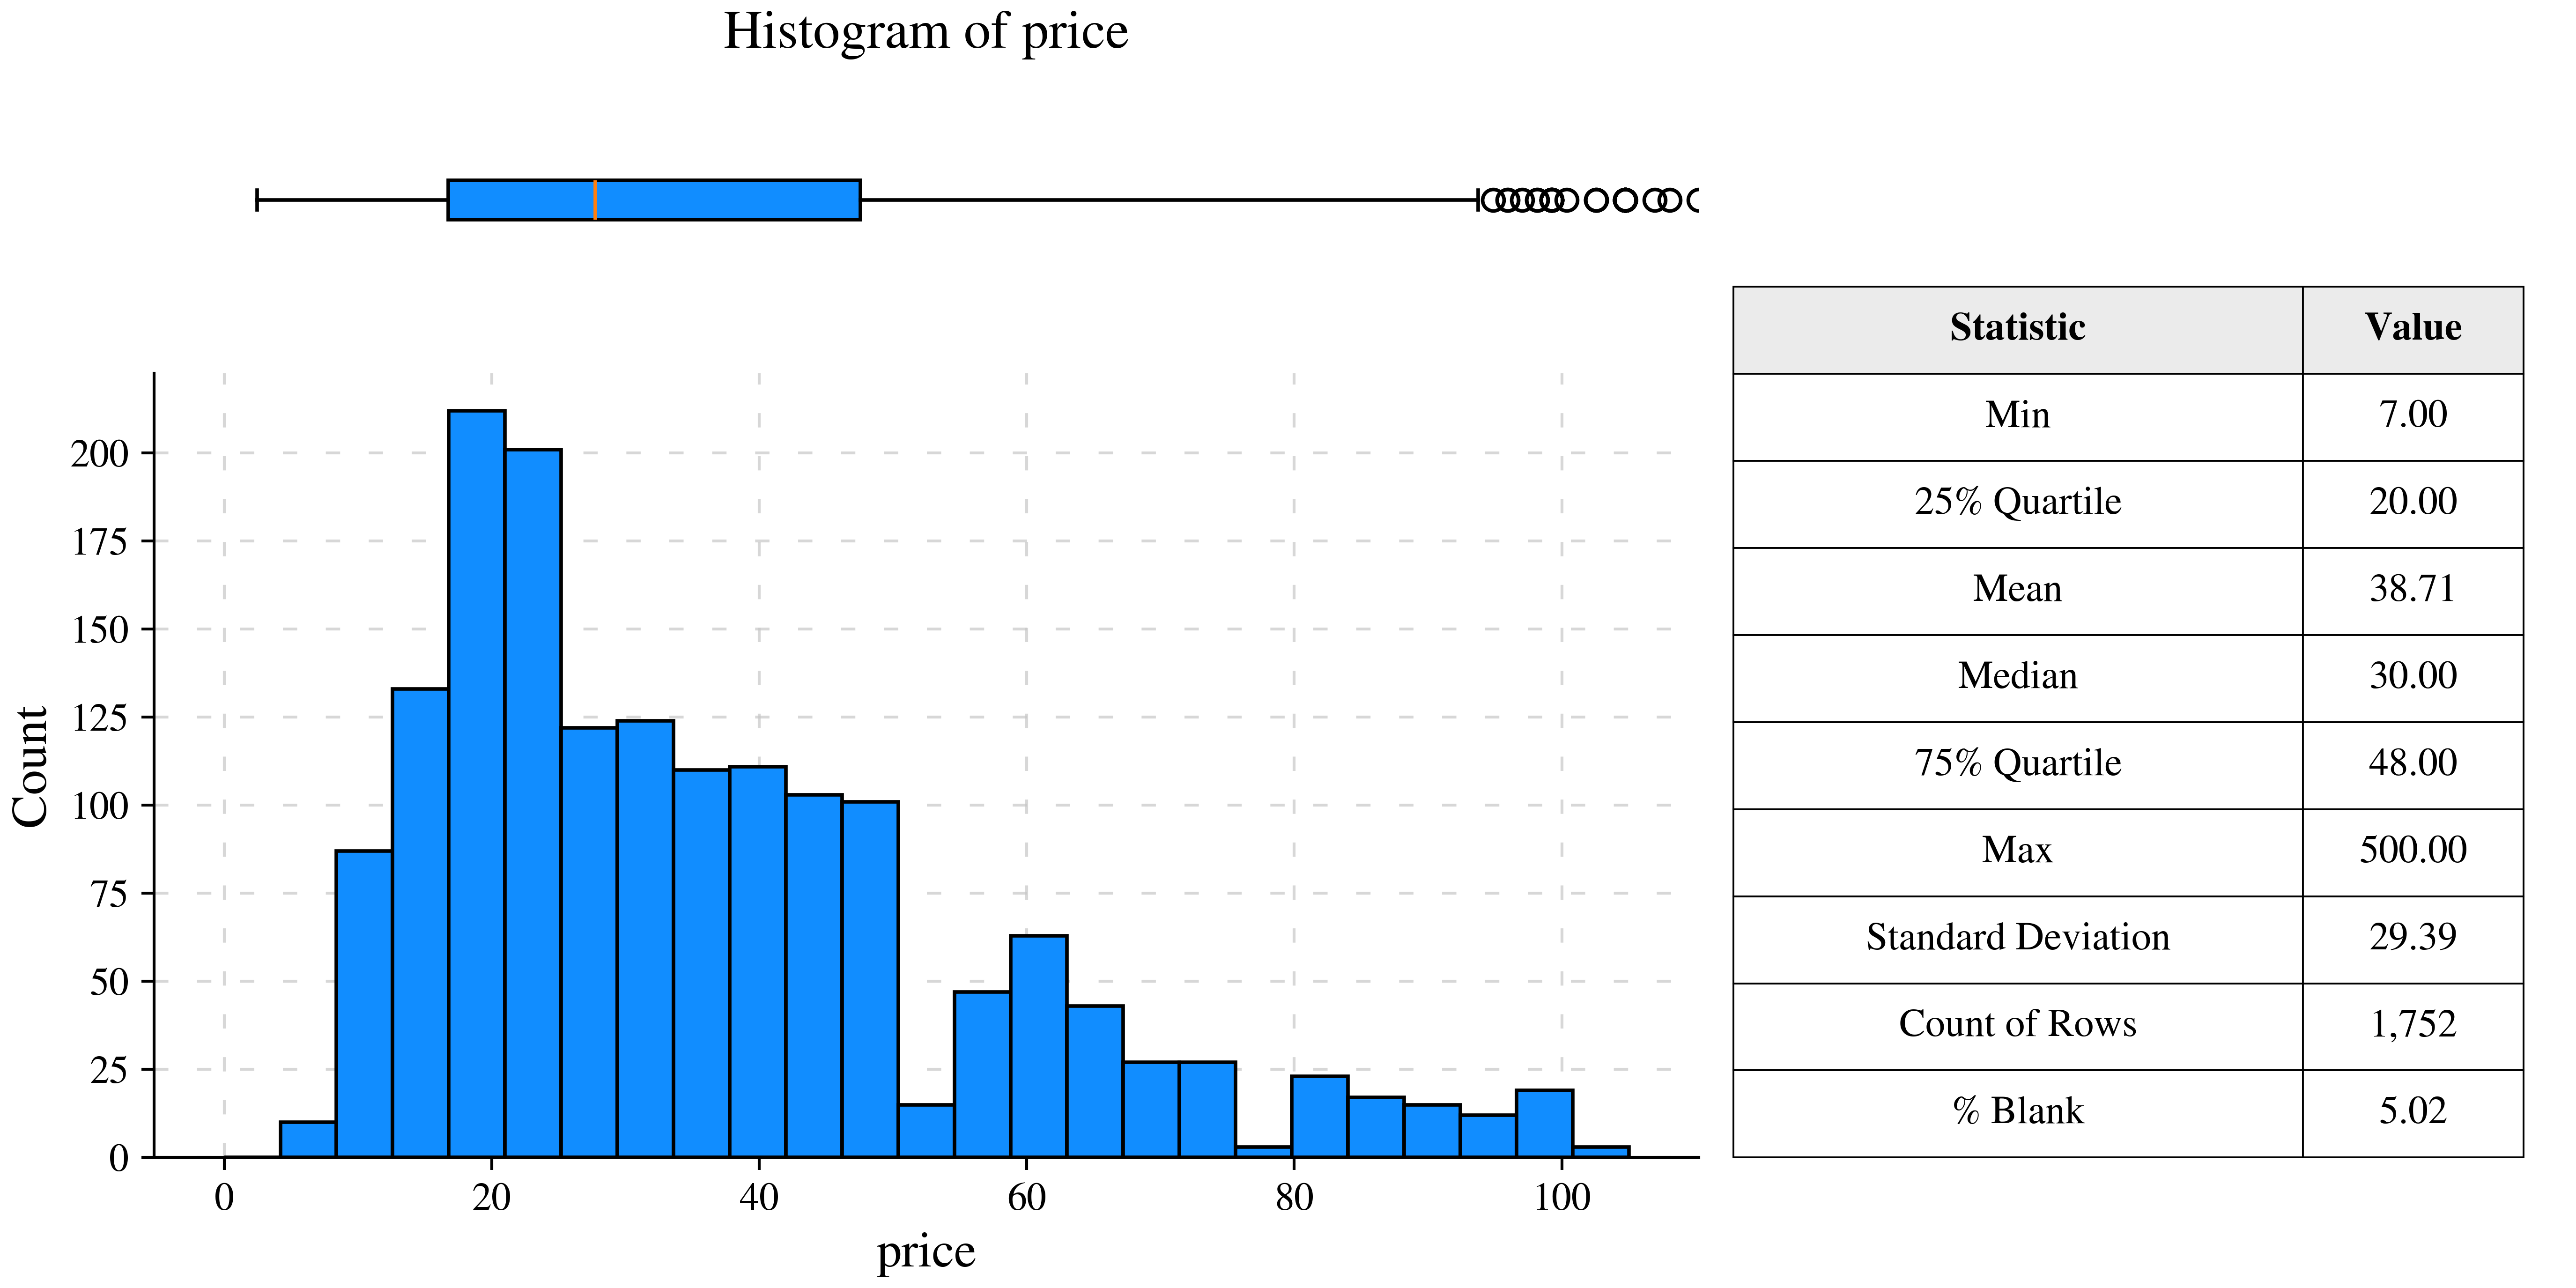
hist( WINE_DF , 'price' , xlim = [0,105], n_bins = 25)
- On average, a bottle of wine costs $38. The price ranges from: $20-$48
$$\:$$ $$\:$$
eda( WINE_DF )
- Creates bar graphs and histograms for all columns in the dataset.
$$\:$$
Regression Modeling
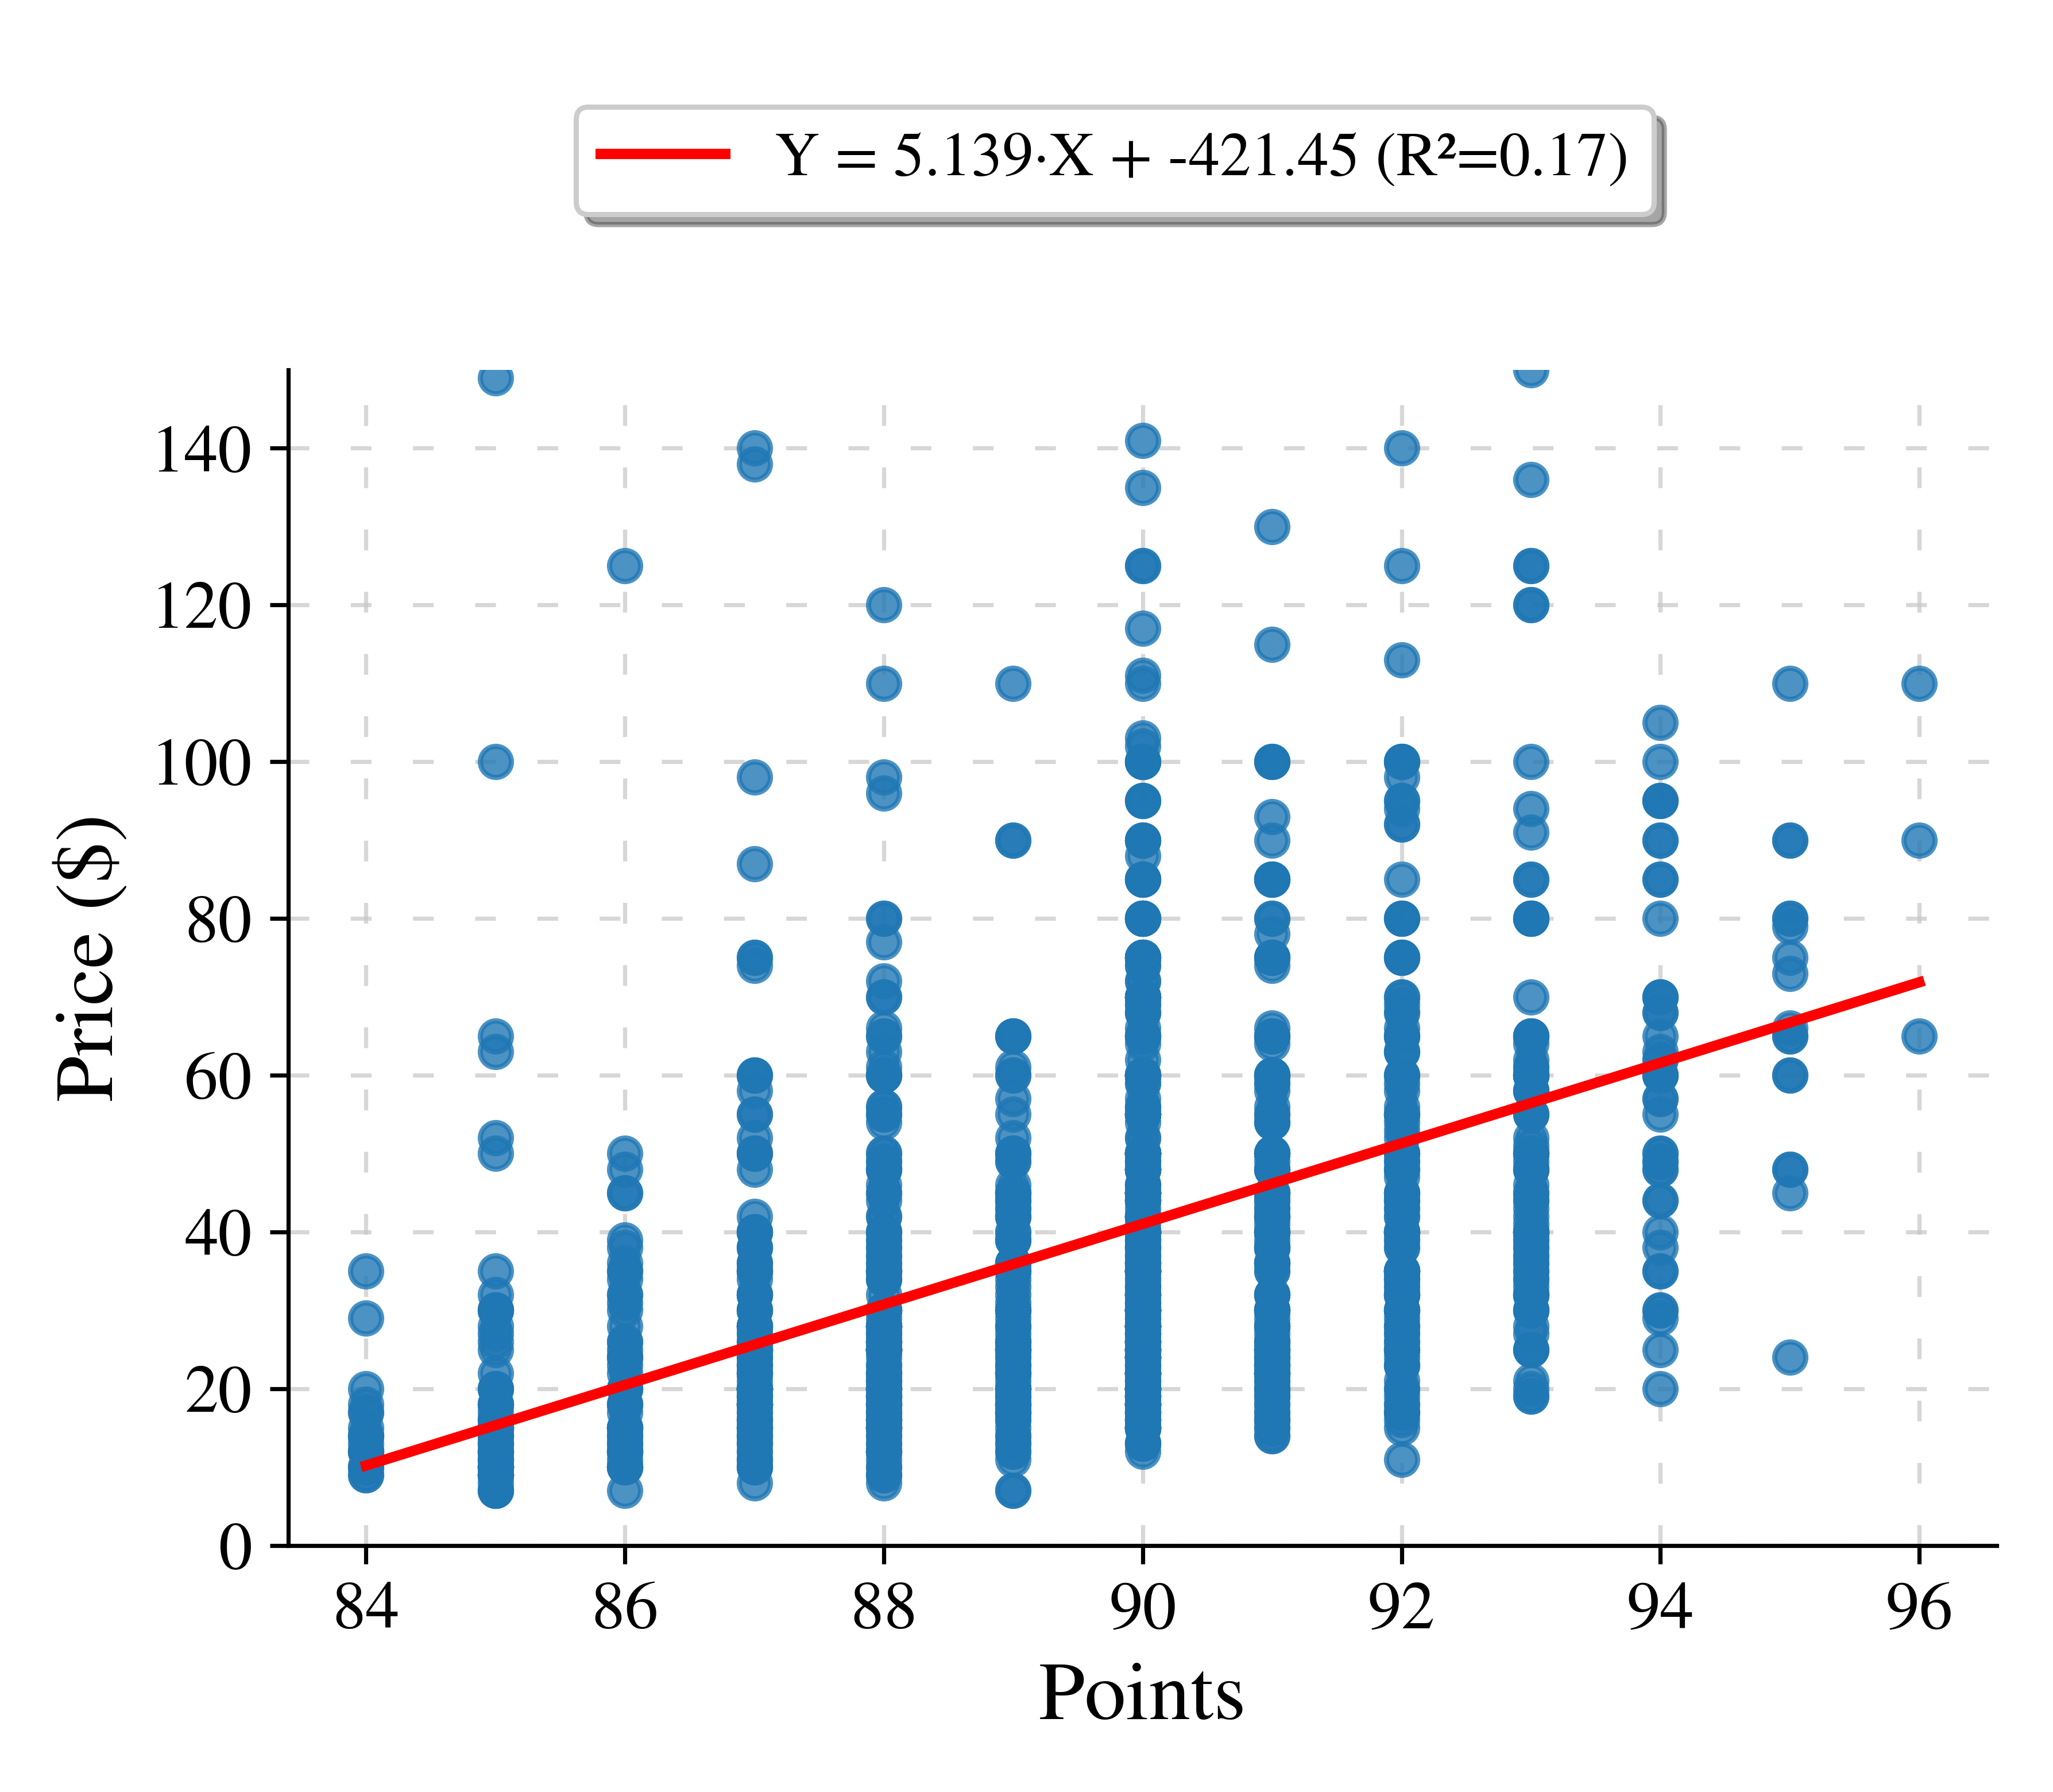
figure, model = lm(WINE_DF, 'points' , 'price' ,  ylimit = [0,150] ,
                   xtitle = 'Points' , ytitle = 'Price ($)' ,
                   show_summary=False , alpha = 0.8 )

display( figure )
- Creates a simple linear regression
- As the quality of wine increases (points), the price also increases.
1 maintainer

Metadata
1 maintainer
Release files for DataNova 0.1.4
For a detailed explanation of source distributions (sdists) and built distributions (wheels), please see the package formats documentation.
Source distribution (sdist)
| File | Size | Uploaded | |
|---|---|---|---|
| datanova-0.1.4.tar.gz | 21.3 kB | Details |
Built distribution (wheel)
| File | Interpreter | ABI | Platform | Reset |
|---|---|---|---|---|
| datanova-0.1.4-py3-none-any.whl | Python 3 | none | any | Details |
Total release size: 42.9 kB
Release files / datanova-0.1.4.tar.gz
| Download URL | datanova-0.1.4.tar.gz |
|---|---|
| Size | 21.3 kB |
| Tags | Source |
|
SHA-256 checksum How to use checksums |
0035979648092bd97acfb98805e7dcc56241daf8fdd6416ab2e741b80ebf316a
|
|
BLAKE2b-256 checksum How to use checksums |
e23ba06d76e51b066240556822019d6a771421f1ecfc9c71afdd42853f60feed
|
| Upload date | |
|
Uploaded using Trusted Publishing? What is trusted publishing? |
No |
| Uploaded via |
twine/6.2.0 CPython/3.12.0
|
Release files / datanova-0.1.4-py3-none-any.whl
| Download URL | datanova-0.1.4-py3-none-any.whl |
|---|---|
| Size | 21.6 kB |
| Tags | Python 3 |
|
SHA-256 checksum How to use checksums |
ea6c0900eb6c87031504439c6e56c5f1029e38f9f8a7bd5915e929beba9d08db
|
|
BLAKE2b-256 checksum How to use checksums |
77a436882ea09f817672ee24d5e957f657d6a0b5acc1dc11a13128e7afc22aa9
|
| Upload date | |
|
Uploaded using Trusted Publishing? What is trusted publishing? |
No |
| Uploaded via |
twine/6.2.0 CPython/3.12.0
|














