
A package for analyzing survey data from Deliberative Polling experiments.


Project description
This package is for analyzing survey data from Deliberative Polling experiments. Although designed for Deliberative Polling, this package can be used to analyze any experimental survey data.
The package is designed with a single, specialized function called outputs. This function accepts as input files exclusively in the IBM SPSS Statistics .sav format. Upon execution, it generates output files in both .xlsx and .docx formats. These output files contain statistical comparisons of all ordinal and nominal variables across all designated treatment groups, time intervals, and statistical weights.
While it is technically possible to run this package on Windows, it is strongly advised to use MacOS instead. Windows may require additional compatibility steps due to the Python package dependency pyreadstat. For more details, please refer to the pyreadstat Windows Compilation Guide.
Installation
To install SPSS, go to Software at Stanford if you are a Stanford affiliate. Othwerwise, go to IBM SPSS Software.
To install Python, go to Download Python.
To install DeliberativePolling, run the following in a terminal:
Python3 -m pip install DeliberativePolling
In SPSS
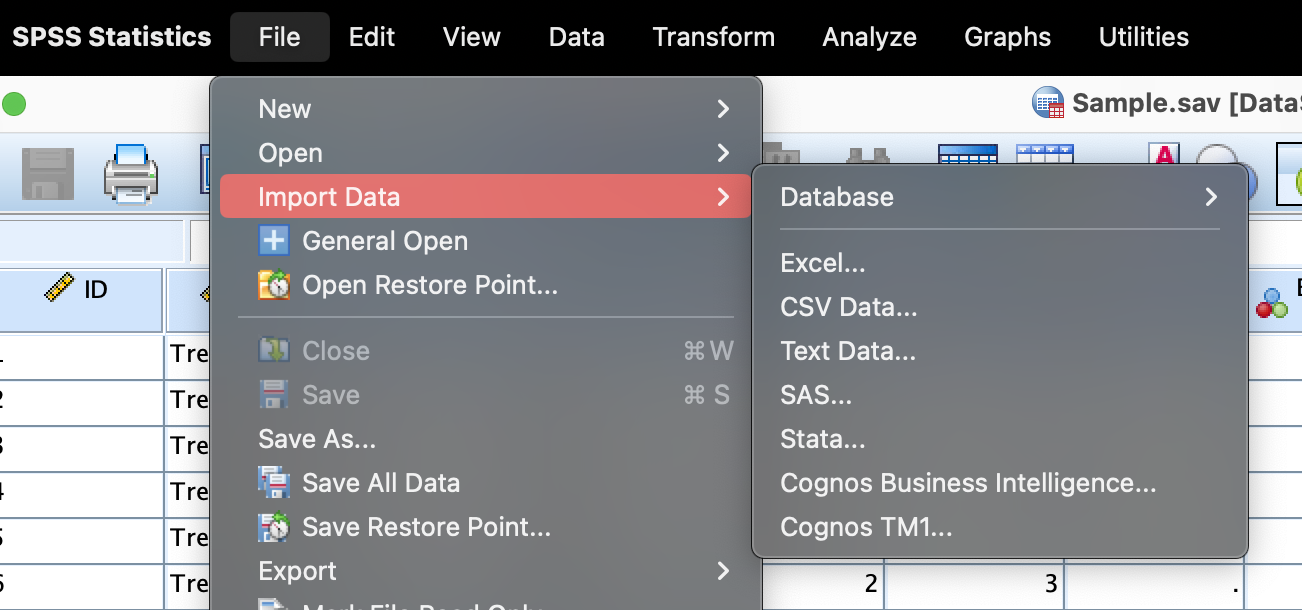
To import data into SPSS, open SPSS and navigate to File and Import Data.
Essential Variables
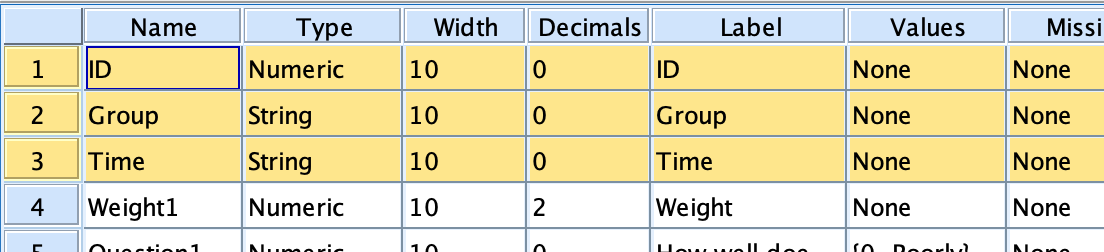
In order for outputs to identify the different subjects, experimental groups, and time intervals in the data, the SPSS file must contain three variables: ID, Time, and Group. If not already present in the data, you will have to create these variables yourself.
ID
The ID variable helps track individual participants in the study. It's like a name tag that stays the same for each person throughout the experiment. This way, you can see how a person's answers change over time. The ID can be a number, an email address, or any other unique identifier.
Group
The Group variable tells you which part of the experiment a participant is in—either the Treatment group that receives the intervention, or the Control group that doesn't. This helps you compare the effects of the treatment.
Time
The Time variable shows when a participant gave their answers. Labels like Pre-Deliberation or T1 are usually used for answers given before the treatment, and Post-Deliberation or T2 for answers given after. This helps you see how responses change over the course of the experiment. You can use any values you want to represent time intervals, "T1", "T2", "Pre-Deliberation", "Post-Deliberation", "Before", "After", etc.
Note that outputs will run a comparison of every Group at every Time at every weight. It is advisable to keep the number of groups, times, and weights low to ensure a reasonable runtime.
Optional Variables
Weights
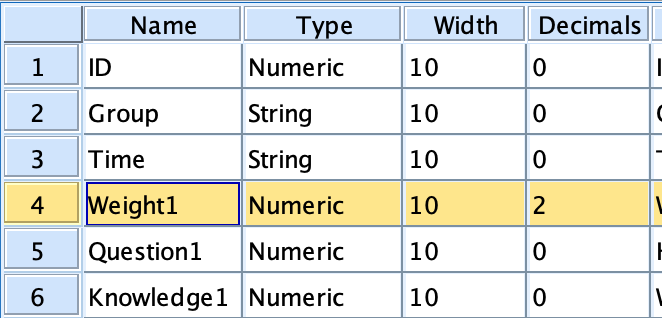
By default, the outputs function generates unweighted tables that compare survey data between all experimental groups and time intervals; however, you can introduce weighting by including columns with the word weight in the header, like Weight1 in Sample.SAV. These weight variables must be numeric with their Measure set to Scale.
Ignored Variables
To keep variables in the SPSS file that you don't want included in the outputs function's analysis but might use later, set their Measure to Scale; variables with this setting won't be part of the analysis unless they are designated as weight variables. There are often many variables in a data set that are not helpful for analyzing subject responses. For example, many data sets include the date and time the survey was started, the operating system of the user device, the IP address of the user, and other such extraneous data. In general, you should always include responses to opinion and demographic questions asked of participants.
Remove Duplicate Variables
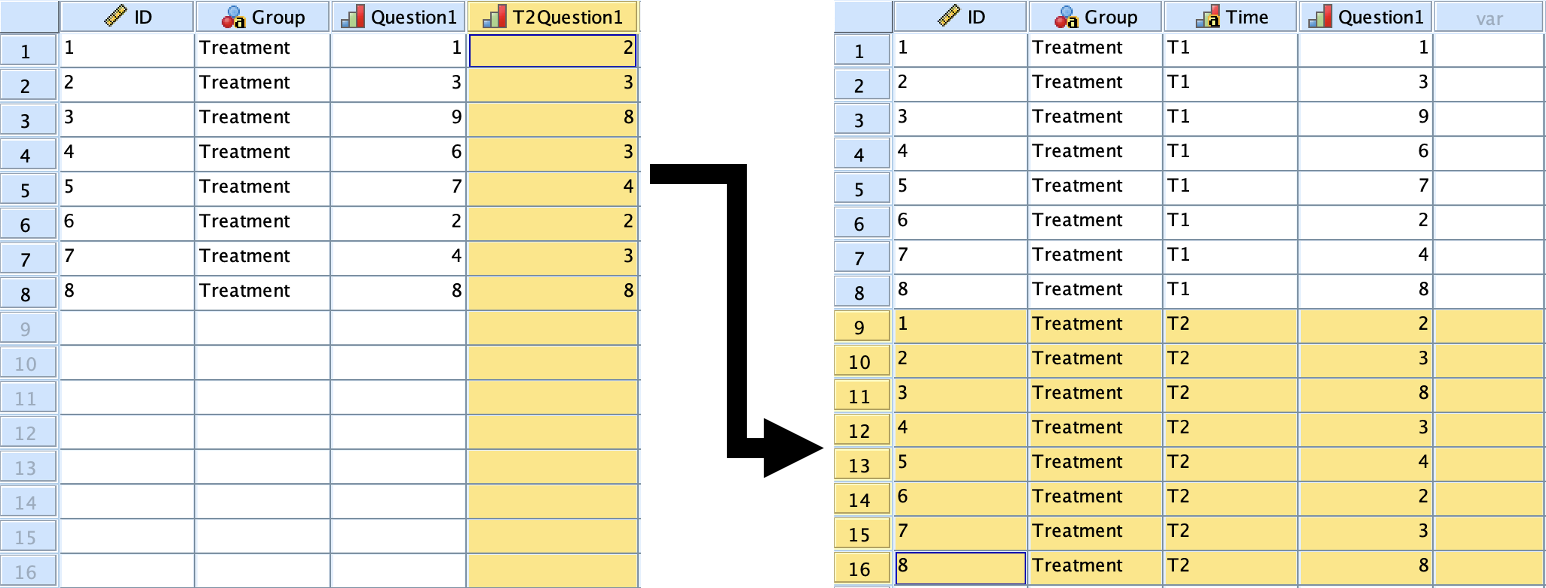
When you first import your dataset into SPSS, you might notice that a single question (e.g., "How well is democracy functioning?") is represented by multiple variables each corresponding to a different time point. For instance, you could have one variable named Question1 for responses collected at the first time point (e.g., T1, Pre-Deliberation) and another variable named T2Question1 for responses collected at the second time point (e.g., T2, Post-Deliberation). These variables need to be consolidated into a single variable.
To achieve this, you'll need to create additional rows in your dataset for each participant, capturing their responses to the same question at different time intervals.
-
First Row: This row will contain the participant's response to the first time-specific variable (e.g.,
Question1). In theTimecolumn, you should enter the label that corresponds to this time interval (e.g.,T1,Pre-Deliberation). -
Second Row: This row will contain the participant's response to the second time-specific variable (e.g.,
T2Question1). In theTimecolumn, you should enter the label that corresponds to this time interval (e.g.,T2,Post-Deliberation).
By following this approach, you will stack all the responses under a single variable (e.g., Question1). This allows each participant's responses to be represented multiple times in the dataset, each corresponding to a different time interval. While these new rows will, of course, have different values for Time, their values for ID and Group cannot change.
Measures
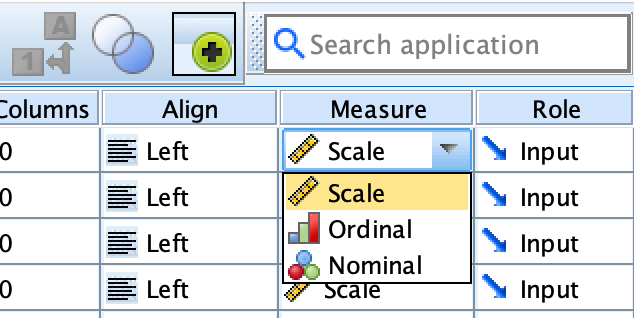
In the Measure column of Variable View, variables can be classified as Nominal, Ordinal, or Scale.
Nominal
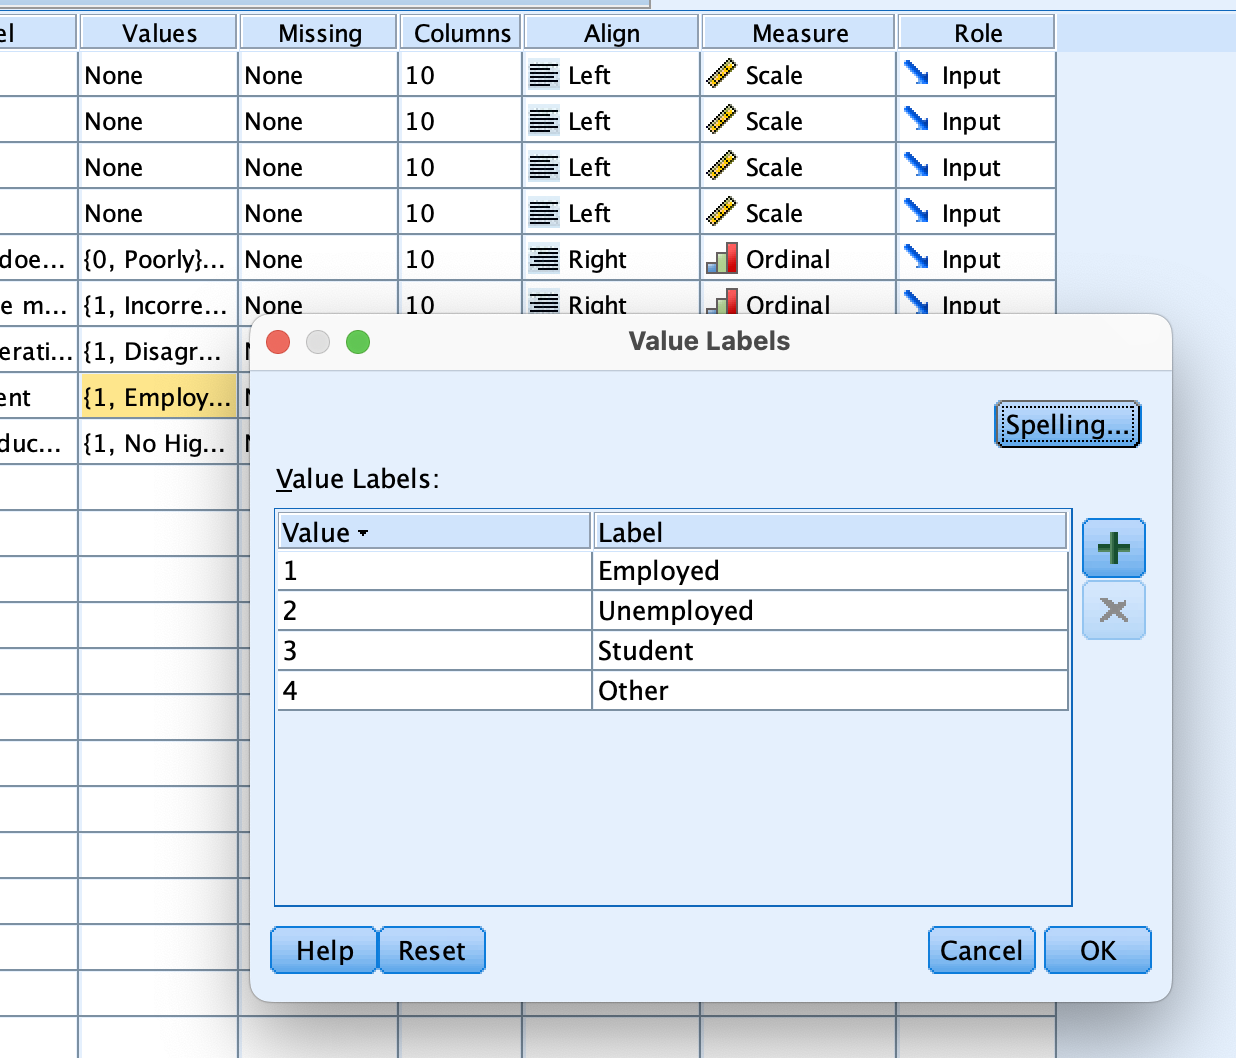
Nominal variables are categorical variables that lack a sequential order. For instance, the variable Employment in the Sample.SAV file includes the categories Employed, Unemployed, Student, and Other, which don't follow a specific sequence. While there are exceptions, such as Education Level, which do have an order, it's generally advisable (but not mandatory) to categorize variables containing demographic data as Nominal.
Ordinal
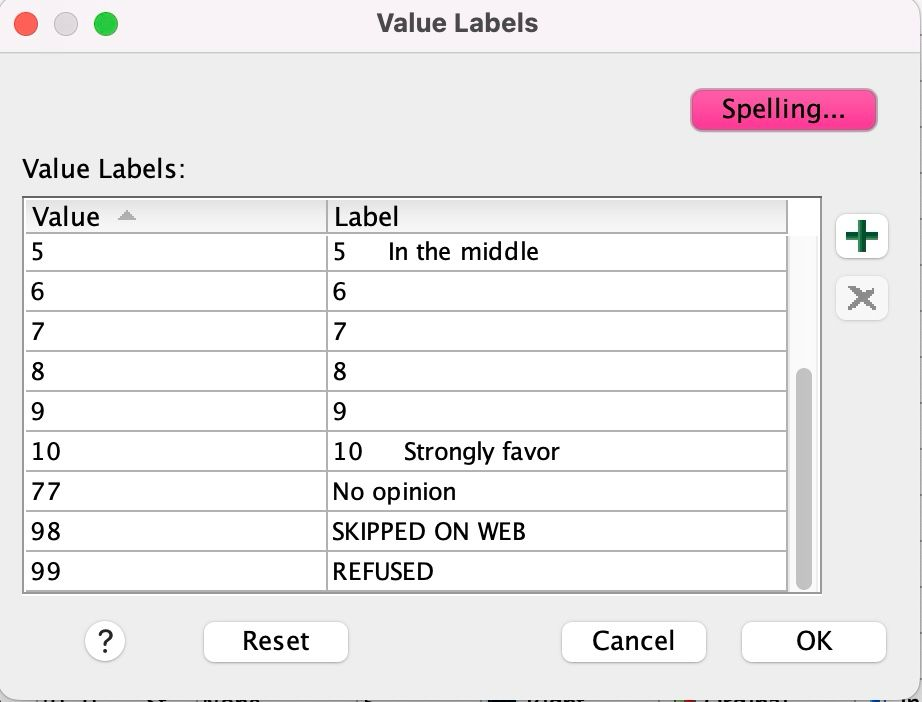
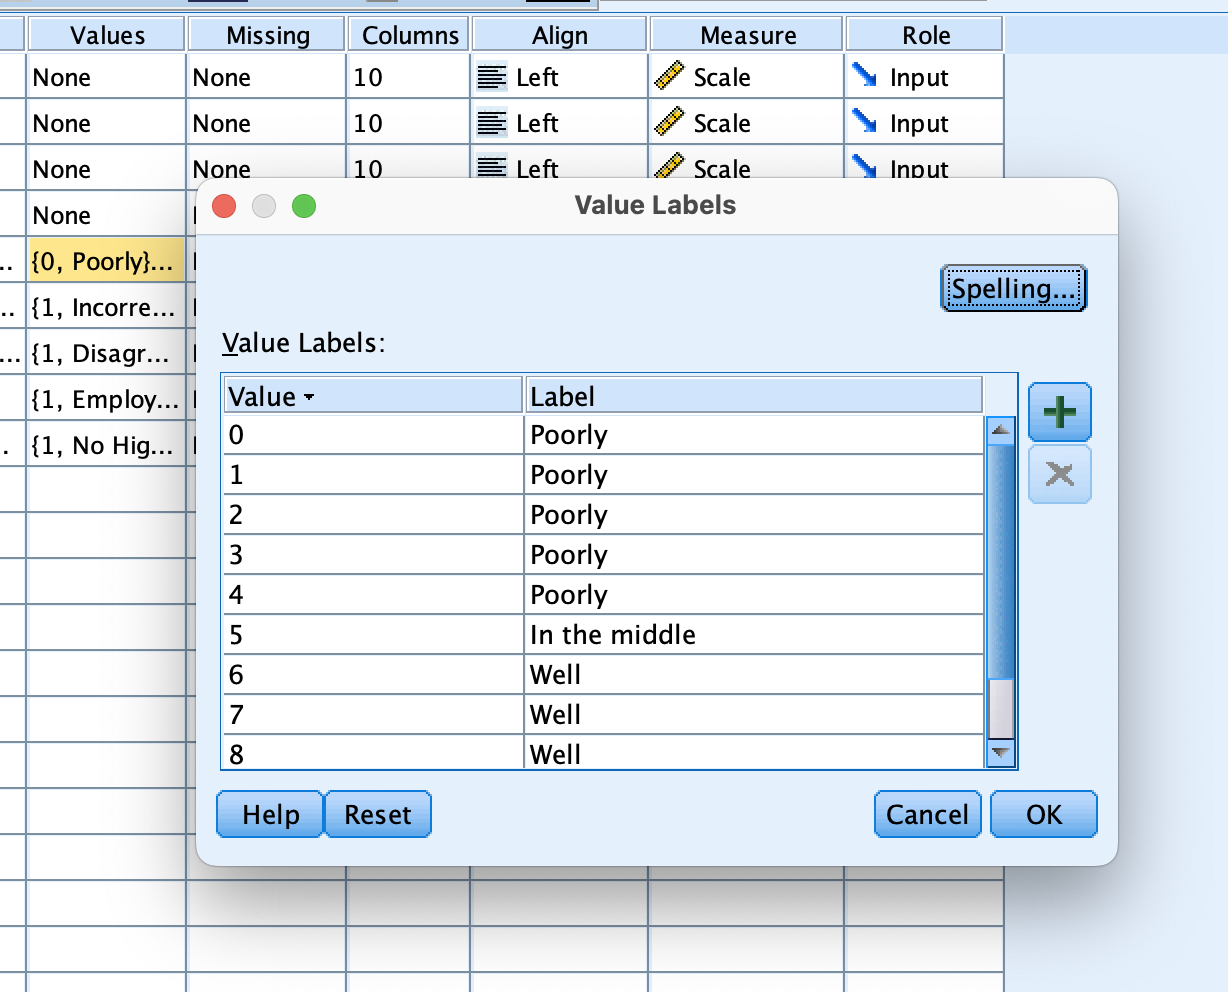
Ordinal variables are categorical variables that have a well-defined order. For example, the variable Question1 in the Sample.SAV file. This variable uses a Likert scale that ranges from 0 to 10, representing a progression from Poorly to Well in response to the question "How well does democracy function?" Typically, it's recommended (but not obligatory) to classify variables with responses that change between time intervals as Ordinal. Examples of such responses are opinion, evaluation, values, and knowledge questions.
Nonresponse Indicators: Some statisticians indicate non-response to survey questions using numeric codes like -1, 77, 98, or 99. It's crucial to remove these nonresponse numeric codes from ordinal variables before analysis. The outputs function calculates the average of survey responses in ordinal variables, assuming a consistent scale like 0-10, 1-5, or 1-3. Including nonresponse values like 99 can significantly distort the calculated mean. To avoid this, replace these numeric codes with blank cells; blank cells will be counted as DK/NA (Don't Know/Not Applicable) and will not affect mean calculations. The exception to this rule would, of course, be if the scale naturally includes 77, 98, or 99, like 0-100.*
Scale
Any variables that don't fit into the Nominal or Ordinal categories should be classified as Scale variables. These can either be continuous or discrete. All variables related to weight should be categorized as Scale.
Labels
In SPSS, labels help clarify the meaning of variable names and values.
Column Labels
Variable names can't have spaces or punctuation. Descriptive Column Labels can be set in Variable View under the column Label to provide more information about the variables.
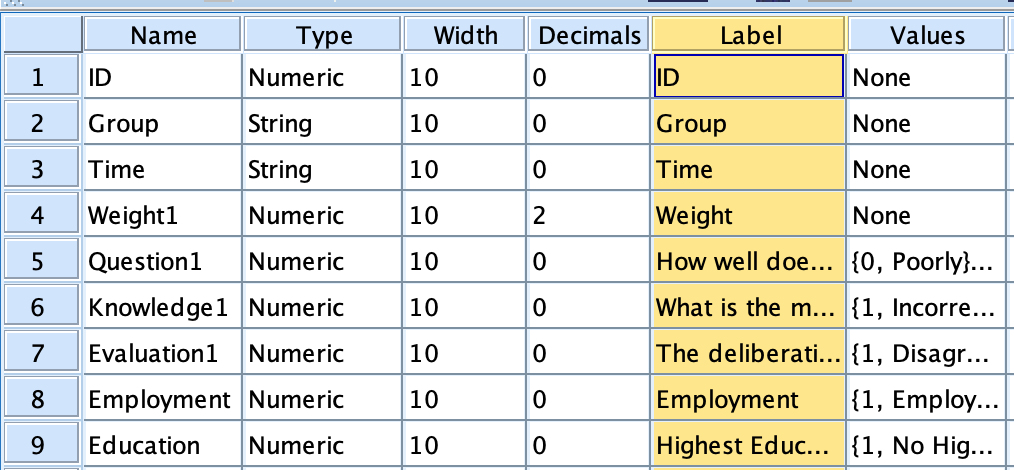
Nominal Variables: For nominal variables use concise labels. For example, the variable Education in Sample.SAV has the column label Education Level. Keep these labels short because they will appear in file names like Tables - Ordinal Variables - Treatment at T1 v. T2 (Unweighted) - Education Level.
Ordinal Variables: For ordinal variables you can use fuller more descriptive labels. For example, the variable Question1 in Sample.SAV has the column label How well does democracy function?. These ordinal column labels do not appear in file names, only within cells in the outputted files so length is unlikely to cause an issue.
Value Labels
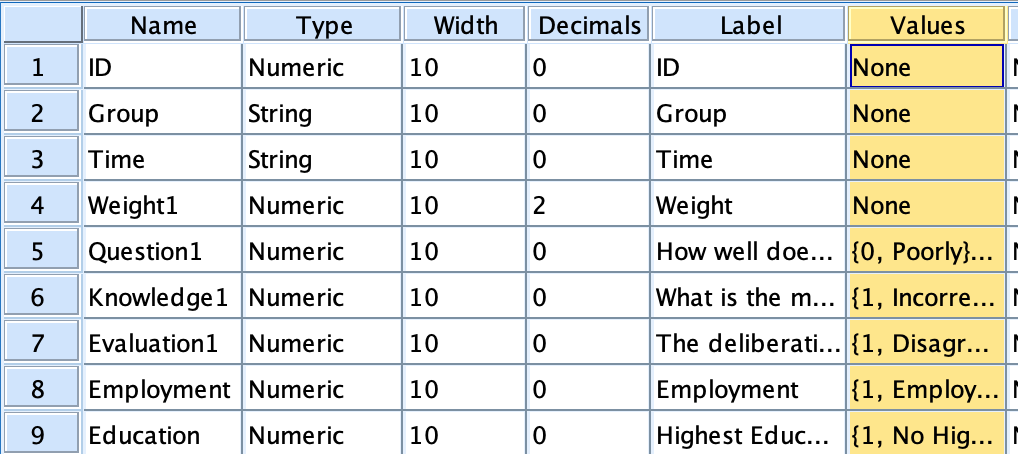
When working with SPSS, it's essential to set the Type of both Ordinal and Nominal variables to Numeric in the Variable View. Since the data will be numeric, you'll use value labels to provide meaningful context to these coded numbers.
Numeric Codes: Value labels allow you to give meaning to numerically coded data. Use the Values column in Variable View to associate each number in ordinal or nominal variables with a label. For example, in the ordinal variable Age in Sample.SAV, the value labels indicate that a value of 1 means 18-30 and 2 means 30-50.
Shared Labels: Some variables might have several numeric codes that mean the same thing. For instance, in the ordinal variable Question1, the codes 0 through 4 are all labeled as Poorly, while 6 through 10 are labeled as Well.
Ensure that all values in nominal and ordinal variables have labels, otherwise the outputs function will return an error message indicating which values are unlabeled. Labels for scale variables are not advised.
Once you've included all essential variables and assigned column and value labels to all nominal and ordinal variables, you can run the outputs function on the SPSS file. If any metadata is missing, the outputs function will return an error and specify what data is lacking.
Columns like Width, Decimals, Missing, Columns, Align, and Role in Variable View can usually be ignored.
In Python
To execute the outputs function, open a terminal with the directory containing the .SAV file.
If you are not familiar with opening a terminal to a specific directory, see these instructions.
Run the following commands:
Python3
from DeliberativePolling import outputs
outputs("your_file.sav")
Outputs
After running the function, a new folder named Outputs will be created in the directory. This folder will contain all the generated tables and reports in .xlsx and .docx format.
Fast Exports: Generating tables and reports in .docx format significantly slows down the outputs function. To speed up code execution, you can just generate tables and reports in .xlsx format by adding the tag fast=True to outputs. For an example, see below.
outputs("your_file.sav", fast=True)
Release history Release notifications | RSS feed


Download files
Download the file for your platform. If you're not sure which to choose, learn more about installing packages.
Source Distribution
Built Distribution
Filter files by name, interpreter, ABI, and platform.
If you're not sure about the file name format, learn more about wheel file names.
Copy a direct link to the current filters
File details
Details for the file DeliberativePolling-1.4.2.tar.gz.
File metadata
- Download URL: DeliberativePolling-1.4.2.tar.gz
- Upload date:
- Size: 14.1 kB
- Tags: Source
- Uploaded using Trusted Publishing? No
- Uploaded via: twine/4.0.2 CPython/3.11.4
File hashes
| Algorithm | Hash digest | |
|---|---|---|
| SHA256 |
f6beac50a242629c51874b17f120a544f743144e37d3cb46710215882f9d5ca2
|
|
| MD5 |
706432b5922a1338a9d2ef0492da92e8
|
|
| BLAKE2b-256 |
2a33e07a28377474089229b794a3a6fac6fbadc945f40b8e561626aa38bf1395
|
File details
Details for the file DeliberativePolling-1.4.2-py3-none-any.whl.
File metadata
- Download URL: DeliberativePolling-1.4.2-py3-none-any.whl
- Upload date:
- Size: 20.8 kB
- Tags: Python 3
- Uploaded using Trusted Publishing? No
- Uploaded via: twine/4.0.2 CPython/3.11.4
File hashes
| Algorithm | Hash digest | |
|---|---|---|
| SHA256 |
d0de591887042460c2ea255f14b1d666b709120c3e3b9bd81dc7bea636af9a02
|
|
| MD5 |
4ee91f65e9d5594fc01377c72f260a9d
|
|
| BLAKE2b-256 |
bbdfc443922c0ff9e2f50d3727b4cbf161f765a76dcb9ca5bc8d386e2bb33e30
|






