
Software to (re)produce burning ember diagrams of the style used in IPCC reports.

Project description

The Ember Factory

Objective

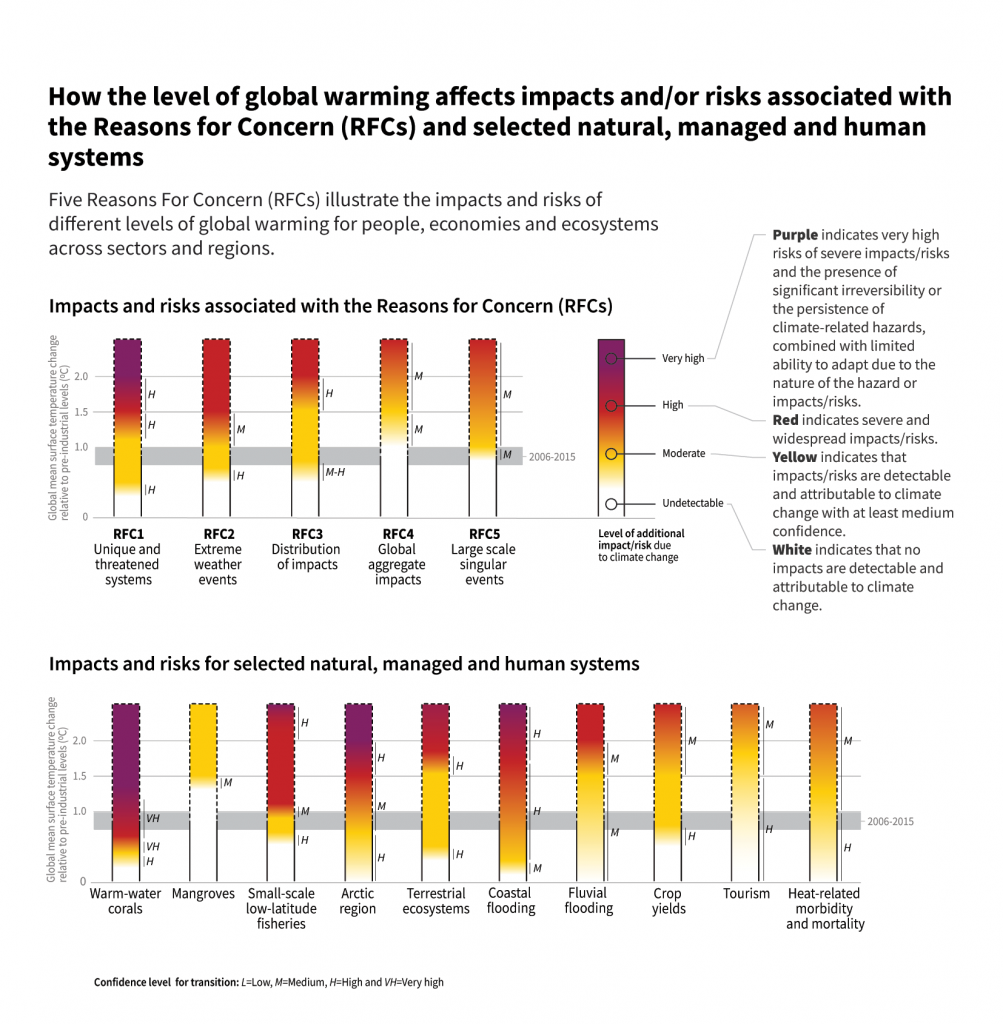
The purpose of this software is to facilitate the (re)production of burning ember diagrams of the style used in IPCC reports. An example is figure 2 from the Summary for Policymakers of the Special Report on a global warming of 1.5°C: SR15 Figure SPM.2.

The Ember Factory is a small web application ('the factory') that relies on the related EmberMaker project (...'the machine') to produce the diagrams. While the EmberFactory produces diagrams in just a few clicks, EmberMaker can be integrated into other applications as a library.

The ability of this software to reproduce many of the figures published to date by the IPCC has been carefully tested (however, the IPCC would not be responsible for any errors in this software).

How to use

This software (hereafter 'the EF') is designed to work as a web application. However, it is relatively easy to run it "locally":

  • The application is publicly available here: https://climrisk.org/emberfactory

  • To run it on your own computer, you need to have Python >= 3.10 installed, then install the EF with pip: pip3 install emberfactory Then set the environment variable needed by flask: export FLASK_APP=emberfactory (for Windows: $env:FLASK_APP = "emberfactory") and start with flask run. You should receive an url to open in your browser and access the EF, such as for example http://127.0.0.1:5000/

  • To run the app on a server, you need a WSGI server such as Gunicorn (not included in the required packages because you do not need it to run the EF locally, and you may have another WSGI server).
    If you want a root path such as /emberfactory, the EF is written so that you should set this path in the APPLICATION_ROOT variable within a file called emberfactory.cfg that needs to be located in your /instance folder (this is not entirely standard).

Development history

This software was created by philippe.marbaix -at- uclouvain.be at the end of 2019. The first objective was to produce figure 3 of Zommers et al. 2020 (doi.org/10/gg985p). Improvements were regularly provided during 2020 and this will likely continue if there are needs. Some aspects of the coding may still reflect the logic of the first versions rather than what would be done if starting from scratch; changes are done when they become useful, as experience also drives further development. Any feedback is thus very helpful!

Help is welcome to further improve the application. All contributions will be recognised :-).

No tracking

I am making efforts to avoid anything that could result in user tracking: no fonts, icons or libraries downloaded from third-parties by the user. I would like this to continue in the future. Advice would be welcome. It is also why the code is hosted by framasoft using gitlab. I thank them both.

Changelog

Potential future improvements

  • Embed fonts in PDFs? (not trivial, standard fonts will not be embedded because too expensive for a Unix server)
  • Verify the way lineWidth is defined: it may still be inconsistent
  • Improve some 'layout rules' (see AR6 fig 2.11): have grey area for T ranges under the grid-lines, provide an input for the color of the main grid lines (that may be the existing may value for the color parameter)...
  • Report the project's version (from the Excel file) in some metadata of the PDF file so as to improve traceability
  • In case of "overlapping transitions" (introduced in v1.6), handle the case of "adversely placed median" (handling overlaps means recalculating the location of transitions min/max; adverse cases may have a median outside this calculated transition range; if it is confirmed that such cases should not happen, an error should be reported)
  • Allow non-linear colour gradients to improve perception. This would differ from IPCC practice so far, so it needs studying how risk is best communicated.
  • Add a timeout when processing and drawing embers: currently, an endless loop may eat CPU (and cause climate change!).

[2.0.0] 2023-12

Change

  • Separation of the web UI and EmberMaker, which becomes a stand-alone API.
  • Redesigned layout.

Addition

  • The new optional parameter "conf_lines_ends" allows for more "precise" vertical lines highlighting the transitions, as an alternative to the standard "gap" used to separate a transition from the next. The new options indicate the full length of each transition, as they do use symbols instead of a white gap to indicate the transition limits.

[1.8.2] 2023-07-22

Bug fixes:

  • Restored the ability to use CMYK colors (lost due to missing a specific call to ReportLab)
  • Solve an issue where Safari does not try to get the SVG when the app is run several times. Enforcing cache-control = no-cache and such things did not work, hence a timestamp was added to the request.

[1.8.0] 2023-07

Addition:

  • Embers are produced in SVG format. This is now the default.
  • Support for arbitrary risk level and associated transition names, including for positive impacts.

Changes:

  • The processing log is only retrieved from the server when requested; removed use of flask-session module.

Bug fix

  • Reworked helpers.isempty() so that it accepts any input, because some lists caused crashes.

[1.7.1] 2023-04

Bug fixes

  • The connecting lines showing changes between embers will no longer be drawn for risk levels absent from an ember (the result was incorrect, due to the default behaviour of an interpolation routine).
  • A specific potential error in input Excel sheet is better handled: non-numeric data for a hazard level will be converted to numeric if possible, with a warning. This may change the result for incorrect Excel sheets that may arise on non-English computers, e.g. when "." is typed instead of "," as the decimal separator, resulting in a string instead of a number. Previous versions of the EF ignored such lines (without a warning).

[1.7.0] 2023-03

Bug fixes:

  • The "show_changes" parameter/feature highlights risk level changes between successive embers with a connecting line. However, when a risk level specified by this parameter falls outside the assessed range for one of the embers, the result was unreliable. The correction removes the connecting line in such case
  • It is now possible to process larger diagrams (= more embers at once).

Additions:

  • Support for complex descriptions of transitions where a transition is assessed for more than one confidence level. Such transitions are assessed for more levels than the standard min-median-max, adding "percentiles" so that a transition may be described for example by providing hazard values for min, p25, p75, max.

Changes:

  • The lineWidth was homogenised to 0.35 mm to remove inhomogenities, but coding improvements would be welcome.
  • The "basic format" becomes a "standard format" because it now has most of the features of the "fullflex" format; however, the fullflex format will remain available, at least as legacy format, and there are still some differences beyond the layout of the spreadsheet.

[1.6.0] 2021-09-12

Additions:

  • Support for "overlapping transitions"

Changes:

  • Minor improvements to embermaker due to indirectly related work (dependent projects): embermaker.ember now uses helpers.drawparagraph to draw ember names rather than direct lower level calls
  • Correction of a minor technical mistake in the definition of colour gradients which made PDFs incompatible with recent versions of Adobe Illustrator
  • Correction of a bug which occured when default CMYK colors were selected from the UI radio button

[1.5.1] 2021-01-03

This version fixes very minor issues. The change in the version number is only for distribution on Pypi.

[1.5.0] 2021-01-02

Additions:

  • Secondary axis
  • Axis minor tick marks (= unlabelled thick marks to divide the interval between the major ticks)
  • Optional use of (main) tick marks and vertical axis line instead of the horizontal grid
  • Legend for the confidence levels (and transitions)

Changes:

  • Removed a minor bug that could have resulted in drawing an unnecessary grid line outside the range of the vertical axis (above the ember diagram)

[1.4.1] 2020-12-13

Changes:

  • Minor typo in the documentation (Parameters reference, typo in paramdefs.md)

[1.4.0] 2020-12-05

Additions:

  • PNG preview, PNG and JPEG download in addition to the standard PDF.
  • Support for sub/superscripts in text strings, limited to axis names and horizontal lines for the moment. (for example, km^2 or CO_2; if needed, most other text could use Reportlab platypus tags)
  • Support for shaded areas illustrating hazard levels at specific time periods (e.g. 'recent temperatures')
  • New parameters to describe the assessed hazard (valid) range and axis range in a clearer way.
  • Ember-related metadata (experimental feature for future uses). Columns at the right of an ember's data are interpreted as ember-related metadata. Metadata names (keys) needs to be provided in a header line.

Changes:

  • Important bug fix / improvement: previous versions might have failed if the bottom of hazard axis was not zero, although that may only have been the case when the bottom would be below zero.
  • Several coding improvements: simplified methods to draw ember gradients, simplified and improved mechanism to handle parameters, integration between parameter definitions, default values, and documentation.
  • Compatible with Python 3.9; xlrd library replaced by openpyxl.
  • Improved documentation, including lists of parameters with a description of their purpose.
  • Improved control on the choice of color palette from the UI and from the graph parameter sheet; Users can now chose between following indications in spreadsheets of forcing either the default RGB or CMYK palette
  • Harmonisation of parameters names, including for file metadata.
  • Partial reorganisation of embermaker.py for clarity and to enable use of its elements within another context This mainly means that the embermaker function is split into a few parts handling specific tasks within the makember.py module.
  • Improved site navigation with ability to come back to the produced diagram after viewing other pages.
  • The "START" keyword is no longer requested in the basic format.

[1.3.0] - 2020-09-05

Embermaker version changes to [1.3.0] (mainly due to the extension of the basic format).

Changed

  • Improved site layout (sticky navbar to allow for a longer 'examples' page...)
  • Input data consistency check: minor change to how the warning for decreasing risk = f(hazard) is generated (this is only a warning since the situation might occur, but is unusual)
  • File format error reporting improvements
  • Better formatting of diagrams with only one ember
  • Preselected color space in the UI (start.html) changed to RGB, with the possibility to set it as an app configuration parameter ('UI_PREFERRED_COLOR_SPACE') in emberfactory.cfg

Added:

  • Basic input format: support for optional 'Median' risk level
  • Basic input format: add software_version_min, the minimum app version number which is needed to process that file
  • File format version verification ('Basic format' Excel file parameter: software_version_min)
  • Option (button) to delete the input .xlsx file after an app crash (error which is not explicitly handled)
  • Color and labels option for "grid lines" (haz_grid_lines_colors, haz_grid_lines_labels), such as to show scenarios in SROCC fig 5.16

[1.2.0] - 2020-05-25

Embermaker version changes to [1.2.0].

Changed

  • Coding improvements in embermaker (the code for drawing ember diagrams). The objective is to keep the same output graphic but produce it in a clearer and potentially safer way. It focuses on specific code changes previously indicated as 'todo'.
  • Revised layout and site structure, with separate examples and information pages.

Added

  • Vertical legends are now possible
  • Title for the legend
  • Documentation page about the examples and a new example ("Basic+layout")

[1.1.3] - 2020-05-21

Changed

  • Layout improvements and integration of the error page with the base template.

[1.1.2] - 2020-05-16

Added

  • Privacy: User files are deleted by default, with the option to keep the data to help development.
  • Security: files larger than a given size will not be uploaded.

[1.1.1] - 2020-05-15

Added

  • Security: Excel files are now read with openpyxl, using defusedxml as a protection from certain xml parsing based attacks (see https://pypi.org/project/defusedxml/ ) Files are not read if uncompressing them would result in a size above the expected needs.
  • Optional definition of a root application path (=> instance/emberfactory.cfg)

Changed

  • First version based on the Flask web framework (https://flask.palletsprojects.com/). The project's directory structure was updated to follow basic Flask practices
  • Runs under Python 3.x (previously python 2.x only)

[1.0.3.] - 2020-02

  • limited to personal use of researchers, with a private link only. In this version, the ember drawing code was well tested, but the web interface was based on mod_python, and thus needed replacement.

Project details


Download files

Download the file for your platform. If you're not sure which to choose, learn more about installing packages.

Source Distribution

EmberFactory-2.0.3.tar.gz (1.1 MB view hashes)

Uploaded Source

Built Distribution

EmberFactory-2.0.3-py3-none-any.whl (1.1 MB view hashes)

Uploaded Python 3

Supported by

AWS AWS Cloud computing and Security Sponsor Datadog Datadog Monitoring Fastly Fastly CDN Google Google Download Analytics Microsoft Microsoft PSF Sponsor Pingdom Pingdom Monitoring Sentry Sentry Error logging StatusPage StatusPage Status page