
Calculation of trending concordance between two measures using the Error Field method

Project description
ErrorFieldConcordance
Thie package provides calculation (and optionally graphing) of concordance (trending agreement) between two measures using an error field method. It was designed for cardiac output trending but the method is valid for any two measures of the same parameter (for example by different devices or different estimation methods), so long as the reporting units for both measures are the same.
Function Call
After importing the package, the method can be called as follows:
Concordance = ErrorFieldConcordance(X,Y,IDS=[], plot_TF=False,graph_label='',X_name='ΔCOa (Lpm)',Y_name='ΔCOb (Lpm)',min_plot_range=3,decolor_threshold=2,silent=False,weight_histogram=True,print_weight_table=True)
Function Parameters:
- The X and Y parameters are lists or arrays of equal size corresponding to paired measures to be compared. These should be the observations themselves (not the changes observed between observations).
- IDS is a list of the same length as X & Y containing subject identifiers for individual subjects in the lists. If all of the observations are from the same subject this parameter can be empty.
- plot_TF is a boolean that controls whether or not figures are created.
- graph_label is an optional string parameter to be placed in the graph title.
- XMeasName and YMeasName are used to customize the X and Y graph labels if desired
- MinPlotRange can be used to extend the plot range if desired. Normally the plot axes will include ± the largest absolute change observed, but if this range is too small the MinPlotRange parameter can be used to fix a minimum axis range.
- decolor_threshold sets the radius for the desaturation circle at the center of the graph. This is a graphical/appearance modifier only, it has no effect on the calculation of the Error Field Concordance value, but is useful to visually represent the central region where points are weighted the least in the final calculation.
- 'silent' - setting this to true will silence all printed output to the console (including errors and warnings)
- weight_histogram is default set to true and will product a histogram plot of the final weights used in the error field concordance calculation
- print_weight_table is default set to true and will print a table to the console that includes the observed x and y changes and the corresponding score and weight assigned.
Notes
The observations passed in X & Y (and the corresponding subject identifiers in IDs) should be grouped by subject and ordered temporally. The function will then calculate the changes in successive observations within subjects. If X, Y, and IDS are not grouped by subject and ordered by time results will be invalid.
Time differences in the observations should be based on the aims of the project; the function itself is agnostic to the specifics. Ideally the time differences are all the same, otherwise interpretation of the graph and results may be biased.
The function will now issue a warning if the average observed magnitude of changes is low (less than around < 0.75 lpm for more than 75% of measures). In this circumstance the clinical noise and measurement error of cardiac output will have a stronger influence on the reported measure and the result should be interpreted with caution. (Note: this warning will not print if the "silent" calling parameter is set to True).
Output
The returned value is a tuple of (error field concordance %, weighted standard deviation %).
The error field concordance value is a number in the range of [-100,100]:
- Values > 60% indicate strong concordance.
- Values between +10% and +60% indicate concordance.
- Values between -10% and +10% indicate relative independence, or low overall change in the sample.
- Values between -60% and -10% indicate discordance.
- Values less than -60% indicate strong discordance.
Graphing
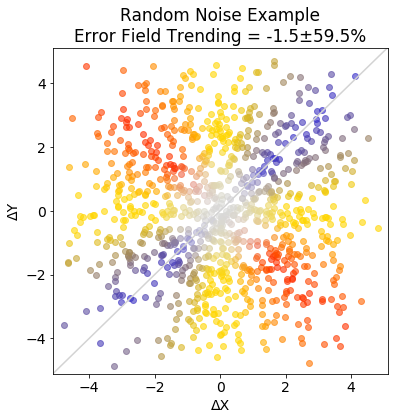
The figure above shows an Error Field Concordance plot for two 1,000 sample arrays of noise (i.e. independent samples). The data demonstrates the fields in the plot, with blue zones indicating concordance (the measures move in the same direction and magnitude), red zones indicating discordance (the measures move in opposite directions), and yellow zones indicating relative independence of movement.
Citing
Please cite this package using the following: PubMed Reference & Citation TBD
Contributors
Thanks go out to Bernd Saugel, Sean Coeckelenbergh, Ishita Srivastava, and Brandon Woo for their collective contributions to this project.


Download files
Download the file for your platform. If you're not sure which to choose, learn more about installing packages.
Source Distributions
Built Distribution
Filter files by name, interpreter, ABI, and platform.
If you're not sure about the file name format, learn more about wheel file names.
Copy a direct link to the current filters
File details
Details for the file errorfieldconcordance-1.0.2-py3-none-any.whl.
File metadata
- Download URL: errorfieldconcordance-1.0.2-py3-none-any.whl
- Upload date:
- Size: 7.4 kB
- Tags: Python 3
- Uploaded using Trusted Publishing? No
- Uploaded via: twine/6.0.1 CPython/3.12.6
File hashes
| Algorithm | Hash digest | |
|---|---|---|
| SHA256 |
3f6f9982eeefe11ebfc8c2f519980b881727eaad377861b36c73cbc6d5122c8f
|
|
| MD5 |
655597aad3ef24234e05cbf70b8313b6
|
|
| BLAKE2b-256 |
1cb33e653c7940f8d03d0d5aabd5b93e874da05462792a460789d8660bb8282e
|






