Package for multiple exoplanet system modelling
Project description
ExoplanetPy
ExoplanetPy is a python package for modelling the transit light curves of systems with multiple exoplanets orbiting around their host stars.
To obtain transit curves, set up the Keplerian orbital elements for each planet in the system.
The Planet() class handles each planet's orbital elements, and the System() class can be used to plot the final transit curves.
The following orbital elements are set up:
- e: eccentricity
- a: semi-major axis
- omega: argument of periapsis (ω)
- Omega: longitude of ascending node (Ω)
- i: orbital inclination
- r_p: planet:star radius
Each Planet() can have different initial true anomaly (ν) values, varied by the first_periastron time argument.
Installation
Installation is recommended via pip for Python 3.
pip install exoplanetpy
The package can then be imported using:
import ExoplanetPy
Usage
Access the modules using the following statements.
from ExoplanetPy import Planet
from ExoplanetPy import System
Transit Curves
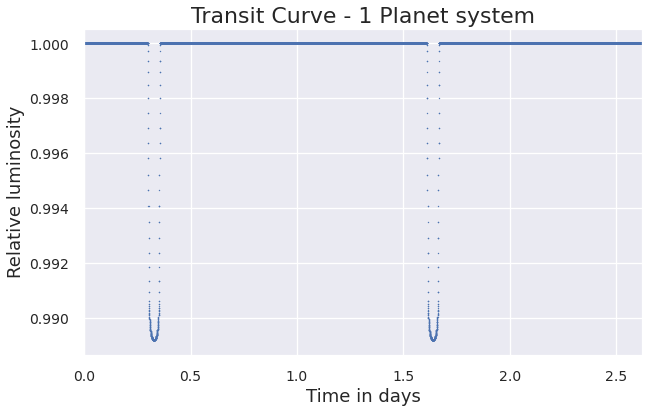
Define a single Planet() and input as planet_list argument in System().
Limb darkening models are chosen in the plot() method.
p1 = Planet(e=0.0, a=8, omega=0, Omega=0, i=89.9, r_p=0.1, first_periastron=0.0)
sys = System(star_prop={'Mass': 4}, planet_list=[p1], sort=True)
sys.plot(model='Quadratic', normalise=True)
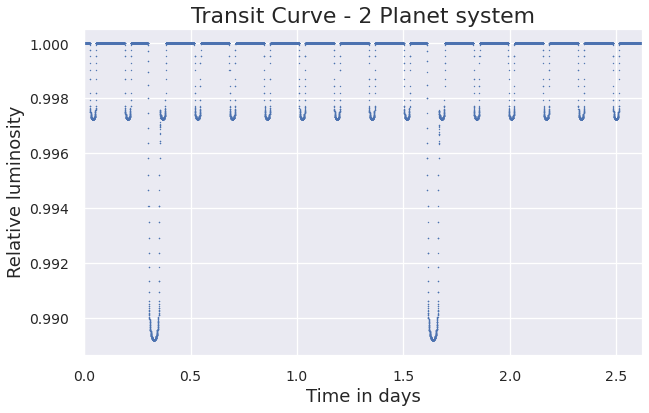
Additional Planet() objects are inputted as planet_list argument in System().
p1 = Planet(e=0.0, a=8, omega=0, Omega=0, i=89.9, r_p=0.1, first_periastron=0.0)
p2 = Planet(e=0.0, a=2, omega=0, Omega=0, i=89.9, r_p=0.05, first_periastron=0.0)
sys = System(star_prop={'Mass': 4}, planet_list=[p1,p2], sort=True)
sys.plot(model='Quadratic', normalise=True)
Direct Imaging
Take the following planetary system:
p1 = Planet(e=0.0, a=8, omega=0, Omega=0, i=89, r_p=0.1, first_periastron=0.03)
p2 = Planet(e=0.0, a=4, omega=0, Omega=0, i=89, r_p=0.07, first_periastron=0.52)
p3 = Planet(e=0.0, a=2, omega=0, Omega=0, i=87, r_p=0.05, first_periastron=0.0)
sys = System(star_prop={'Mass': 4}, planet_list=[p1, p3, p2], sort=True)
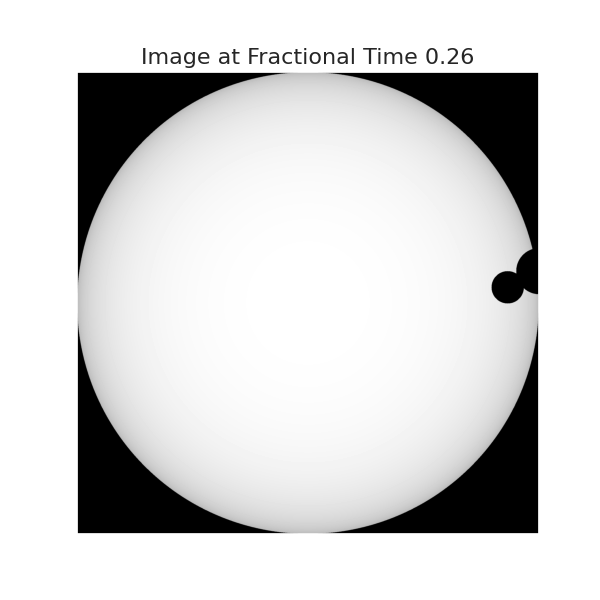
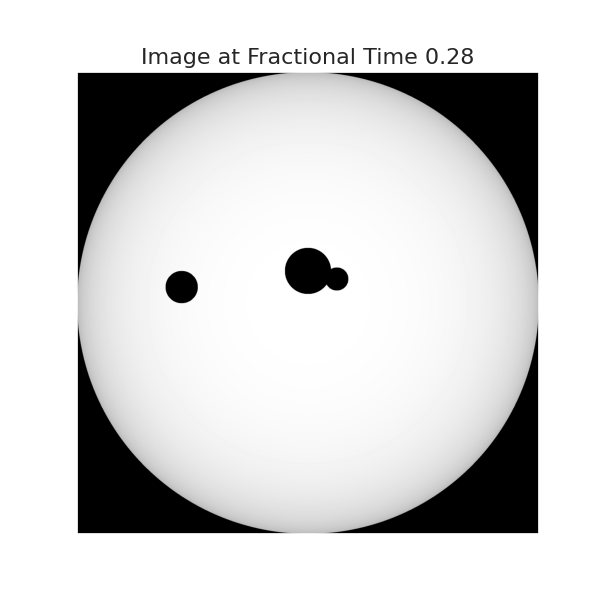
The visualize() method allows the user to obtain visual images of the actual transit.
sys.visualize(time=0.26, model='Quadratic')
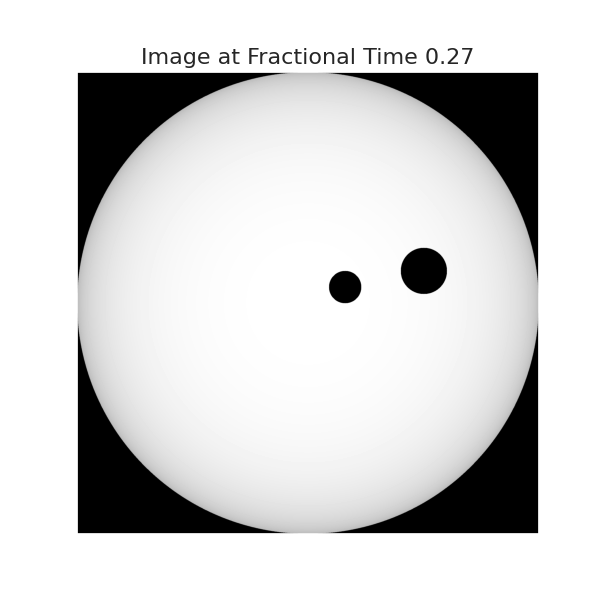
Changing the fractional time parameter allows the user to obtain images at any point during transit.
sys.visualize(time=0.27, model='Quadratic')
Similarly, for time = 0.28:
sys.visualize(time=0.28, model='Quadratic')
Dependencies
ExoplanetPy has the following dependencies:
- NumPy
- SciPy
- Matplotlib (produce plots)
- Seaborn (stylize plots)
License
MIT License
© 2020 ExoplanetPy
Project details
Download files
Download the file for your platform. If you're not sure which to choose, learn more about installing packages.
Source Distribution
Built Distribution
Filter files by name, interpreter, ABI, and platform.
If you're not sure about the file name format, learn more about wheel file names.
Copy a direct link to the current filters
File details
Details for the file ExoplanetPy-0.1.1.tar.gz.
File metadata
- Download URL: ExoplanetPy-0.1.1.tar.gz
- Upload date:
- Size: 5.3 kB
- Tags: Source
- Uploaded using Trusted Publishing? No
- Uploaded via: twine/3.2.0 pkginfo/1.5.0.1 requests/2.22.0 setuptools/50.3.0 requests-toolbelt/0.9.1 tqdm/4.46.0 CPython/3.7.9
File hashes
| Algorithm | Hash digest | |
|---|---|---|
| SHA256 |
5630eb3f6b9adab1717e7daaed0fdeb9bfb559eab930689b757f14750d6db5f2
|
|
| MD5 |
7db3ecc33a888f641afe46d8703eb043
|
|
| BLAKE2b-256 |
473519defa55204dbf5d65bb87709c7cdacb25ddcef785a98ffa155b5dc38361
|
File details
Details for the file ExoplanetPy-0.1.1-py3-none-any.whl.
File metadata
- Download URL: ExoplanetPy-0.1.1-py3-none-any.whl
- Upload date:
- Size: 7.0 kB
- Tags: Python 3
- Uploaded using Trusted Publishing? No
- Uploaded via: twine/3.2.0 pkginfo/1.5.0.1 requests/2.22.0 setuptools/50.3.0 requests-toolbelt/0.9.1 tqdm/4.46.0 CPython/3.7.9
File hashes
| Algorithm | Hash digest | |
|---|---|---|
| SHA256 |
f448565b8963c17fcd6b21b94aaff1c3f4f10d4612282e353d4b6d811f004624
|
|
| MD5 |
a4c6cf1f22060e2b9d2e112facf8fc04
|
|
| BLAKE2b-256 |
956238540a25c77430dd9fc7dbddd0e76406934c57eb74c5b8879bedc320598f
|


