









As a private investor, the sheer amount of information that can be found on the internet is rather daunting. Trying to understand what types of companies or ETFs are available is incredibly challenging, with millions of companies and derivatives available on the market. Sure, the most traded companies and ETFs can quickly be found simply because they are known to the public (for example, Microsoft, Tesla, S&P 500 ETF, or an All-World ETF). However, what else is out there is often unknown.
This is why I created the FinanceDatabase, a database featuring 300,000+ symbols containing Equities, ETFs, Funds, Indices, Currencies, Cryptocurrencies and Money Markets. It allows you to obtain a broad overview of sectors, industries, types of investments and much more, entirely for free. Everything is stored in CSV files that anyone can read and edit, so the database grows and improves through the community.
The aim of this database is explicitly not to provide up-to-date fundamentals or stock data, as those can be obtained with ease (with the help of this database) by using the Finance Toolkit 🛠️. Instead, it gives insights into the products that exist in each country, industry and sector and provides the most essential information about each product. With this information, you can analyze specific areas of the financial world and/or find a product that is hard to find. By utilising both, it is possible to do a fully-fledged competitive analysis with the tickers found from the FinanceDatabase inputted into the FinanceToolkit.
Some key statistics of the database:
| Asset class | Symbols | Exchanges | Coverage | |
|---|---|---|---|---|
| 🏢 | Equities | 123,326 | 87 | 11 sectors · 69 industries · 118 countries |
| 📦 | ETFs | 44,429 | 64 | 605 issuers · 34 categories |
| 💼 | Funds | 58,148 | 34 | 1,560 fund families · 71 categories |
| 📈 | Indices | 80,287 | 63 | 42 categories |
| 💱 | Currencies | 2,556 | – | 178 currencies |
| 🪙 | Cryptocurrencies | 3,378 | – | 352 coins · 12 quote currencies |
| 🏦 | Money Markets | 1,209 | 2 | 136 fund families |
| Total | 313,333 |
🔌 The Finance Database is also available as an MCP Server
Explore all 300,000+ symbols from Claude, Copilot, Cursor, Windsurf or any MCP-compatible client without writing code. No API key needed.
- Hosted: connect to
https://financedatabase.jeroenbouma.com/mcp— nothing to install and no API key. - Local:
uvx --from "financedatabase[mcp]" financedatabase-mcp-setup— sets up your client config automatically. See MCP Server for manual setup.
Table of Contents
Installation
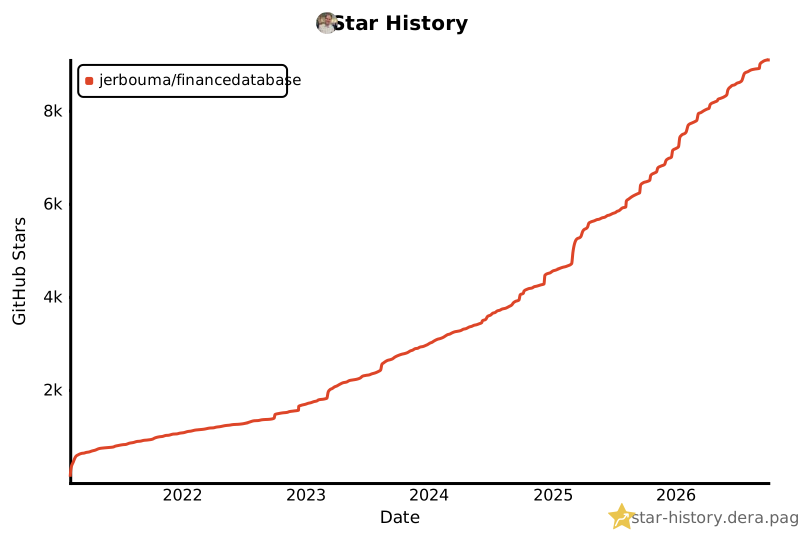
Before installation, consider starring the project on GitHub which helps others find the project as well.
To install the FinanceDatabase it simply requires the following:
pip install financedatabase -U
Then within Python use:
import financedatabase as fd

equities = fd.Equities()
No API key is needed. Each asset class is downloaded once and cached locally, see Questions & Answers for how the cache works.
Functionality
This section is an introduction to the FinanceDatabase. Find with the link below a Jupyter Notebook in which you can see many more examples, including the full output of each query.
A basic example of how to use the FinanceDatabase is shown below. Every code snippet in the sections that follow builds on this same equities instance. Initialization of each asset class is only required once, so save it to a variable to query the database much more quickly.
import financedatabase as fd

# Initialize the Equities database
equities = fd.Equities()

# Select all equities
equities.select()
A portion of the output is shown below. The tables in this section are cut off to five entries and a selection of the columns due to the sheer size of the database.
| symbol | name | currency | sector | industry | exchange | market | country | market_cap | isin |
|---|---|---|---|---|---|---|---|---|---|
| AAPL | Apple Inc. | USD | Information Technology | Technology Hardware, Storage & Peripherals | NMS | NASDAQ Global Select | United States | Mega Cap | US0378331005 |
| ASML.AS | ASML Holding N.V. | EUR | Information Technology | Semiconductors & Semiconductor Equipment | AMS | Euronext Amsterdam | Netherlands | Mega Cap | NL0010273215 |
| 7203.T | Toyota Motor Corporation | JPY | Consumer Discretionary | Automobiles | JPX | Tokyo Stock Exchange | Japan | Mega Cap | JP3633400001 |
| NESN.SW | Nestle S.A. | CHF | Consumer Staples | Food Products | EBS | SIX Swiss Exchange | Switzerland | Mega Cap | CH0038863350 |
| SAP.DE | SAP SE | EUR | Information Technology | Software | GER | XETRA | Germany | Mega Cap | DE0007164600 |
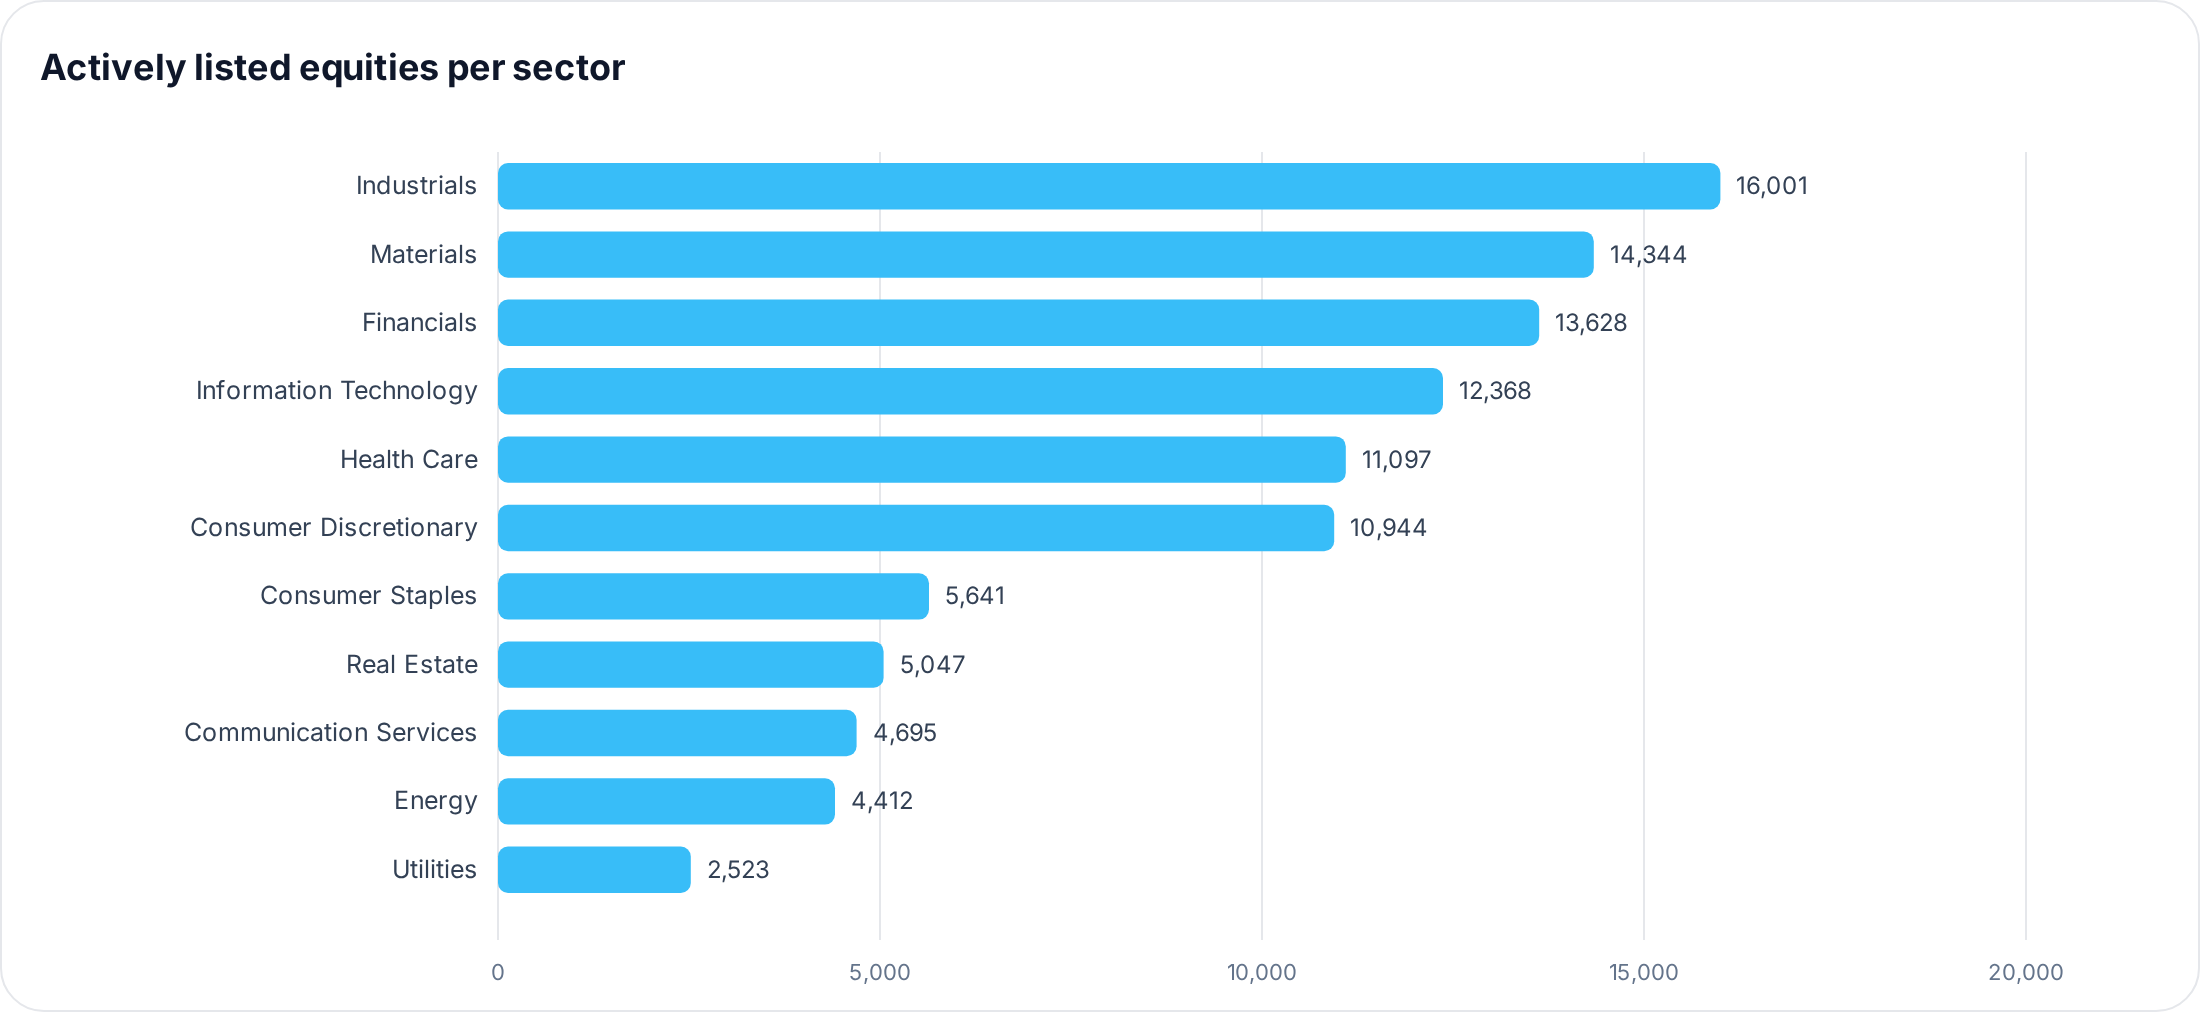
And below the actively listed equities are counted per sector.
Each asset class has the same three functions: select to filter on the database's categories, search to look for any text in any column and show_options to see which values a category can take. The asset classes are fd.Equities(), fd.ETFs(), fd.Funds(), fd.Indices(), fd.Currencies(), fd.Cryptos() and fd.MoneyMarkets().
Three capabilities cut across all of them:
- Lists of values. Every filter accepts a single value or a list, e.g.
country=['Netherlands', 'Belgium'], returning the entries that match any of them. only_primary_listingandexclude_delisted. A company is often listed on many exchanges.only_primary_listing=Truekeeps only its primary listing, and delisted symbols are left out by default (exclude_delisted=Falseto include them).- pandas or Polars. Queries run lazily with Polars and return a pandas DataFrame by default, or a Polars DataFrame with
as_pandas=False.
Exploring the Options
With show_options, all possible options are given per column. This is useful as it doesn't require loading the larger data files.
# Show the options of every column of the equities
options = fd.show_options("equities")

# Select the sectors
options["sector"]
This returns the eleven sectors used for equities, which approximate GICS:
['Communication Services', 'Consumer Discretionary', 'Consumer Staples',
 'Energy', 'Financials', 'Health Care', 'Industrials',
 'Information Technology', 'Materials', 'Real Estate', 'Utilities']
Once an asset class is loaded, show_options is also available on the class itself, where it shows the options that remain after filtering. For example, the industries of the financial companies in the Netherlands:
# Show the industries of financial companies in the Netherlands
equities.show_options(
    selection="industry",
    sector="Financials",
    country="Netherlands",
)
Which returns:
['Banks', 'Capital Markets', 'Consumer Finance',
 'Diversified Financial Services', 'Insurance']
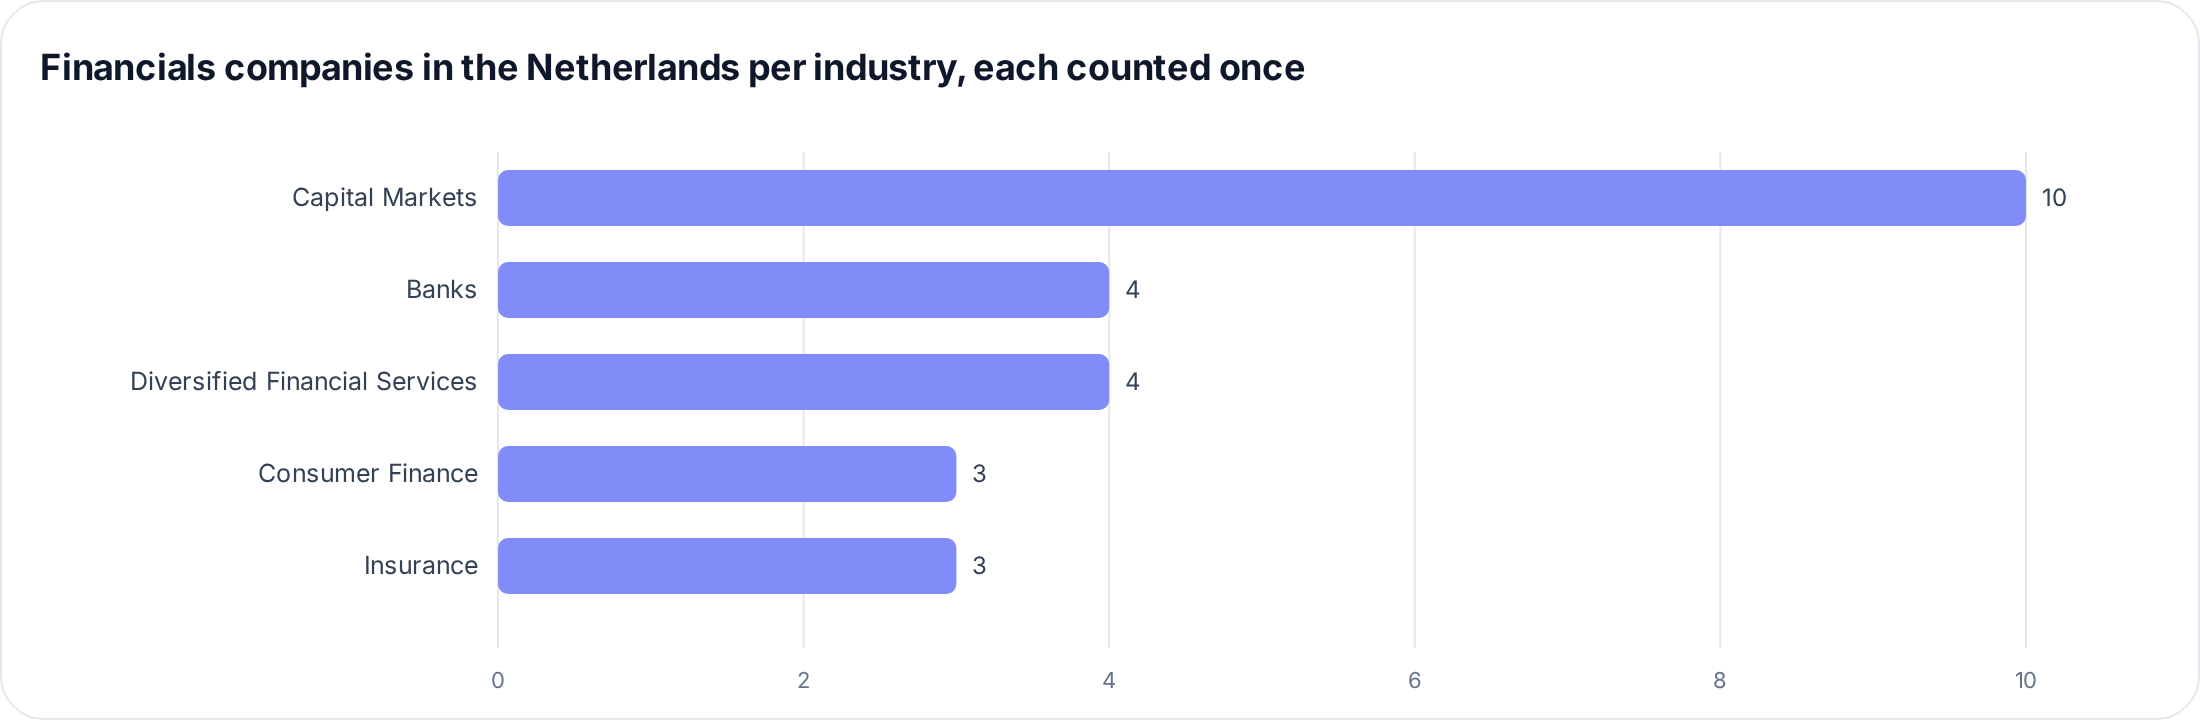
And below the number of companies in each of these industries is shown. Each company is counted once, however many exchanges it is listed on: listings that share an ISIN, share class FIGI, website or the first word of their name (such as Aegon and its perpetual bonds) are combined.
The options of every column can be shown this way, including currency, exchange, market, country and market_cap (Mega, Large, Mid, Small, Micro and Nano Cap). Find the Notebook here and the full documentation here.
Selecting Equities
Given these options, it becomes possible to filter the database on the categories you are interested in. For example, the 'Insurance' companies in the 'United States', one row per company. The sector can be omitted here since the industry already implies 'Financials'.
# Select the primary listings of insurance companies in the United States
equities.select(
    country="United States",
    industry="Insurance",
    only_primary_listing=True,
)
This returns 181 companies, of which a few of the larger ones are shown below.
| symbol | name | currency | sector | industry | exchange | market | country | market_cap |
|---|---|---|---|---|---|---|---|---|
| AFL | Aflac Incorporated | USD | Financials | Insurance | NYQ | New York Stock Exchange | United States | Large Cap |
| AJG | Arthur J. Gallagher & Co. | USD | Financials | Insurance | NYQ | New York Stock Exchange | United States | Large Cap |
| BRO | Brown & Brown, Inc. | USD | Financials | Insurance | NYQ | New York Stock Exchange | United States | Large Cap |
| CINF | Cincinnati Financial Corporation | USD | Financials | Insurance | NMS | NASDAQ Global Select | United States | Large Cap |
| PGR | Progressive Corporation | USD | Financials | Insurance | NYQ | New York Stock Exchange | United States | Large Cap |
Without only_primary_listing=True, the same query returns 454 listings on 23 exchanges, because every exchange a company trades on is shown by default. Progressive, for example, also appears as PGV.F (Frankfurt), PGV.SG (Stuttgart), PGR.MX (Mexico) and P1GR34.SA (B3). Primary listings are the symbols without an exchange suffix, which makes the option mostly useful for US companies. For companies elsewhere, filter on the exchange or market instead.
For the Netherlands, it makes sense to select the market "Euronext Amsterdam" (exchange "AMS"), here together with the market cap:
# Select the large insurance companies on Euronext Amsterdam
equities.select(
    country="Netherlands",
    industry="Insurance",
    market="Euronext Amsterdam",
    market_cap="Large Cap",
)
This gives the following three companies:
| symbol | name | currency | sector | industry | exchange | market | country | market_cap | isin |
|---|---|---|---|---|---|---|---|---|---|
| AGN.AS | Aegon N.V. | EUR | Financials | Insurance | AMS | Euronext Amsterdam | Netherlands | Large Cap | BMG0112X1056 |
| ASRNL.AS | ASR Nederland N.V. | EUR | Financials | Insurance | AMS | Euronext Amsterdam | Netherlands | Large Cap | NL0011872643 |
| NN.AS | NN Group N.V. | EUR | Financials | Insurance | AMS | Euronext Amsterdam | Netherlands | Large Cap | NL0010773842 |
Every filter also accepts a list, so both queries can be combined into one with country=["Netherlands", "United States"] and market=["Euronext Amsterdam", "New York Stock Exchange", "NASDAQ Global Select"]. Equities can be selected on country, sector, industry_group, industry, currency, exchange, mic, market and market_cap. Find the Notebook here and the full documentation here.
Searching the Database
If the categorization doesn't lead to the results you are looking for, search filters on any column via a custom string. If the text is found anywhere in the column, the entry is returned. Searches are not case sensitive unless case_sensitive=True is set, index searches the symbol and, just like select, every argument accepts a list.
# Search for robotics or education companies with equipment on the Frankfurt Stock Exchange
equities.search(
    summary=["Robotics", "Education"],
    industry_group="Equipment",
    market="Frankfurt",
    index=".F",
)
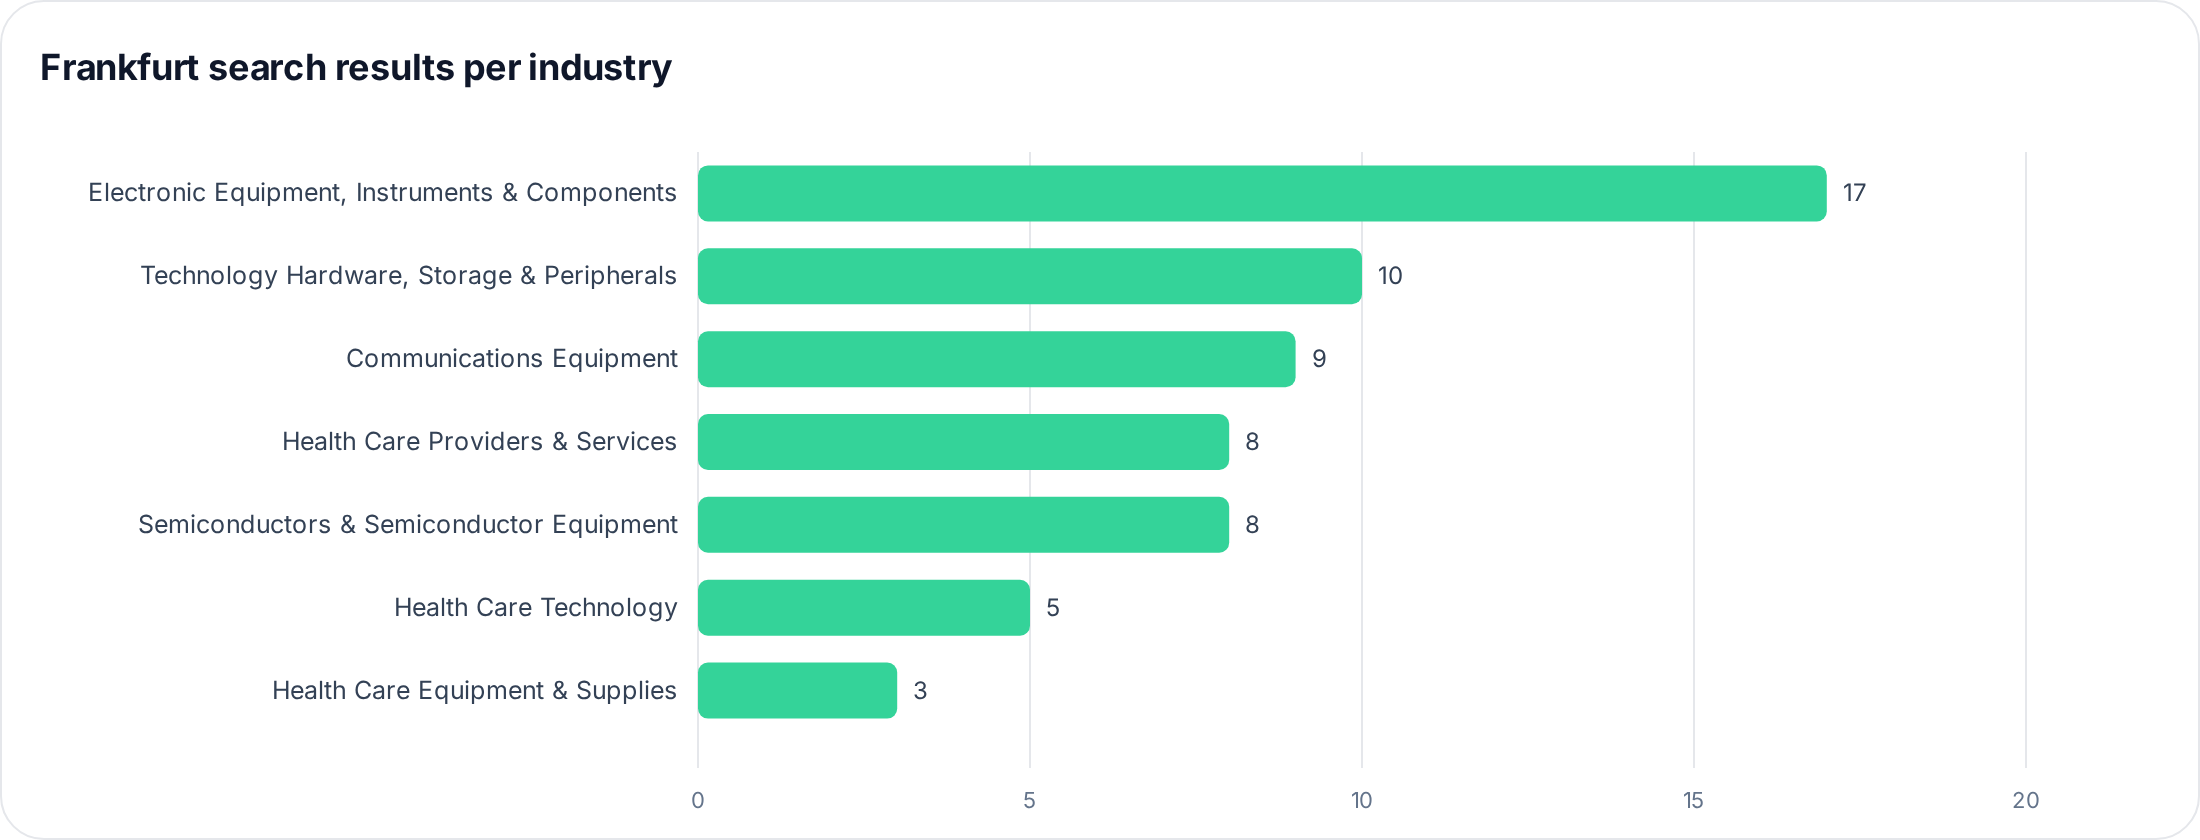
This returns 60 instruments listed on the Frankfurt Stock Exchange, in an industry group containing "Equipment" and with "Robotics" or "Education" in their summary. Filtering on index=".F" is an alternative way to find the exchange or market you are looking for.
| symbol | name | currency | sector | industry | exchange | market | country | market_cap |
|---|---|---|---|---|---|---|---|---|
| 089.F | Cambium Networks Corporation | EUR | Information Technology | Communications Equipment | FRA | Frankfurt Stock Exchange | Cayman Islands | Micro Cap |
| 109.F | Castlight Health, Inc. | EUR | Health Care | Health Care Technology | FRA | Frankfurt Stock Exchange | United States | Small Cap |
| 1KT.F | Keysight Technologies Inc | EUR | Information Technology | Electronic Equipment, Instruments & Components | FRA | Frankfurt Stock Exchange | United States | Large Cap |
| 1N1.F | Nanalysis Scientific Corp. | EUR | Information Technology | Electronic Equipment, Instruments & Components | FRA | Frankfurt Stock Exchange | Canada | Nano Cap |
| 1YO.F | Yangtze Optical Fibre And Cable Joint Stock Limited Company | EUR | Information Technology | Communications Equipment | FRA | Frankfurt Stock Exchange | China | Small Cap |
And below the 60 results are counted per industry.
The search function works on every column of every asset class, including name, isin, cusip and figi. Find the Notebook here and the full documentation here.
Exploring other Asset Classes
All of these functions are also available for the other asset classes. The only difference is the class name and the columns. For example, ETFs use fd.ETFs() and are selected on category_group, category and family instead.
# Initialize the ETFs database
etfs = fd.ETFs()

# Select the Fixed Income ETFs of Vanguard
etfs.select(
    category_group="Fixed Income",
    family="Vanguard Asset Management",
)
For example, see some of the Vanguard bond ETFs listed in Berlin below:
| symbol | name | currency | category_group | category | family | exchange |
|---|---|---|---|---|---|---|
| 0250.BE | Vanguard Intermediate-Term Corporate Bond Index Fund ETF Shares | EUR | Fixed Income | Corporate Bonds | Vanguard Asset Management | BER |
| 0251.BE | Vanguard Short-Term Corporate Bond Index Fund ETF Shares | EUR | Fixed Income | Corporate Bonds | Vanguard Asset Management | BER |
| 0252.BE | Vanguard Total World Bond ETF | EUR | Fixed Income | Investment Grade Bonds | Vanguard Asset Management | BER |
| 025L.BE | Vanguard Total International Bond Index Fund ETF Shares | EUR | Fixed Income | Investment Grade Bonds | Vanguard Asset Management | BER |
| 025N.BE | Vanguard Long-Term Corporate Bond Index Fund ETF Shares | EUR | Fixed Income | Corporate Bonds | Vanguard Asset Management | BER |
The same applies to search, for example to find the funds that focus on pension plans:
# Initialize the Funds database
funds = fd.Funds()

# Search for funds with "Pension" in their summary
funds.search(summary="Pension")
Which returns 628 funds, of which a few are shown below:
| symbol | name | currency | category_group | category | family | exchange |
|---|---|---|---|---|---|---|
| 0P000015HA.F | Casermed Protección 6 PP | EUR | Financials | Allocation | Sa Nostra Seguros de Vida SA | FRA |
| 0P000015V5.F | BK Revalorización Europa 2022 PP | EUR | Financials | Bonds | Bankinter | FRA |
| 0P000015VC.F | Bankia Protegido Renta 2023 PP | EUR | Financials | Bonds | Bankia Fondos | FRA |
| 0P000017AE.F | Santander Universidades RF Mixta PP | EUR | Fixed Income | Bonds | Santander Asset Management SGIIC | FRA |
| 0P000017AF.F | OpenBank Monetario PP | EUR | Cash | Money Market Instruments | Santander Asset Management SGIIC | FRA |
And below all actively listed ETFs are divided over their category groups.
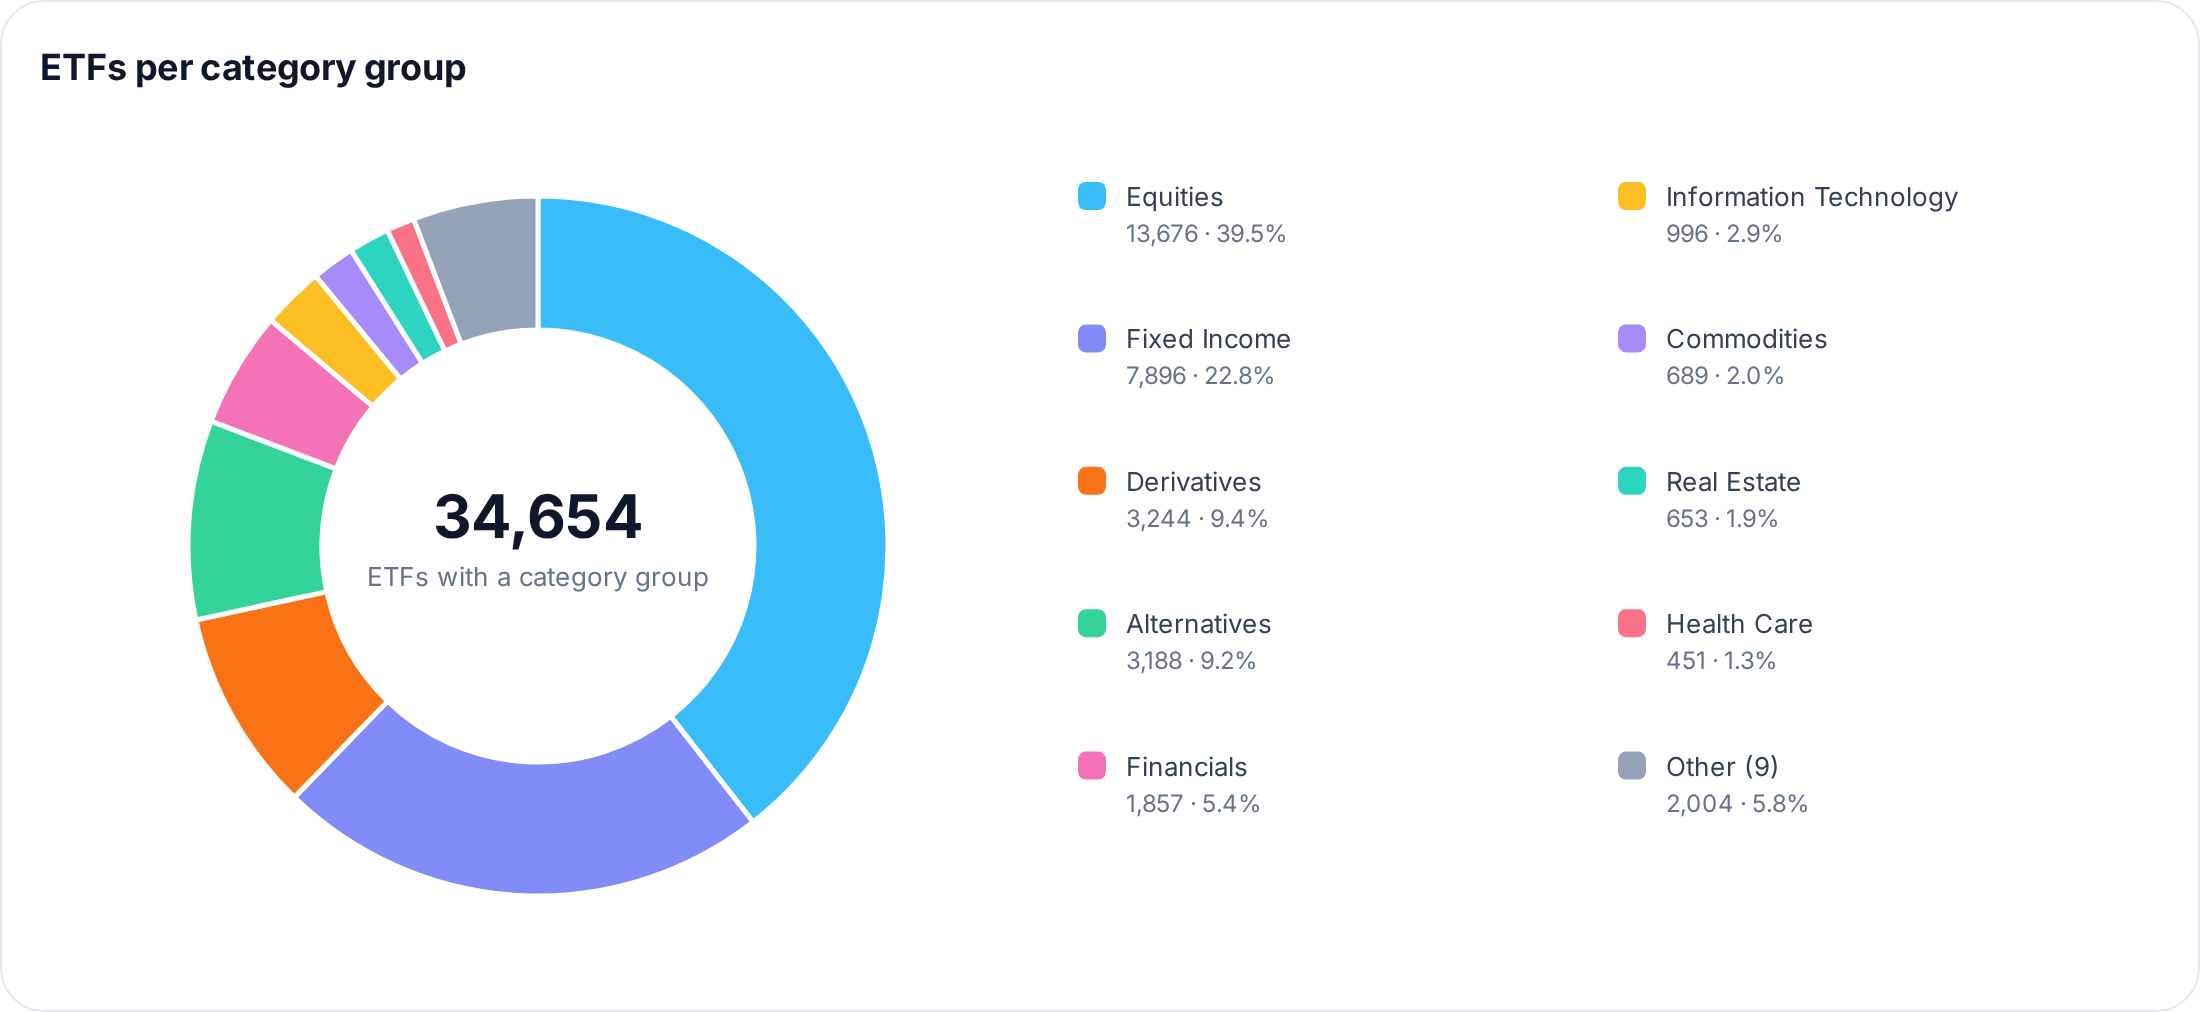
The categories of each asset class can again be found with show_options, e.g. fd.Indices().show_options(selection="category") returns the 42 index categories, from 'Corporate Bonds' and 'Emerging Markets' to 'Small Cap' and 'Value'. Cryptocurrencies are selected on cryptocurrency and currency, currencies on base_currency and quote_currency and money markets on currency and family. Find the Notebook here and the full documentation here.
Combining with the Finance Toolkit
The FinanceDatabase has a direct integration with the Finance Toolkit, making it possible to do financial analysis on the instruments you've found. Any selection can be loaded into the Finance Toolkit with to_toolkit.
To be able to get started, you need to obtain an API Key from FinancialModelingPrep. This is used to gain access to 30+ years of financial statements, both annually and quarterly. Note that the Free plan is limited to 250 requests each day, 5 years of data, and only features companies listed on US exchanges.
Returning to the three large insurance companies in the Netherlands:
# Select the large insurance companies on Euronext Amsterdam
dutch_insurance_companies = equities.select(
    country="Netherlands",
    industry="Insurance",
    market="Euronext Amsterdam",
    market_cap="Large Cap",
)

# Load them into the Finance Toolkit
toolkit = dutch_insurance_companies.to_toolkit(api_key="FINANCIAL_MODELING_PREP_KEY")

# Obtain historical market data for all tickers
historical_data = toolkit.get_historical_data()

# Select the results for ASR Nederland
historical_data.xs("ASRNL.AS", axis=1, level=1)
For example, a portion of the historical data for ASR Nederland is shown below.
| date | Open | High | Low | Close | Adj Close | Volume | Dividends | Return | Cumulative Return |
|---|---|---|---|---|---|---|---|---|---|
| 2026-09-30 | 73.26 | 73.64 | 71.88 | 72.16 | 72.16 | 435324 | 0 | -0.0118 | 3.608 |
| 2026-10-01 | 71.52 | 71.72 | 70.58 | 71 | 71 | 666582 | 0 | -0.0161 | 3.55 |
| 2026-10-02 | 71.14 | 71.54 | 70.66 | 71.48 | 71.48 | 408475 | 0 | 0.0068 | 3.574 |
| 2026-10-05 | 71.5 | 72.36 | 71.4 | 72.16 | 72.16 | 375435 | 0 | 0.0095 | 3.608 |
| 2026-10-06 | 72.44 | 73.1 | 72.4 | 72.82 | 72.82 | 63282 | 0 | 0.0091 | 3.641 |
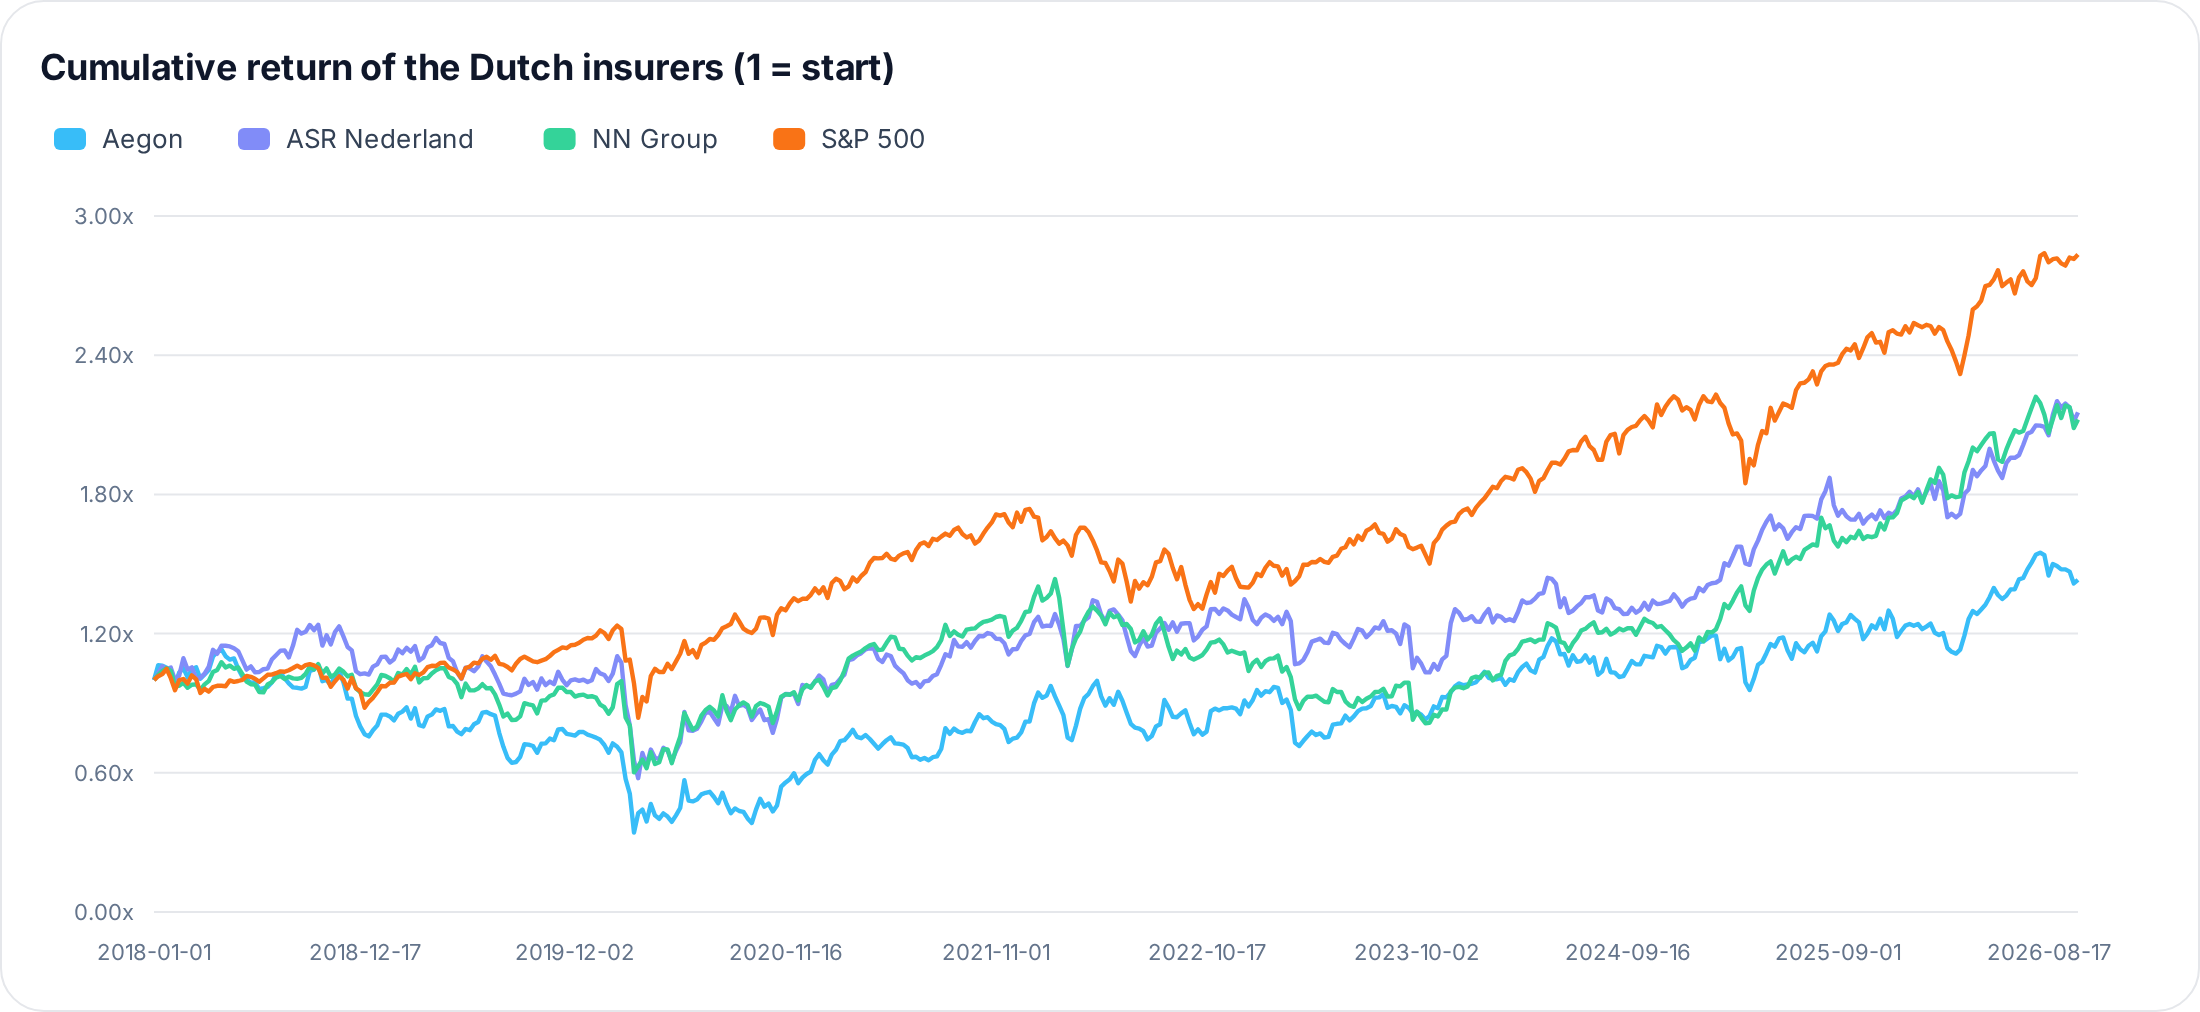
And below the cumulative returns of Aegon, ASR Nederland and NN Group are plotted, including the S&P 500 as benchmark.
Now let's make it more advanced by calculating the profitability ratios for each company:
# Collect all Profitability Ratios for all tickers
profitability_ratios = toolkit.ratios.collect_profitability_ratios()

# Select the results for ASR Nederland
profitability_ratios.loc["ASRNL.AS"]
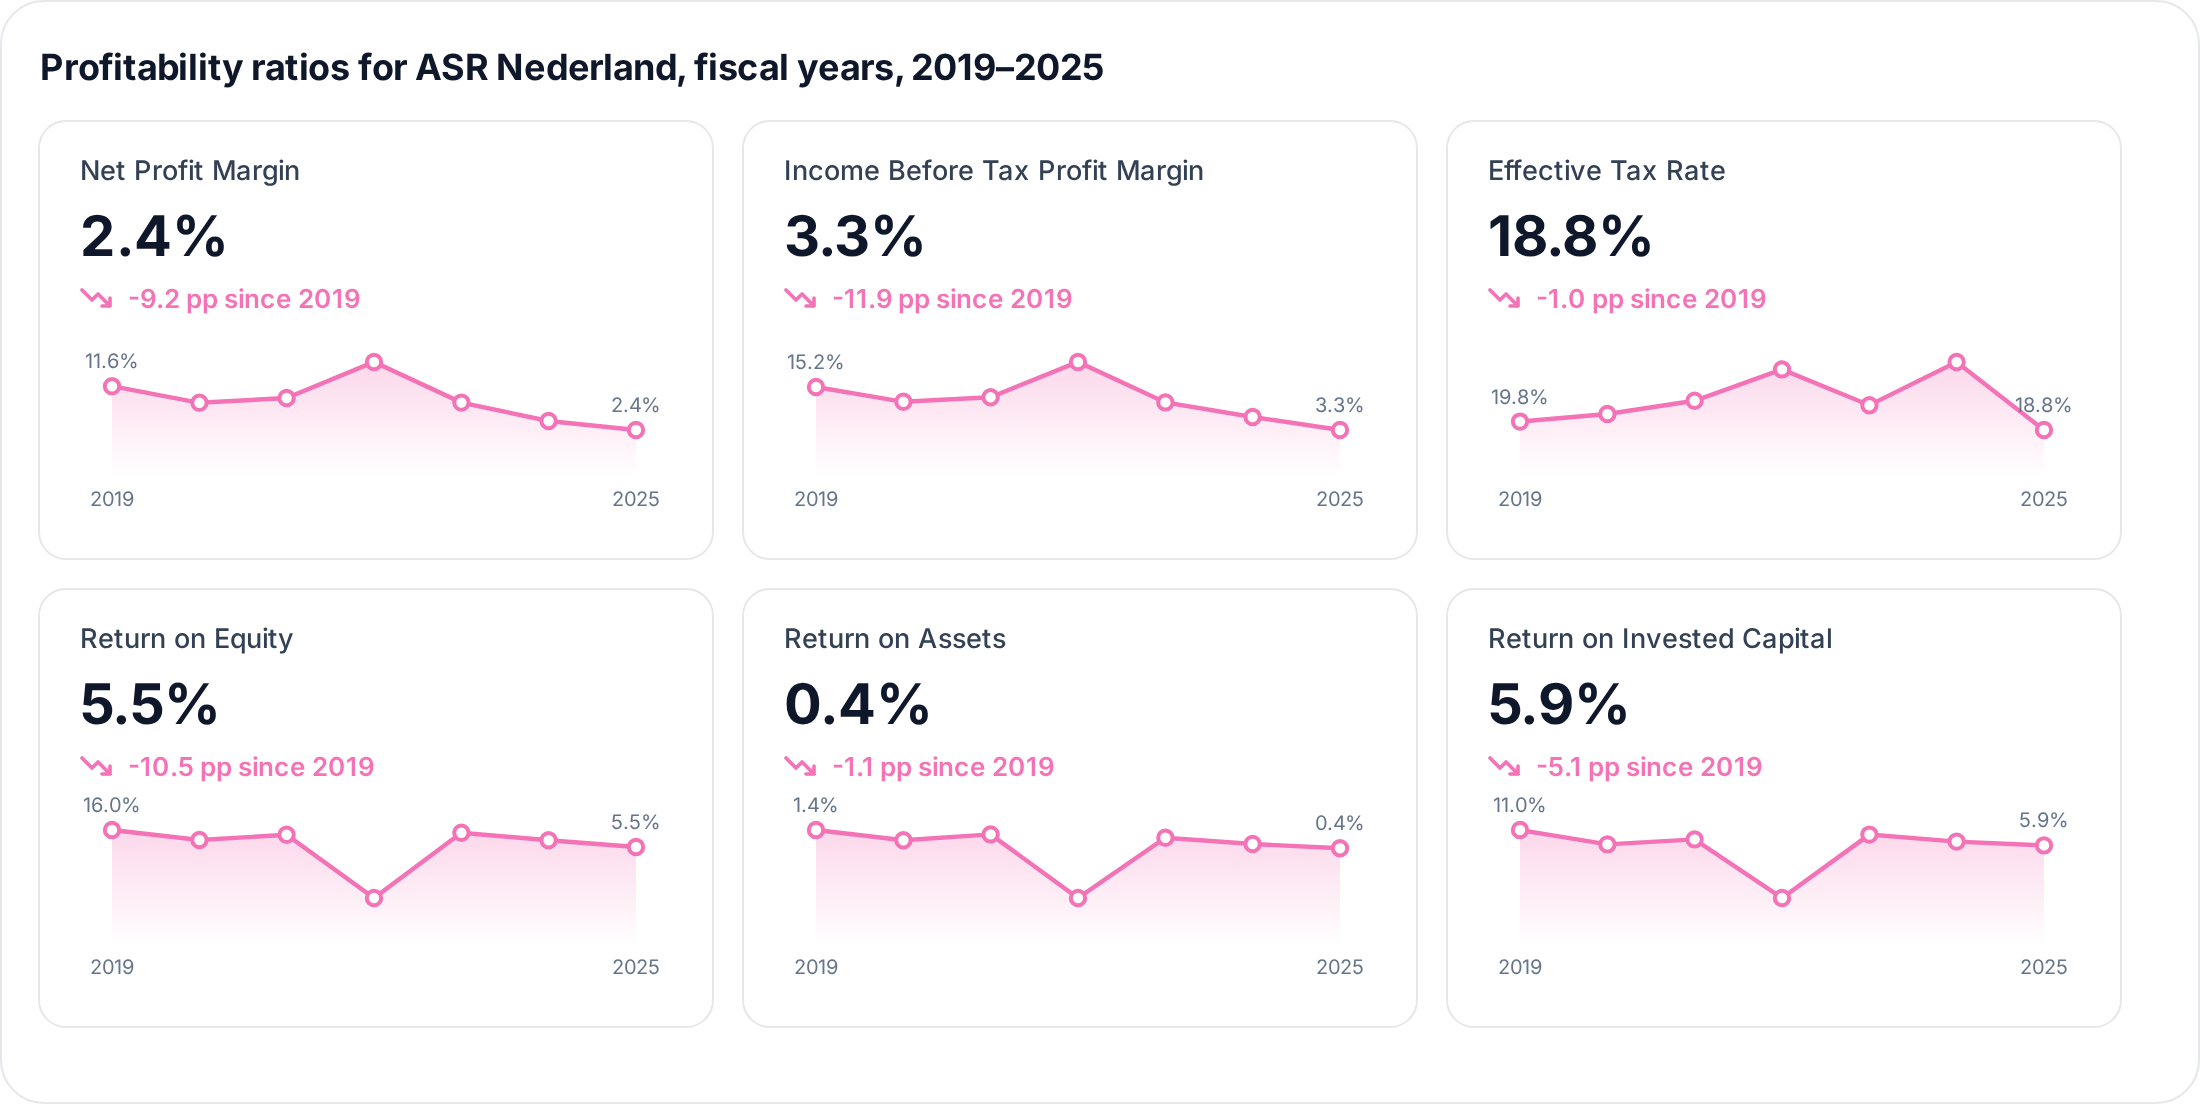
For example, see some of the profitability ratios of ASR Nederland below.
| 2018 | 2019 | 2020 | 2021 | 2022 | 2023 | 2024 | 2025 | |
|---|---|---|---|---|---|---|---|---|
| Net Profit Margin | 0.1055 | 0.116 | 0.0811 | 0.091 | 0.1666 | 0.0814 | 0.0427 | 0.024 |
| Income Before Tax Profit Margin | 0.1564 | 0.1515 | 0.1104 | 0.1231 | 0.2202 | 0.1089 | 0.0688 | 0.0328 |
| Effective Tax Rate | 0.2168 | 0.1983 | 0.2075 | 0.2233 | 0.2609 | 0.2181 | 0.2699 | 0.1882 |
| Return on Assets | 0.0107 | 0.0144 | 0.0083 | 0.0118 | -0.0259 | 0.0098 | 0.0061 | 0.0036 |
| Return on Equity | 0.1118 | 0.16 | 0.0982 | 0.1305 | -0.2591 | 0.1427 | 0.0969 | 0.0552 |
And below these and other profitability ratios of ASR Nederland, each with its latest value, the change over the period and its trend.
This works for the other asset classes too. For example, Ethereum quoted in BTC, CAD, EUR, GBP and USD can be loaded with fd.Cryptos().select(cryptocurrency="ETH").to_toolkit(api_key=...), after which get_historical_data(period="quarterly") returns its quarterly returns in each currency. This is just a small snippet of what is available within the Finance Toolkit, see the GitHub page of the Finance Toolkit here or the example Notebook here for more information.
MCP Server
The Finance Database MCP Server gives any AI assistant that supports the Model Context Protocol (MCP) direct access to the database. Ask in plain English for, say, every mid cap semiconductor company in Taiwan or the bond ETFs of a given issuer, and the assistant queries the database on your behalf. No API key is needed. Combine it with the Finance Toolkit MCP Server to go from a list of symbols to their financial statements, ratios and prices.
Remote server
Connect directly to the hosted server at https://financedatabase.jeroenbouma.com/mcp. Nothing needs to be installed locally and no API key or sign-in is required. See the privacy policy for what the hosted server processes.
| Client | Steps |
|---|---|
| Claude Desktop | Customize → Connectors → Add custom connector → paste the URL |
| Claude.ai | Customize → Connectors → Add custom connector → paste the URL |
| Claude Code | claude mcp add --transport http finance-database https://financedatabase.jeroenbouma.com/mcp |
| VS Code | Command Palette → MCP: Add Server → HTTP → paste the URL |
| Cursor | Settings → Features → MCP Servers → Add new → http → paste the URL |
| Windsurf | Settings → MCP Servers → Add Server → Remote/HTTP → paste the URL |
Local installation
Run the setup wizard — it locates your client's config file (Claude Desktop, Claude Code, VS Code, Cursor, Gemini CLI or Windsurf) and adds the server automatically:
uvx --from "financedatabase[mcp]" financedatabase-mcp-setup
For manual config, add the following to your client's MCP config file (e.g. claude_desktop_config.json, .cursor/mcp.json; VS Code's .vscode/mcp.json uses servers instead of mcpServers):
{
  "mcpServers": {
    "finance-database": {
      "command": "uvx",
      "args": ["--from", "financedatabase[mcp]", "financedatabase-mcp"]
    }
  }
}
For Claude Code: claude mcp add finance-database -- uvx --from "financedatabase[mcp]" financedatabase-mcp. Alternatively, download the Finance Database MCPB bundle and open it with Claude Desktop. The data is downloaded once, cached locally and checked for updates at most once a day, exactly like the Python package. financedatabase-mcp-inspector opens the MCP Inspector to try the tools in a browser.
To host the server yourself, run financedatabase-mcp --transport streamable-http --port 8000 or use the included Dockerfile and docker-compose.yml. The server answers /health for health checks, and with FD_MCP_ANALYTICS=1 it also publishes anonymous usage totals (calls per day and per tool, no personal data) at /stats.
Tools
| Tool | What it does |
|---|---|
equities, etfs, funds, indices, currencies, cryptos, moneymarkets |
List the instruments of an asset class matching its select() filters (e.g. country, sector, industry, market_cap for equities; category_group, category, family for ETFs) and/or a free-text query on symbol and name. Filters accept several comma-separated values. Supports include_delisted, only_primary_listing, show_columns, include_summary, limit and offset. |
search_instruments |
Find a symbol by ticker, name or ISIN across all asset classes at once. |
show_options |
Show the valid values of a filter (e.g. every sector or country), optionally narrowed by other filters. |
search_categories |
List the asset classes with their size, filters and description. |
Every response is compact JSON with total, returned, offset, columns and rows, at most 200 rows per call (25 by default), with a _notes hint on how to get the next page. Summaries are left out unless asked for and truncated to 300 characters, so a response never contains the full dataset. Invalid filter values return the package's error message together with suggestions such as "Did you mean 'Information Technology'?".
Example prompts
- "Which Dutch financial companies are Large or Mega Cap?"
- "Find all mid cap semiconductor companies in Taiwan and list their exchanges."
- "What ETFs does Vanguard offer in the Fixed Income category group?"
- "Which ticker belongs to ISIN US0378331005, and on which exchanges is it listed?"
- "List the industries in the Health Care sector and how many German companies are in each."
Questions & Answers
This section includes frequently asked questions. If you have any questions that are not answered here, consider creating an Issue or reach out to me via the contact details below.
How is the data obtained?
The data is an aggregation of various publicly available sources. I strictly maintain the rule that all data in this database must be freely accessible to everyone. Data requiring API keys or paid subscriptions is never included. Information that companies charge for is typically owned and maintained by those companies, making public sharing of such data a violation of their Terms of Service (ToS). However, publicly available data can be freely shared (read more about the legality of web scraping here). This database will always remain completely free.
What categorization method is used?
The categorization for Equities is based on a loose approximation of GICS (Global Industry Classification Standard). This database attempts to reflect sectors and industries as accurately as possible through manual curation, without collecting any actual data from MSCI's proprietary sources. The official GICS datasets curated by MSCI remain the most up-to-date, paid solution and were not used in developing any part of this database. All other categorizations in the database are independently developed and can be freely modified.
How can I find out which countries, sectors and/or industries exist within the database without needing to check the database manually?
For this you can use the show_options function, either for an asset class as a whole (fd.show_options("equities")), which doesn't require any data to be loaded, or on a loaded asset class to see the options that remain after filtering. See Exploring the Options for more information.
When I try collect data I notice that not all tickers return output, why is that?
Some tickers are merely holdings of companies and therefore do not really have any data attached to them. Therefore, it makes sense that not all tickers return data. If you are still in doubt, search the ticker on Google to see if there is really no data available. If you can't find anything about the ticker, consider updating the database by visiting the Contributing Guidelines.
How does the database handle changes to companies over time - like symbol/exchange migration, mergers, bankruptcies, or symbols getting reused?
For American exchanges, the database automatically updates every Sunday using data from this repository. This process includes checks for market cap changes and updates asset classifications accordingly. Delisted tickers are intentionally retained for historical research purposes.
While professional financial data services like Bloomberg charge over $25,000 annually for comprehensive market data maintenance, this database relies on community contributions. When companies outside American exchanges undergo changes (migrations, mergers, bankruptcies), we depend on community members to identify and update these entries.
Most companies don't change so rapidly that the database becomes obsolete - major changes like Facebook's rebrand to META are quickly incorporated. Even when companies go bankrupt, their ticker information remains valuable for historical analysis.
If you notice outdated information, please consider contributing through the Contributing Guidelines.
Is the data downloaded every time I use the package?
No. Each dataset is downloaded once and cached in your user cache folder (or the folder set in FINANCEDATABASE_CACHE_DIR). Once a day the package checks for a newer version and only downloads it when it changed; offline, the cached copy is used. Queries run lazily with Polars and return pandas by default, or Polars with as_pandas=False, e.g. equities.select(country="Canada", as_pandas=False).
Contributing
First off all, thank you for taking the time to contribute (or at least read the Contributing Guidelines)! 🚀
The FinanceDatabase serves the role of providing anyone with any type of financial product categorization entirely for free. To achieve this, it relies on community involvement to add, edit and remove tickers over time. This is made easy enough that anyone, even those with a lack of coding experience, can contribute because of the use of CSV files that can be manually edited with ease.
Below are those that made significant contributions to the project. Thank you!
| User | Contribution |
|---|---|
| dokson | Made very significant contributions to the quality of the database in #138, #139, #140, #141, #142, #143, #144, #145, #146 and #147, added the MIC column (#149), enriched the FIGIs and added 709 missing tickers (#150, #151) and fixed the CI workflows (#154). |
| JonArnfred | Built the identifier validation that now checks every pull request (#159), filled missing share class FIGIs (#158), made the database workflow preserve CSV values exactly as written (#166) and fixed the test suite (#160). |
| AlfaStake | Added ISIN codes for ETFs (#124) and corrected and enriched 229 equity ISINs (#126). |
| pettijohn | Added missing currencies and company names from SEC data (#135, #136). |
| desaijimmy | Made changes to Equities dataset including the Split of Daimler to Mercedes-Benz and Daimler Trucks |
| nindogo | Introduced a variety of new equities from the Nairobi Securities Exchange and introduced the country Kenya into the dataset. |
| colin99d | Helped in the conversion of the Finance Database package to Object-Orientated, making the code much more efficient. |
Contact
If you have any questions about the FinanceDatabase or would like to share with me what you have been working on, feel free to reach out to me via:
- Website: https://jeroenbouma.com/
- LinkedIn: https://www.linkedin.com/in/boumajeroen/
- Email: jer.bouma@gmail.com
If you'd like to support my efforts, either help me out via the Contributing Guidelines or Sponsor Me.
1 maintainer

Metadata
1 maintainer
Release files for financedatabase 2.5.0
For a detailed explanation of source distributions (sdists) and built distributions (wheels), please see the package formats documentation.
Source distribution (sdist)
| File | Size | Uploaded | |
|---|---|---|---|
| financedatabase-2.5.0.tar.gz | 130.9 kB | Details |
Built distribution (wheel)
| File | Interpreter | ABI | Platform | Reset |
|---|---|---|---|---|
| financedatabase-2.5.0-py3-none-any.whl | Python 3 | none | any | Details |
Total release size: 268.4 kB
Release files / financedatabase-2.5.0.tar.gz
| Download URL | financedatabase-2.5.0.tar.gz |
|---|---|
| Size | 130.9 kB |
| Tags | Source |
|
SHA-256 checksum How to use checksums |
63c2c001c267c55a3e7145dac5cd28ee67df5742bd9a4c9dd84db130a7371cf2
|
|
BLAKE2b-256 checksum How to use checksums |
0b55bc2fd7ad79619e816ed1044be576a195a21f10e82089f4ced253817e3727
|
| Upload date | |
|
Uploaded using Trusted Publishing? What is trusted publishing? |
No |
| Uploaded via |
uv/0.9.30 {"installer":{"name":"uv","version":"0.9.30","subcommand":["publish"]},"python":null,"implementation":{"name":null,"version":null},"distro":{"name":"macOS","version":null,"id":null,"libc":null},"system":{"name":null,"release":null},"cpu":null,"openssl_version":null,"setuptools_version":null,"rustc_version":null,"ci":null}
|
Release files / financedatabase-2.5.0-py3-none-any.whl
| Download URL | financedatabase-2.5.0-py3-none-any.whl |
|---|---|
| Size | 137.4 kB |
| Tags | Python 3 |
|
SHA-256 checksum How to use checksums |
16ccdb7ebecc5d04b814063f635c74ca5833210182d2ef243972b257b27445ac
|
|
BLAKE2b-256 checksum How to use checksums |
c656003a0b03a8427ebe48303333bd74b76c8817e4cc26dcd4453f96c24f969d
|
| Upload date | |
|
Uploaded using Trusted Publishing? What is trusted publishing? |
No |
| Uploaded via |
uv/0.9.30 {"installer":{"name":"uv","version":"0.9.30","subcommand":["publish"]},"python":null,"implementation":{"name":null,"version":null},"distro":{"name":"macOS","version":null,"id":null,"libc":null},"system":{"name":null,"release":null},"cpu":null,"openssl_version":null,"setuptools_version":null,"rustc_version":null,"ci":null}
|














